Dietary restriction of isoleucine increases healthspan and lifespan of genetically heterogeneous mice
- PMID: 37939658
- PMCID: PMC10655617
- DOI: 10.1016/j.cmet.2023.10.005
Dietary restriction of isoleucine increases healthspan and lifespan of genetically heterogeneous mice
Abstract
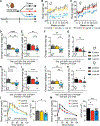
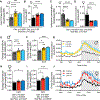
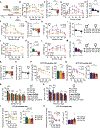
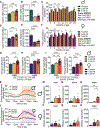
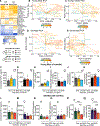
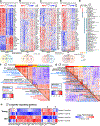
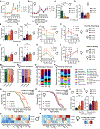
Low-protein diets promote health and longevity in diverse species. Restriction of the branched-chain amino acids (BCAAs) leucine, isoleucine, and valine recapitulates many of these benefits in young C57BL/6J mice. Restriction of dietary isoleucine (IleR) is sufficient to promote metabolic health and is required for many benefits of a low-protein diet in C57BL/6J males. Here, we test the hypothesis that IleR will promote healthy aging in genetically heterogeneous adult UM-HET3 mice. We find that IleR improves metabolic health in young and old HET3 mice, promoting leanness and glycemic control in both sexes, and reprograms hepatic metabolism in a sex-specific manner. IleR reduces frailty and extends the lifespan of male and female mice, but to a greater degree in males. Our results demonstrate that IleR increases healthspan and longevity in genetically diverse mice and suggests that IleR, or pharmaceuticals that mimic this effect, may have potential as a geroprotective intervention.
Keywords: aging; branched-chain amino acids; frailty; isoleucine; lifespan; metabolic health; mice; nutritional interventions; protein restriction.
Copyright © 2023 Elsevier Inc. All rights reserved.
Conflict of interest statement
Declaration of interests D.W.L. has received funding from, and is a scientific advisory board member of, Aeovian Pharmaceuticals, which seeks to develop novel, selective mTOR inhibitors for the treatment of various diseases.
Figures
Similar articles
-
Lifelong restriction of dietary branched-chain amino acids has sex-specific benefits for frailty and lifespan in mice.Nat Aging. 2021 Jan;1(1):73-86. doi: 10.1038/s43587-020-00006-2. Epub 2021 Jan 14. Nat Aging. 2021. PMID: 33796866 Free PMC article.
-
Protein restriction and branched-chain amino acid restriction promote geroprotective shifts in metabolism.Aging Cell. 2022 Jun;21(6):e13626. doi: 10.1111/acel.13626. Epub 2022 May 8. Aging Cell. 2022. PMID: 35526271 Free PMC article. Review.
-
The adverse metabolic effects of branched-chain amino acids are mediated by isoleucine and valine.Cell Metab. 2021 May 4;33(5):905-922.e6. doi: 10.1016/j.cmet.2021.03.025. Epub 2021 Apr 21. Cell Metab. 2021. PMID: 33887198 Free PMC article.
-
Restoration of metabolic health by decreased consumption of branched-chain amino acids.J Physiol. 2018 Feb 15;596(4):623-645. doi: 10.1113/JP275075. Epub 2017 Dec 27. J Physiol. 2018. PMID: 29266268 Free PMC article.
-
Branched-chain amino acids, mitochondrial biogenesis, and healthspan: an evolutionary perspective.Aging (Albany NY). 2011 May;3(5):464-78. doi: 10.18632/aging.100322. Aging (Albany NY). 2011. PMID: 21566257 Free PMC article. Review.
Cited by
-
Gut aging: A wane from the normal to repercussion and gerotherapeutic strategies.Heliyon. 2024 Sep 12;10(19):e37883. doi: 10.1016/j.heliyon.2024.e37883. eCollection 2024 Oct 15. Heliyon. 2024. PMID: 39381110 Free PMC article. Review.
-
The role of branched-chain amino acids and their downstream metabolites in mediating insulin resistance.J Pharm Pharm Sci. 2024 Jun 28;27:13040. doi: 10.3389/jpps.2024.13040. eCollection 2024. J Pharm Pharm Sci. 2024. PMID: 39007094 Free PMC article. Review.
-
Branched-chain amino acids alleviate NAFLD via inhibiting de novo lipogenesis and activating fatty acid β-oxidation in laying hens.Redox Biol. 2024 Nov;77:103385. doi: 10.1016/j.redox.2024.103385. Epub 2024 Oct 3. Redox Biol. 2024. PMID: 39426289 Free PMC article.
-
Maternal α-casein deficiency extends the lifespan of offspring and programmes their body composition.Geroscience. 2024 Jul 12. doi: 10.1007/s11357-024-01273-2. Online ahead of print. Geroscience. 2024. PMID: 38992336
-
Hypoglycemic Ability of Sericin-Derived Oligopeptides (SDOs) from Bombyx mori Yellow Silk Cocoons and Their Physiological Effects on Streptozotocin (STZ)-Induced Diabetic Rats.Foods. 2024 Jul 11;13(14):2184. doi: 10.3390/foods13142184. Foods. 2024. PMID: 39063270 Free PMC article.
References
Publication types
MeSH terms
Substances
Grants and funding
- R56 AG056771/AG/NIA NIH HHS/United States
- F31 AG066311/AG/NIA NIH HHS/United States
- I01 BX004031/BX/BLRD VA/United States
- P50 DE026787/DE/NIDCR NIH HHS/United States
- P30 CA014520/CA/NCI NIH HHS/United States
- F31 AG082504/AG/NIA NIH HHS/United States
- R01 AG084156/AG/NIA NIH HHS/United States
- R01 AG062328/AG/NIA NIH HHS/United States
- F32 AG077916/AG/NIA NIH HHS/United States
- R01 AA029124/AA/NIAAA NIH HHS/United States
- T32 AG000213/AG/NIA NIH HHS/United States
- RF1 AG056771/AG/NIA NIH HHS/United States
- R01 AG056771/AG/NIA NIH HHS/United States
- F31 AG081115/AG/NIA NIH HHS/United States
- R01 DK133479/DK/NIDDK NIH HHS/United States
- R01 DK125859/DK/NIDDK NIH HHS/United States
- K12 HD101368/HD/NICHD NIH HHS/United States
- P50 CA278595/CA/NCI NIH HHS/United States
- P30 DK020579/DK/NIDDK NIH HHS/United States
- R01 DK131175/DK/NIDDK NIH HHS/United States
- K01 AG059899/AG/NIA NIH HHS/United States
- U01 AG081482/AG/NIA NIH HHS/United States
- U54 DK104310/DK/NIDDK NIH HHS/United States
LinkOut - more resources
Full Text Sources
Molecular Biology Databases

