. 2022 Jun 7;2(1):48.
doi: 10.1038/s43705-022-00129-0.

Repeated introduction of micropollutants enhances microbial succession despite stable degradation patterns

Affiliations

Repeated introduction of micropollutants enhances microbial succession despite stable degradation patterns

Dandan Izabel-Shen et al. ISME Commun. .

Abstract

The increasing-volume release of micropollutants into natural surface waters has raised great concern due to their environmental accumulation. Persisting micropollutants can impact multiple generations of organisms, but their microbially-mediated degradation and their influence on community assembly remain understudied. Here, freshwater microbes were treated with several common micropollutants, alone or in combination, and then transferred every 5 days to fresh medium containing the same micropollutants to mimic the repeated exposure of microbes. Metabarcoding of 16S rRNA gene makers was chosen to study the succession of bacterial assemblages following micropollutant exposure. The removal rates of micropollutants were then measured to assess degradation capacity of the associated communities. The degradation of micropollutants did not accelerate over time but altered the microbial community composition. Community assembly was dominated by stochastic processes during early exposure, via random community changes and emergence of seedbanks, and deterministic processes later in the exposure, via advanced community succession. Early exposure stages were characterized by the presence of sensitive microorganisms such as Actinobacteria and Planctomycetes, which were then replaced by more tolerant bacteria such as Bacteroidetes and Gammaproteobacteria. Our findings have important implication for ecological feedback between microbe-micropollutants under anthropogenic climate change scenarios.


Conflict of interest statement

The authors declare no competing interests.

Figures

Fig. 1
Fig. 1. Experimental setup.
In microcosm batch 1 (B1), 600 ml of the initial inoculum was added to bottles containing the micropollutants. Starting from the B1, 60 mL (10%) of the inoculum was pipetted from each of the replicates and transferred to fresh medium containing 540 mL of 0.22-μm-filtered water and freshly added micropollutants every 5 days. This procedure was carried out in the seven batches of microcosms from batch 1 (B1) through batch 7 (B7). Samples for bacterial community characterization and micropollutant removal were collected prior to the next inoculation. Treatments are color-coded: “Control” is (without micropollutant addition, gray), “BPA” (microcosms added with bisphenol A, red), “TCS” (microcosms added with triclosan, blue), “MI” (microcosms added with a mixture containing bisphenol A and triclosan, purple), “MII” (microcosms added with a mixture containing bisphenol A and triclosan, bisphenol S and triclocarban, yellow).
Fig. 2
Fig. 2. Percent removal of bisphenol A (BPA), triclosan (TCS), bisphenol S (BPS), and triclocarbon (TCC) in all microcosm batches for the single-micropollutant (BPA and TCA) treatments and in the mixed-micropollutant (MI and MII) treatments.
Removal was defined as the decrease in the concentration of the chemical relative to the total concentration within each batch of microcosms. “B1-B7” represent the number of microcosm batch that corresponds to every 5-day inoculation.
Fig. 3
Fig. 3. Difference in the bacterial communities in all microcosms batches as determined by non-metric multidimensional scaling (NMDS) ordination.
Different treatments are represented by different symbols, and microcosms batches are color-coded. Explanatory environmental variables fitting the ordination are shown with solid arrows. Treatment IDs are: ‘Initial’ containing the starting bacterial communities before the experimental implementation; “Con” microcosms containing no micropollutant additions and serve as the controls; “BPA” microcosms containing bisphenol A; “TCS” microcosms containing triclosan; “MI” microcosms containing a mixture of bisphenol A and triclosan; ‘MII’ microcosms containing a mixture of bisphenol A, triclosan, bisphenol-S and triclocarban. “B1–B7” represent the number of microcosm batch that corresponds to every 5-day inoculation. Explanatory values of the environmental variables to differences in the communities are presented in Supplementary Table S1.
Fig. 4
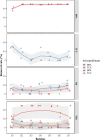
Fig. 4. Within-group and between-group community dissimilarity.
Bacterial community dissimilarity in the micropollutant treatments vs. the controls (i.e., “Con.”) over time (A) and the dynamic regularity within treatments (B). Significant differences in the Bray-Curtis dissimilarity for each pairwise comparison of the treatment and control (B1 microcosms vs. later microcosms in A were determined in a Wilcoxon test: ***, P < 0.001; **, 0.001 < P < 0.01; *, 0.01 < P < 0.05. The dissimilarity-overlap analysis within each treatment is shown in B; out of total 210 sample pairs, only the sample pairs that had median overlap above cutoff = 0.913 were shown in the plots. The gray lines indicate the linear regression with the slope (m), and the P value (the fraction of bootstrap realizations in which the slope was negative). Gray shaded areas indicate the 95% confidence intervals of the linear regression. Significance level was determined at P < 0.05. “B1–B7” represent the number of microcosm batch that corresponds to every 5-day inoculation.
Fig. 5
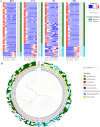
Fig. 5. Abundance distribution and phylogeny of ecological groups.
Changes in the relative abundances (rows of heatmap) of the OTUs assigned to the ecological categories tolerant and sensitive across the three growth phases (columns of heatmap) (A) and their phylogenetic distribution (B). In A, color gradients of heatmap represent the relative abundances of individual by column with warm colors (toward red) indicating high abundance and cold colors (toward blue) indicating low abundance within the sample. Column labels are batch IDs and the grouping of growth phases, and row labels the OTU IDs. Tolerant and sensitive OTUs were denoted in blue and green colors, respectively. In B, the innermost circle indicates the taxonomy (phylum/class) of the OTUs. The outer circles indicate the ecological group of OTUs in each treatment group (BPA, TCS, MI, MII from inside to outside, respectively).
Fig. 6
Fig. 6. Relative proportion of the ecological processes (homogeneous selection, variable selection dispersal limitation, and ecological drift) contributing to the communities assembled in the micropollutant treatments (BPA, TCS, MI or MII) vs. the controls (i.e., “Con.”).
The relative contribution was expressed as the portion of pairwise sample assembly that could be attributed to each ecological process. Each of the three phases (corresponding to the early, mid, and late stages of the press disturbance) was classified according to the similarity in the average 16S rRNA gene copy numbers as an indicator of community growth progression. Three growth phrases across microcosm batches were: phase 1 (B1–B2), phase 2 (B3–B4), and phase 3 (B5–B7), as shown in Fig. S4G.
Fig. 7
Fig. 7. Conceptual model of microbial community assembly processes following a press disturbance.
Considering the time continuity of the batch inoculation, the three phases of community growth progression (1, 2, and 3) also correspond to the early, mid, and late stages of the 35-day disturbance. This conceptual model illustrates when and how stochastic/deterministic processes contribute to the dynamics of microbial communities repeatedly exposed to micropollutants. Changes in community trajectory over time in the TCS or the MII treatment are indicated by the black line, MI treatment by the red line, and the BPA treatment by the purple line. Overall, stochastic and deterministic processes act in concert during community dynamics: stochastic assembly dominates at the early stage of a press disturbance/community development, and deterministic assembly at the later stage. Major community assembly mechanisms are delineated for each phase. Community succession accelerates at phase 2 such that multiple equilibria occur at phase 3. Community succession and multiple equilibria are not exclusive, but community turnover is high towards the end of the disturbance.

Similar articles

Cited by

References

    1. Schwarzenbach RP, Escher BI, Fenner K, Hofstetter TB, Johnson CA, Von Gunten U, et al. The challenge of micropollutants in aquatic systems. Science (80-) 2006;313:1072–7. doi: 10.1126/science.1127291. - DOI - PubMed
    1. Deblonde T, Cossu-Leguille C, Hartemann P. Emerging pollutants in wastewater: a review of the literature. Int J Hyg Environ Health. 2011;214:442–8. doi: 10.1016/j.ijheh.2011.08.002. - DOI - PubMed
    1. Wang M, Cernava T. Overhauling the assessment of agrochemical-driven interferences with microbial communities for improved global ecosystem integrity. Environ Sci Ecotechnol. 2020;4:100061. doi: 10.1016/j.ese.2020.100061. - DOI - PMC - PubMed
    1. Luo Y, Guo W, Ngo HH, Nghiem LD, Hai FI, Zhang J, et al. A review on the occurrence of micropollutants in the aquatic environment and their fate and removal during wastewater treatment. Sci Total Environ. 2014;473–474:619–41. doi: 10.1016/j.scitotenv.2013.12.065. - DOI - PubMed
    1. Wang Z, Zhang XH, Huang Y, Wang H. Comprehensive evaluation of pharmaceuticals and personal care products (PPCPs) in typical highly urbanized regions across China. Environ Pollut. 2015;204:223–32. doi: 10.1016/j.envpol.2015.04.021. - DOI - PubMed