. 2023 Oct 5;14(1):6214.
doi: 10.1038/s41467-023-41999-9.

Claudin-23 reshapes epithelial tight junction architecture to regulate barrier function

Affiliations

Claudin-23 reshapes epithelial tight junction architecture to regulate barrier function

Arturo Raya-Sandino et al. Nat Commun. .

Abstract

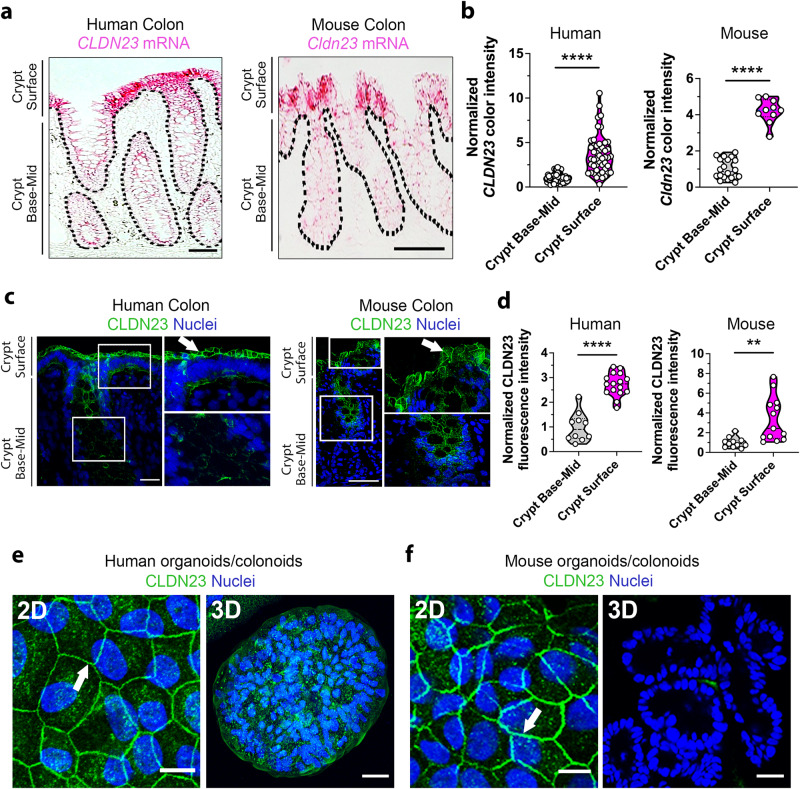
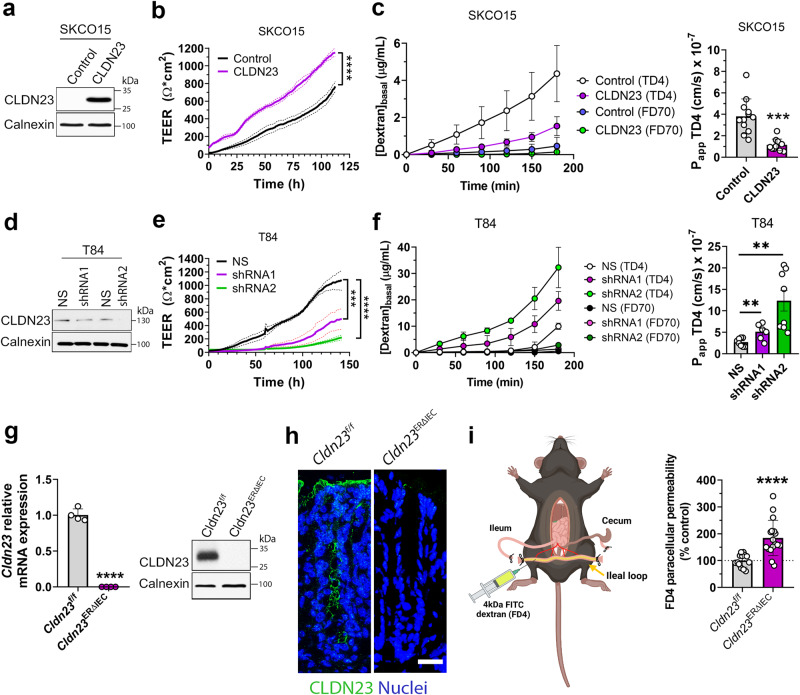
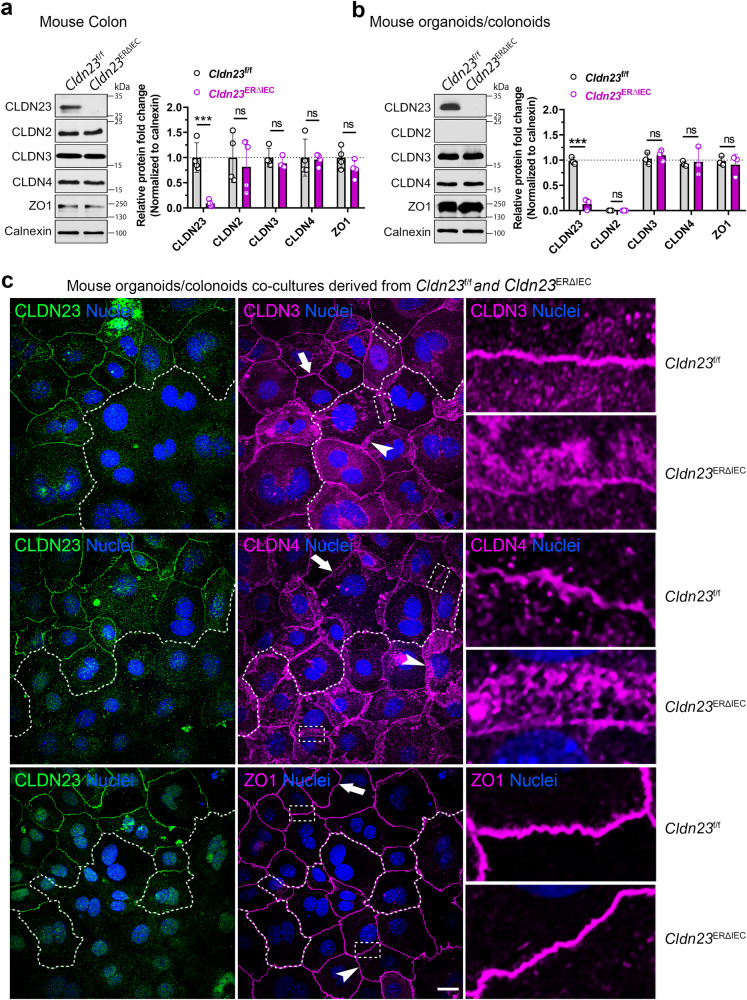
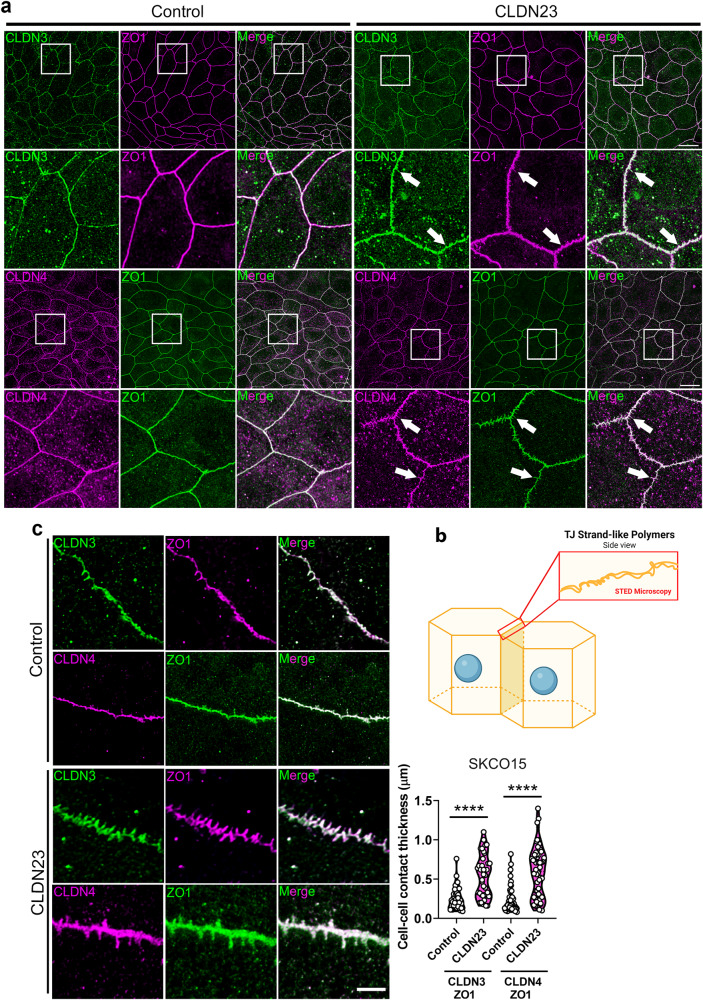
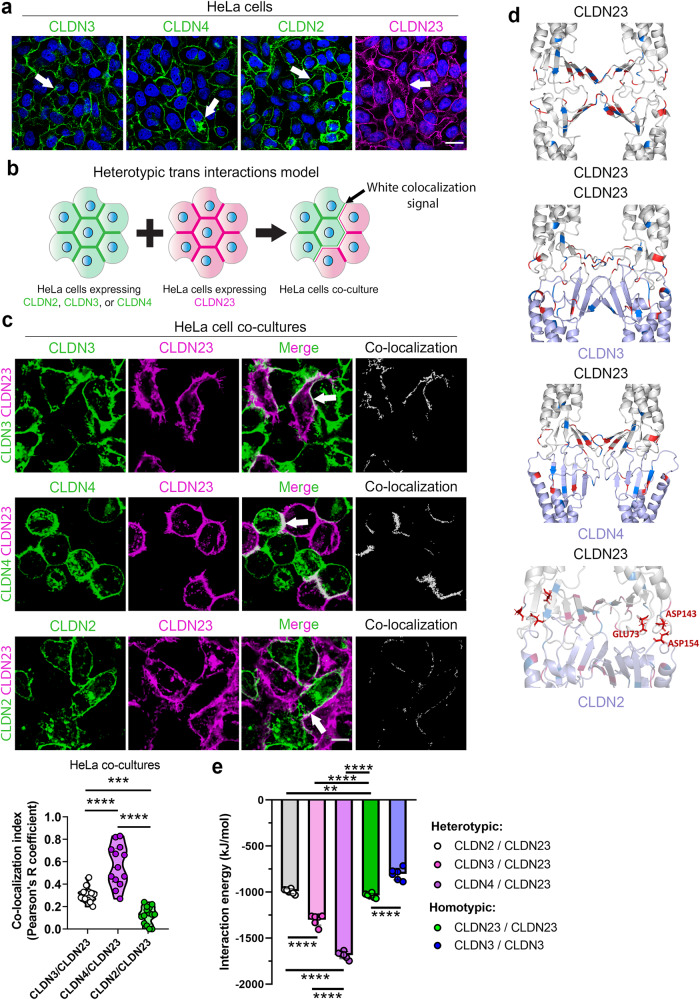
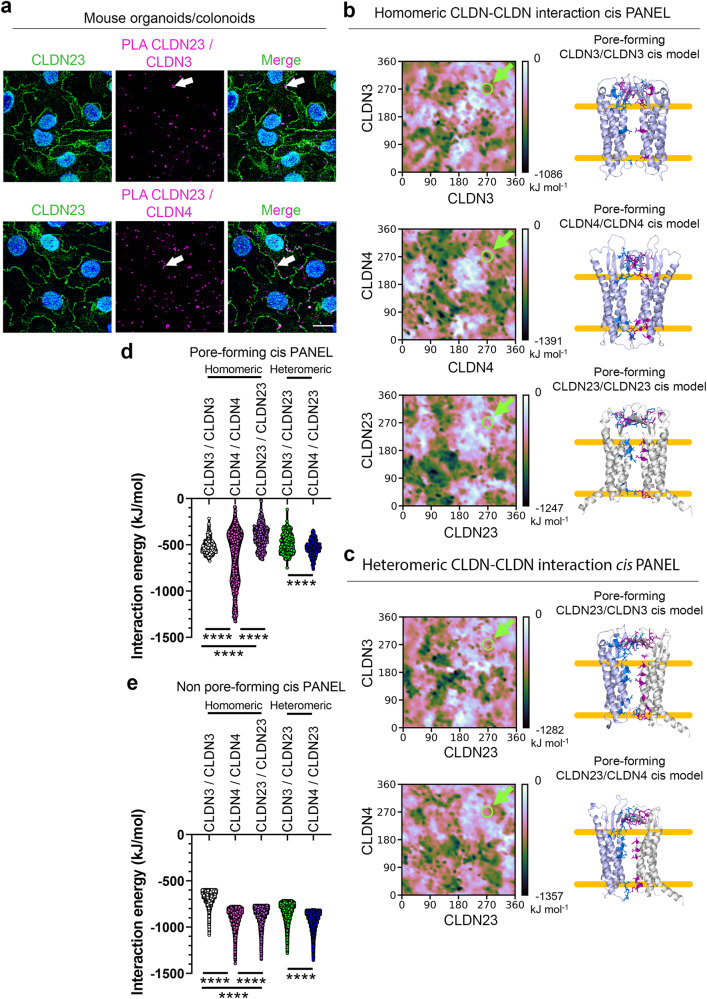
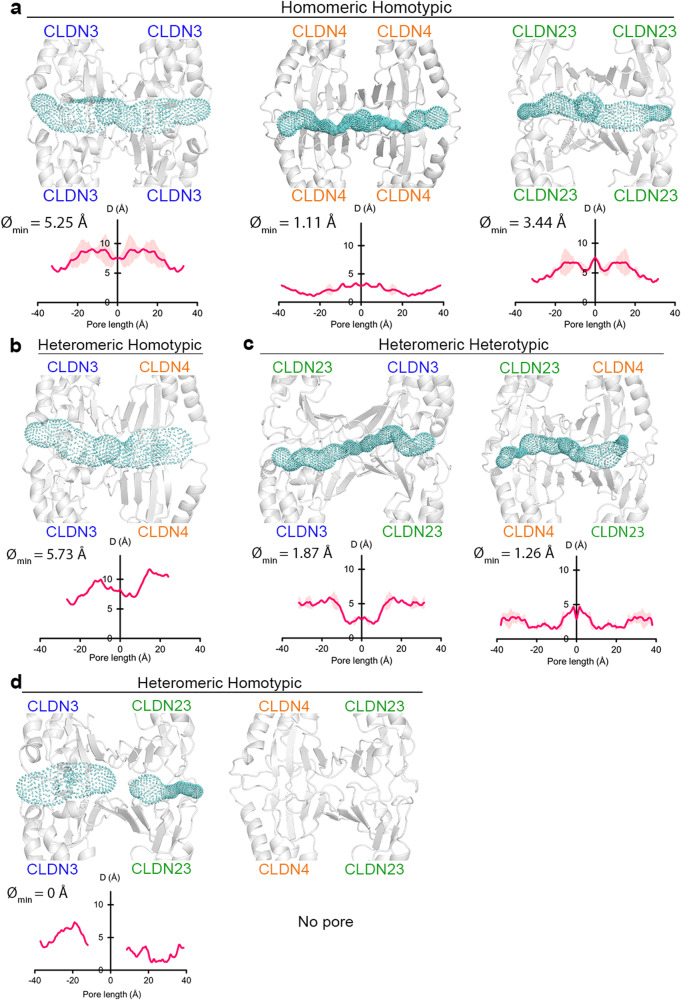
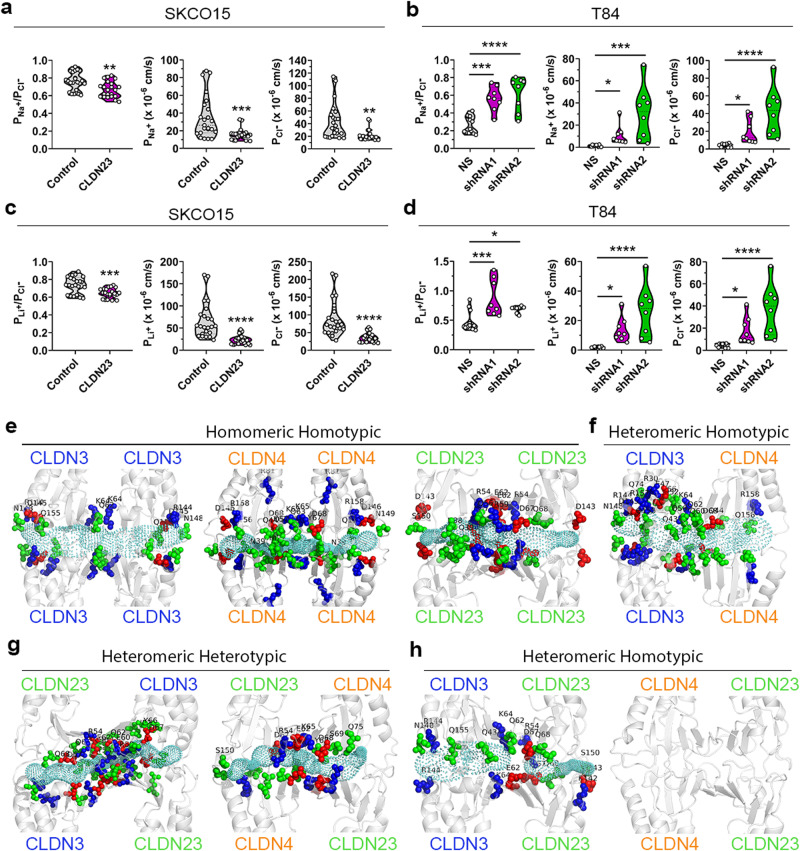
Claudin family tight junction proteins form charge- and size-selective paracellular channels that regulate epithelial barrier function. In the gastrointestinal tract, barrier heterogeneity is attributed to differential claudin expression. Here, we show that claudin-23 (CLDN23) is enriched in luminal intestinal epithelial cells where it strengthens the epithelial barrier. Complementary approaches reveal that CLDN23 regulates paracellular ion and macromolecule permeability by associating with CLDN3 and CLDN4 and regulating their distribution in tight junctions. Computational modeling suggests that CLDN23 forms heteromeric and heterotypic complexes with CLDN3 and CLDN4 that have unique pore architecture and overall net charge. These computational simulation analyses further suggest that pore properties are interaction-dependent, since differently organized complexes with the same claudin stoichiometry form pores with unique architecture. Our findings provide insight into tight junction organization and propose a model whereby different claudins combine to form multiple distinct complexes that modify epithelial barrier function by altering tight junction structure.


Conflict of interest statement

The authors declare no competing interests.

Figures

Fig. 1
Fig. 1. CLDN23 is differentially expressed in IECs along the crypt-luminal axis.
a CLDN23 mRNA expression (pink) detected by RNAscope in situ hybridization in human (left) and C57BL/6 WT murine (right) colonic epithelial cells. Scale bar: 50 µm. b Histograms represent the color intensity of CLDN23 mRNA staining at the base-mid and surface of individual colonic crypts in human (left) or murine (right) tissues. Each dot represents an individual crypt. Data are mean ± SD of 9 images from five biopsies from healthy human (64 crypts total) or WT murine colons (20 crypts total). Values were normalized to the intensity of the base-mid section of the crypt. ****p ≤ 0.0001; two-tailed Student’s t test. c Confocal images showing CLDN23 protein (green) and nuclei (DAPI/blue) in healthy human (left) and C57BL/6 WT murine (right) colonic epithelium. Scale bar: 50 µm. d Histograms represent normalized fluorescence intensity for CLDN23 at the base-mid and surface of individual colonic crypts in human (left) or mouse (right) tissues. Each dot represents an individual crypt. Data are mean ± SD of 9 images obtained from three healthy human colonic biopsies (16 crypts total) or three WT murine colonic tissues (13 crypts total). Values were normalized to the fluorescence of the base-mid section of the crypt. ****p ≤ 0.0001, **p = 0.0025; two-tailed Student’s t test. Representative confocal images showing CLDN23 (green) and nuclei (DAPI/blue) in differentiated (2D) and undifferentiated (3D) colonoids derived from human (e) and C57BL/6 mouse (f) crypts. Scale bars: 10 µm (left) and 50 µm (right). CLDN23 expression in 3D colonoids with stem cell-like phenotypes (e, f, right), and at cell-cell contacts between differentiated cells in 2D monolayers (e, f, left/arrow).
Fig. 2
Fig. 2. CLDN23 regulates intestinal epithelial barrier function.
a Immunoblotting for CLDN23 and Calnexin (loading control) in SKCO15 cells with ectopic expression of full-length human CLDN23 protein versus a 10 amino acid myc-tag protein (Control). b Representative graph showing TEER of SKCO15 cells overexpressing CLDN23 vs control monolayers was measured continuously for 5 days. Data are mean ± SD and represent three individual experiments, each with six technical replicates. ****p ≤ 0.0001; two-way ANOVA with Tukey’s posttest. c Left, paracellular flux rate of 4 kDa TRITC-dextran (TD4) and 70 kDa FITC-dextran (FD70) across monolayers overexpressing CLDN23 and control SKCO15 cells ([Dextran]basal). Right, rate of change of TD4 flux was utilized to calculate the apparent permeability (Papp) of each individual sample. Data are mean ± SD and are representative of three individual experiments, each with six technical replicates. ***p = 0.001; two-tailed Student’s t test with Welch’s correction. d CLDN23 expression in T84 IECs transduced with two shRNAs against CLDN23 were compared with scramble non-silencing shRNA control cells (NS). Immunoblot images are representative of three independent experiments. e Representative graph showing TEER of T84 CLDN23 KD (shRNA1 and 2) and NS monolayers was measured continuously for 5 days. Data are mean ± SD and represent two independent experiments, each with four technical replicates per condition. ***p ≤ 0.001; ****p ≤ 0.0001; two-way ANOVA with Tukey’s posttest. f Paracellular flux rate of 4 kDa TRITC-dextran (TD4) and 70 kDa FITC-dextran (FD70) across monolayers of T84 CLDN23 KD (shRNA1 and 2) and NS control monolayers ([Dextran]basal). Rate of change of TD4 flux was utilized to calculate the apparent permeability (Papp) of each individual sample. Data are mean ± SD and represent two individual experiments. Each point represents an individual cell monolayer (n = 8 (NS), 6 (shRNA1), and 8 (shRNA2)). **p = 0.0068 (NS vs shRNA1), **p = 0.0015 (NS vs shRNA2); two-tailed Student’s t test. g Left, Cldn23 mRNA expression in Cldn23ERΔIEC or Cldn23f/f IECs. Points represent values from individual mice. Data are mean ± SD and represent two independent experiments, 4 mice per group. ****p ≤ 0001; two-tailed Student’s t test. Right, immunoblotting for CLDN23 and Calnexin (loading control) in colonic IECs from Cldn23ERΔIEC and Cldn23f/f mice. h Confocal images of colonic tissue sections of Cldn23ERΔIEC and Cldn23f/f mice stained for CLDN23 (green) and nuclei (DAPI/blue). Scale bar: 50μm. i Left, schematic of the intestinal loop model used to assess intestinal epithelial permeability to 4 kDa FITC dextran in vivo in Cldn23ERΔIEC and Cldn23f/f mice. Right, CLDN23 depletion resulted in increased intestinal permeability to 4 kDa FITC dextran in vivo. Histograms represent the mean ± SD from three independent experiments. Each point represents an individual mouse (n = 14 (Cldn23f/f) and 16 (Cldn23ERΔIEC)). ****p < 0.0001; two-tailed Student’s t test with Welch’s correction.
Fig. 3
Fig. 3. CLDN23 stabilizes CLDN3 and CLDN4 at the TJ plasma membrane without affecting protein expression levels.
Left, representative immunoblots for CLDN23, CLDN2, CLDN3, CLDN4, ZO1 and Calnexin (loading control) in a whole colon and b murine colonoids derived from tamoxifen-treated Cldn23ERΔIEC and Cldn23f/f mice. Right, histograms represent the mean ± SD from three independent experiments. Each point represents an individual mouse (total of 4 per group). ***p < 0.001; ns, not significant; a, b two-tailed Student’s t test. c Representative confocal images of murine colonoid co-cultures derived from tamoxifen-treated Cldn23ERΔIEC and Cldn23f/f mice and stained with anti-CLDN23 (green), and either anti-CLDN3 (magenta), anti-CLDN4 (magenta), or anti-ZO1 (magenta) antibodies and DAPI (blue) as a nuclear counterstain. Dotted line indicates the border between Cldn23f/f and Cldn23ERΔIEC colonoids and dotted rectangles mark zoomed-in areas shown on the right. Scale bar: 20 μm.
Fig. 4
Fig. 4. CLDN23 influences the TJ morphology of intestinal epithelial cells.
a Immunofluorescence staining and representative deconvoluted confocal images of control SKCO15 and CLDN23 overexpressing SKCO15 monolayers stained with anti-ZO1 (magenta & green) and either anti-CLDN3 (green), or anti-CLDN4 (magenta) antibodies. Scale bar: 20μm. Arrows point to TJ spike formation along cell-cell contacts. b Schematic representing the visualization of TJ strand formation employing super-resolution STED microscopy. Created with BioRender.com. c Left, representative super-resolution STED microscopy images in control SKCO15 IECs and CLDN23 overexpressing SKCO15 IEC monolayers stained with anti-ZO1 (magenta or green) and either anti-CLDN3 (green), or anti-CLDN4 (magenta) antibodies. Scale bar: 20 μm. Right, histograms showing cell–cell contact thickness. Results show the mean ± SD of two independent experiments. A total of 33 (CLDN3/ZO1) and 50 (CLDN4/ZO1) cell-cell contacts were analyzed for control cells, while 38 (CLDN3/ZO1) and 55 (CLDN4/ZO1) were analyzed for CLDN23 overexpressing cells. ****p < 0.0001; statistical analysis was done with two-tailed Student’s t test.
Fig. 5
Fig. 5. CLDN23 interacts in trans with CLDN3 and CLDN4, but not CLDN2.
a Immunofluorescence staining and confocal images of HeLa cell monolayers singly expressing CLDN3 (green), CLDN4 (green), CLDN2 (green) or CLDN23 (magenta). Arrows point to homotypic trans interactions at cell-cell contacts. Nuclei were stained with DAPI (blue). Scale bar: 20 µm. b Schematic depicting HeLa cell co-culture model used to analyze heterotypic trans interactions between CLDN23 and either CLDN2, CLDN3, or CLDN4. c Top, immunofluorescence staining and confocal images of HeLa cells expressing either CLDN3 (green), CLDN4 (green), or CLDN2 (green) co-cultured with HeLa cells expressing CLDN23 (magenta). Heterotypic trans interactions were investigated by analyzing the colocalization index from the white signal (arrow) at cell-cell contacts. Scale bar: 20 µm. Bottom, bar graph represents the colocalization analysis, generated by Pearson’s correlation coefficients, between CLDN23 and either CLDN3 (R = 0.31), CLDN4 (R = 0.57), and CLDN2 (R = 0.12) at cell–cell contacts. Data are mean ± SD of three independent experiments. A total of 13 (CLDN3/CLDN23), 14 (CLDN4/CLDN23), and 14 (CLDN2/CLDN23), images per condition were analyzed. ***p ≤ 0.001, ****p ≤ 0.0001; two-tailed Student’s t test. d Claudin tetramer structures showing variable trans interfaces formed by CLDN23/CLDN23, CLDN23/CLDN3, CLDN23/CLDN4, CLDN23/CLDN2 interactions. The secondary structure of CLDNs is shown in ribbon representation with CLDN23 in gray and other CLDNs in light purple. Trans interaction structure shows proximal placement of negatively charged amino acids GLU73 and ASP143 from CLDN23 with ASP154 from CLDN2 are colored in red. e Bar plot showing the total interaction energy between trans interfaces formed by cis dimers of CLDN23 with cis dimers of CLDN2, CLDN3, CLDN4, and CLDN23. Results show the mean ± SD of five independent experiments for each tetramer. Statistical analysis was done with one-way ANOVA with Tukey’s posttest. **p ≤ 0.01; ****p ≤ 0.0001.
Fig. 6
Fig. 6. CLDN23 interacts with CLDN3 and CLDN4 in cis at the cell membrane.
a Left panels, representative confocal images of mouse colonoid monolayers expressing CLDN23 at the plasma membrane. Nuclei stained with DAPI (blue) Middle panels show positive PLA signal (magenta dots) at the cell-cell contact (arrow) between CLDN23 with either CLDN3 or CLDN4 in mouse colonoids. Right panels, show merged images. Scale bars: 20 μm. b, c Left panel, interaction energy landscapes obtained from PANEL method for b homomeric and c heteromeric interactions of CLDN3 and CLDN4 with CLDN23 in which the known pore-forming rotational orientation was indicated at 270° ± 10 for each CLDN (green arrow). Right panel, representative in silico ribbon diagrams of pore-forming homomeric (b) and heteromeric (c) interactions of CLDN3 (light purple), CLDN4 (light purple), and CLDN23 (gray). d Bar plot showing a comparison of energy values of pore-forming homodimers and heterodimers of CLDN3, CLDN4, and CLDN23. Results show the mean ± SD of 400 data points corresponding to the known pore-forming rotational orientation on the landscape. ****p ≤ 0.0001; one-way ANOVA with Tukey’s posttest. e Bar plot showing energy values of non-pore-forming rotational orientations. Results show the mean ± SD of 12,960 data points. ****p ≤ 0.0001; one-way ANOVA with Tukey’s posttest.
Fig. 7
Fig. 7. CLDN23 interaction with CLDN3 and CLDN4 may restrict and block formation of paracellular pores.
CAVER analysis of CLDN tetrameric channels in all-atom resolution. The secondary structure of CLDNs is shown in ribbon representation. The pore profile (cyan) represents the available pore for ion/water transport across the tetrameric structure. Pore diameter along the length of the pore is shown in the graph below each tetramer. a Homomeric homotypic structures of CLDN3 (blue), CLDN4 (orange), and CLDN23 (green) as well as b heteromeric homotypic CLDN3 and CLDN4. c Heteromeric heterotypic and d heteromeric homotypic trans interaction structures formed by heterodimers of CLDN3 and CLDN4 with CLDN23.
Fig. 8
Fig. 8. CLDN23 may decrease the paracellular permeability of ions of either charge by influencing the charge selectivity of CLDN3 and CLDN4 pores.
a, b Charge selectivity (ratio of permeability of PNa+ to Pcl; PNa+/Pcl) and individual PNa+ and Pcl in a control and CLDN23 overexpressing SKCO15 cells and in b T84 IECs transduced with two shRNAs against CLDN23 compared with scramble non-silencing shRNA control cells. Data are mean ± SD and represent a four and three b independent experiments. Each dot represents an individual cell monolayer (n = 22 (a) and 11 (b)). *p = 0.0198 (PNa+ of T84 NS vs shRNA1), *p = 0.0173 (PCl of T84 NS vs shRNA1), **p = 0.0031 (PNa+/Pcl of SKCO15), **p = 0.0010 (Pcl of SKCO15) ***p = 0.005 (PNa+ of SKCO15), ***p = 0.0001 (PNa+/Pcl of T84), ***p = 0.0003 (PNa+ of T84 NS vs shRNA2), ****p ≤ 0.0001 (PCl of T84 NS vs shRNA2); a two-tailed Student’s t test and b one-way ANOVA with Tukey’s posttest (PNa+/Pcl of T84) and two-tailed Student’s t test (PNa+ and Pcl of T84). c, d Charge selectivity (ratio of permeability of PLi+ to Pcl; PLi+/Pcl) and individual PLi+ and Pcl in c control and CLDN23 overexpressing SKCO15 cells and in d T84 IECs transduced with two shRNAs against CLDN23 compared with scramble non-silencing shRNA control cells. Data are mean ± SD and represent c four and three d individual experiments. Each dot represents an individual cell monolayer (n = 22 (c) and 11 (d)). *p = 0.0454 (PLi+/Pcl of T84 NS vs shRNA2), *p = 0.0257 (PLi+ of T84 NS vs shRNA1), *p = 0.0211 (PCl of T84 NS vs shRNA1), ***p = 0.0002 (PLi+/Pcl of SKCO15), ***p = 0.0002 (PLi+/Pcl of T84 NS vs shRNA1), ****p ≤ 0.0001 (PLi+ of SKCO15, Pcl of SKCO15, PLi+ of T84 NS vs shRNA2, and PCl of T84 NS vs shRNA2); c two-tailed Student’s t test and d one-way ANOVA with Tukey’s posttest. e Homomeric homotypic structures of CLDN3 (blue), CLDN4 (orange), and CLDN23 (green) as well as f heteromeric homotypic CLDN3 and CLDN4. g Heteromeric heterotypic and h heteromeric homotypic trans interaction structures formed by heterodimers of CLDN3 and CLDN4 with CLDN23. The secondary structure of CLDNs is shown in ribbon representation. The pore profile (cyan) represents the available pore for ion/water transport across the tetrameric structure. The positively charged residues are shown in blue, negatively charged residues in red and polar residues (ASN, GLN, SER, THR, TYR) in green.

Similar articles

Cited by

References

    1. Diamond JM. Twenty-first Bowditch lecture. The epithelial junction: bridge, gate, and fence. Physiologist. 1977;20:10–18. - PubMed
    1. Gumbiner B. Structure, biochemistry, and assembly of epithelial tight junctions. Am. J. Physiol. 1987;253:C749–C758. - PubMed
    1. Itoh M, Bissell MJ. The organization of tight junctions in epithelia: implications for mammary gland biology and breast tumorigenesis. J. Mammary Gland Biol. Neoplasia. 2003;8:449–462. - PMC - PubMed
    1. Furuse M. Molecular basis of the core structure of tight junctions. Cold Spring Harb. Perspect. Biol. 2010;2:a002907. - PMC - PubMed
    1. Gunzel D, Yu AS. Claudins and the modulation of tight junction permeability. Physiol. Rev. 2013;93:525–569. - PMC - PubMed

Publication types

LinkOut - more resources