. 2023 Sep 18;21(9):e3002305.
doi: 10.1371/journal.pbio.3002305. eCollection 2023 Sep.

SEC14-like condensate phase transitions at plasma membranes regulate root growth in Arabidopsis

Affiliations

SEC14-like condensate phase transitions at plasma membranes regulate root growth in Arabidopsis

Chen Liu et al. PLoS Biol. .

Abstract

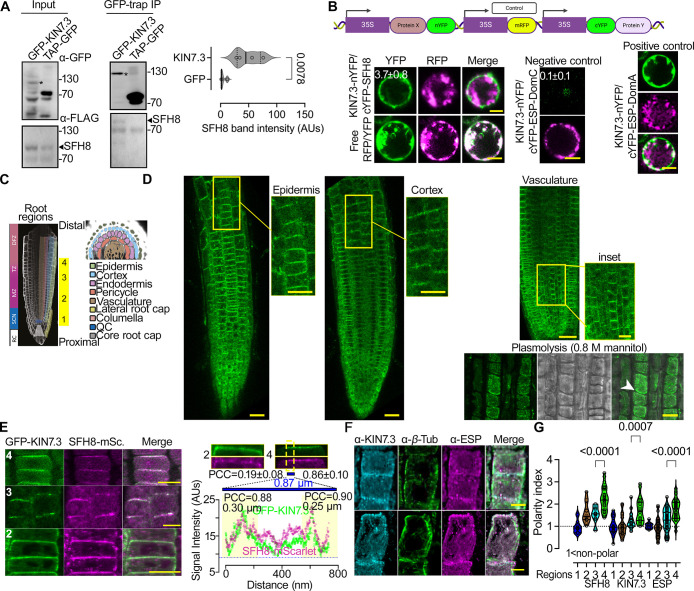
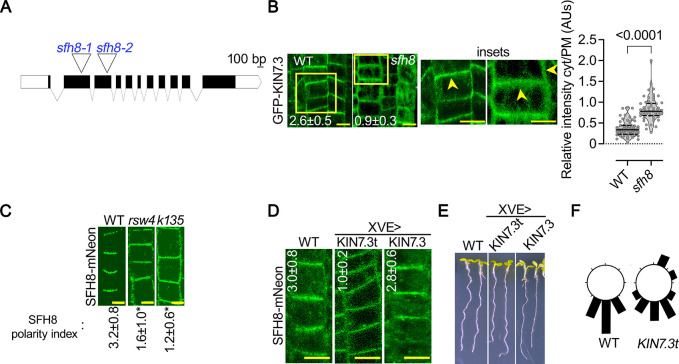
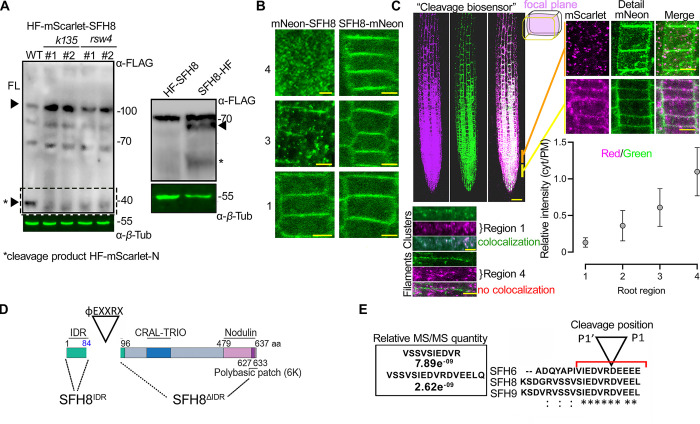
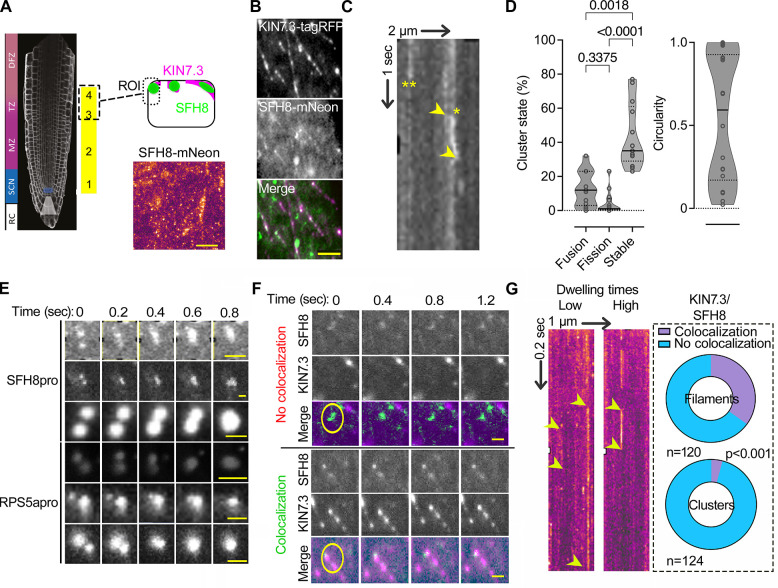
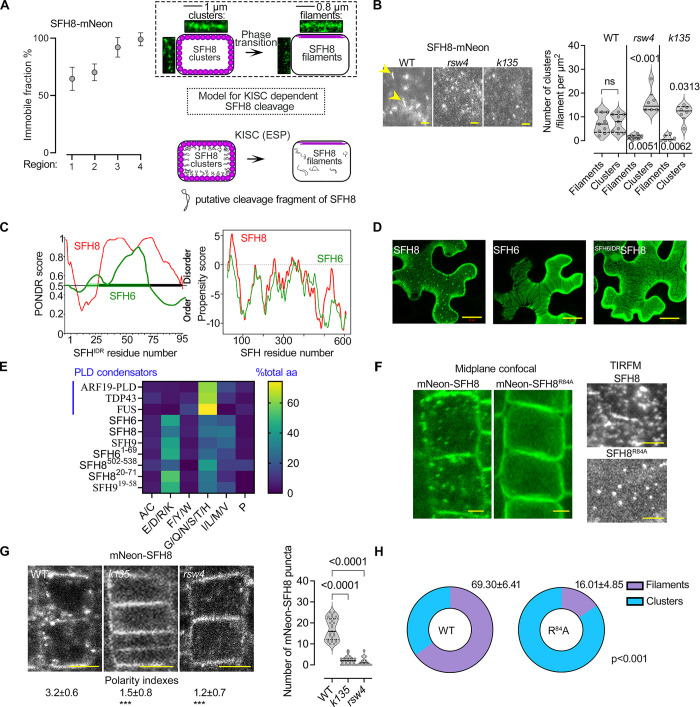
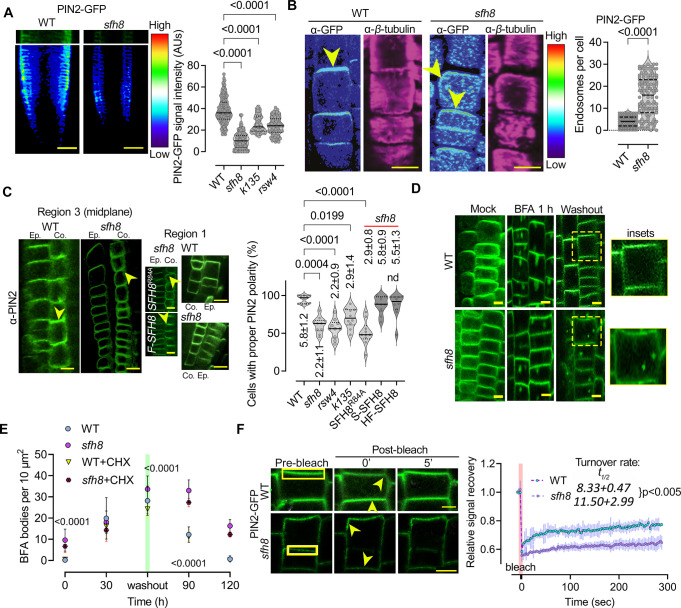
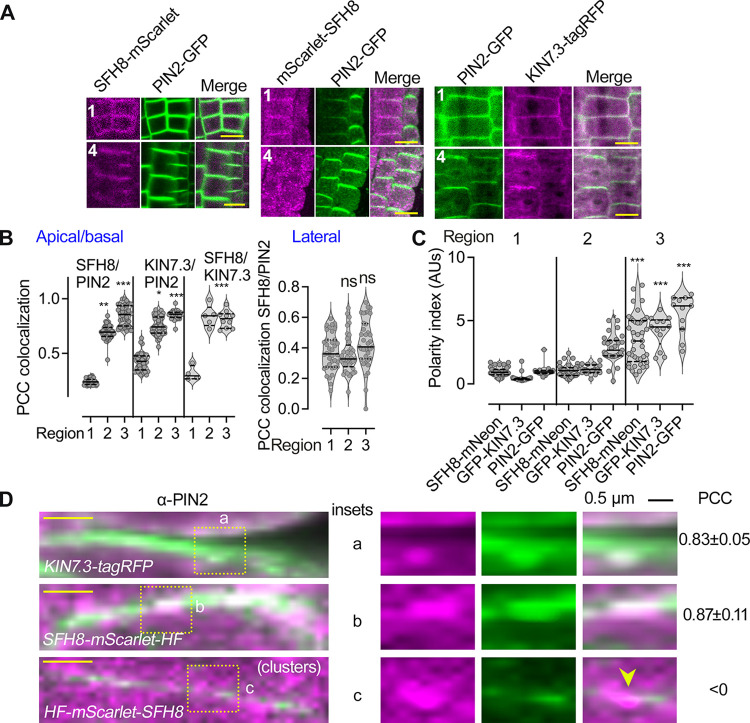
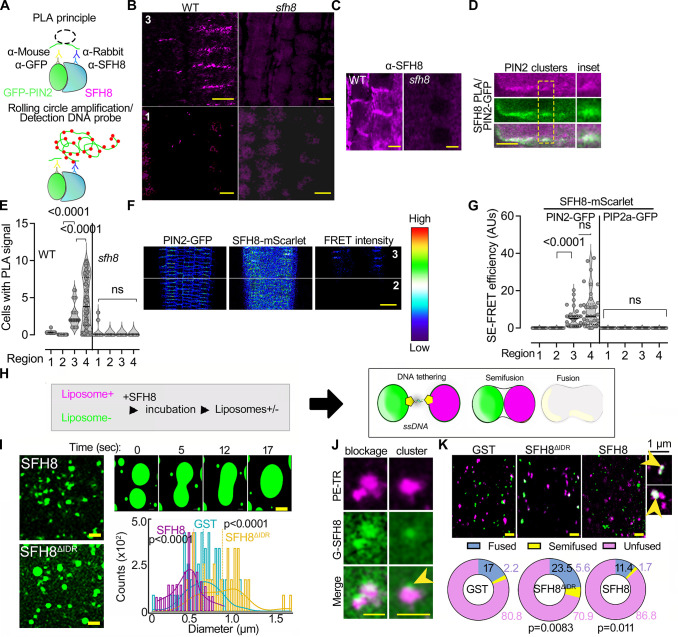
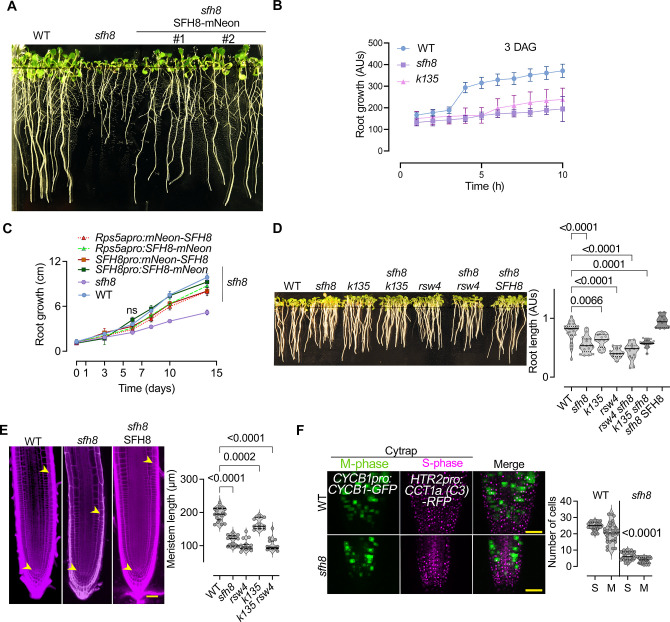
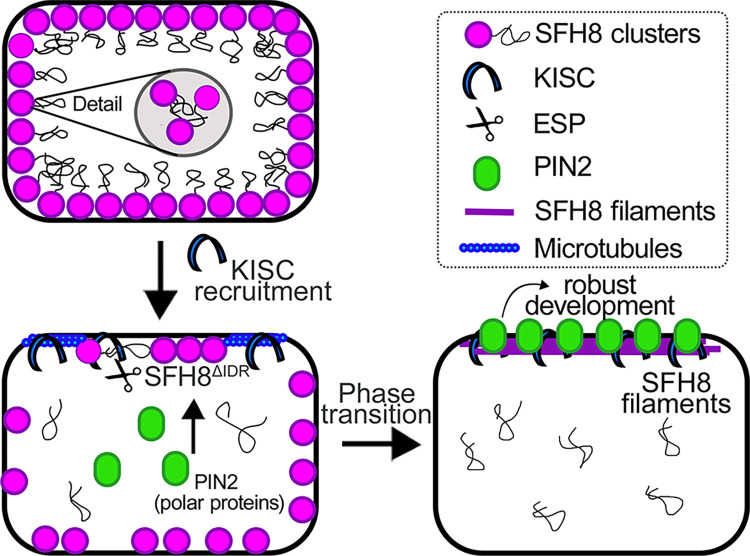
Protein function can be modulated by phase transitions in their material properties, which can range from liquid- to solid-like; yet, the mechanisms that drive these transitions and whether they are important for physiology are still unknown. In the model plant Arabidopsis, we show that developmental robustness is reinforced by phase transitions of the plasma membrane-bound lipid-binding protein SEC14-like. Using imaging, genetics, and in vitro reconstitution experiments, we show that SEC14-like undergoes liquid-like phase separation in the root stem cells. Outside the stem cell niche, SEC14-like associates with the caspase-like protease separase and conserved microtubule motors at unique polar plasma membrane interfaces. In these interfaces, SEC14-like undergoes processing by separase, which promotes its liquid-to-solid transition. This transition is important for root development, as lines expressing an uncleavable SEC14-like variant or mutants of separase and associated microtubule motors show similar developmental phenotypes. Furthermore, the processed and solidified but not the liquid form of SEC14-like interacts with and regulates the polarity of the auxin efflux carrier PINFORMED2. This work demonstrates that robust development can involve liquid-to-solid transitions mediated by proteolysis at unique plasma membrane interfaces.


Conflict of interest statement

The authors have declared that no competing interests exist.

Figures

Fig 1
Fig 1. KISC associates with the lipid-transfer protein SFH8 at the PM.
(A) Co-immunoprecipitation and immunoblots from Arabidopsis seedlings coexpressing KIN7.3pro:KIN7.3-GFP with either RPS5apro:3xFLAG-SFH8 or 2x35Spro:TAP-GFP (5 DAG). Right: quantification of the interaction (SFH8 signal intensity detected by α-FLAG that was pulled down by GFP or GFP-KIN7.3; N = 4 pooled experiments, n = 1 assay; p-value was calculated by a 2-tailed t test). Asterisks in the immunoblots denote the full-length GFP-KIN7.3, which is sensitive to proteolytic degradation in the input sample. (B) Ratiometric transient BiFC assays in root protoplasts (the cartoon on the top shows the construct used). Controls: KIN7.3-nYFP coexpressed with ESP truncations known as DomA (1–791; positive control) or DomC (1,622–2,178; negative control) as defined previously [18]. The mean YFP/RFP signal ratios ± SD are indicated on images (N = 2 pooled experiments, n = 15 cells). Scale bars, 6 μm. (C) Root model showing the “4 root regions” examined herein: SCN (1); MZ (2); TZ (3); DFZ (4). (D) Tissue-specific expression and subcellular localization of SFH8-mNeon in roots (SFH8pro:SFH8-mNeon expressing lines; 5 DAG, at the indicated tissues). The plasmolysis experiment confirms SFH8 signal exclusion from the cell wall (note the white arrowhead; region 2). The experiment was replicated 5 times. Scale bars, 20 μm (5 μm in the insets or plasmolysis experiment). (E) Colocalization of GFP-KIN7.3 (KIN7.3pro) and SFH8-mScarlet (SFH8pro; epidermis regions 1–4). Scale bars, 10 μm. Right top: high-resolution signal of KIN7.3/SFH8 at the PM (epidermis regions 2, 3, and 4). The overall PCC values for regions 2 and 4 are shown (ROIs: whole image). For region 4, a plot profile of signal intensity across a straight line of 0.87 μm and 2 peak PCC regions (0.30 and 0.25 μm) are shown. (Data are means ± SD, N = 3 pooled experiments, n = 3 adjacent cells per experiment.) (F) Example of α-ESP/α-KIN7.3 colocalization and polarization (counterstained with α-β-Tubulin; epidermis, region 3). Scale bars, 5 μm. (G) SFH8, KIN7.3, and ESP polarity index in regions 1–4 (values >1 denote polarization; polarity index calculation is described in S1A Fig; data are means ± SD, N = 5 pooled experiments, n ≥ 12 cells per experiment; p-values were calculated by 1-sided Dunnett). Raw data can be found in the Supporting information section (S1 Data and S1 Raw Images). AUs, arbitrary units; BiFC, bimolecular fluorescence complementation; Co., cortex; DAG, day after germination; DFZ, differentiation zone; Ep., epidermis; ESP, EXTRA SPINDLE POLES; KISC, kinesin-separase complex; mSc., mScarlet; MZ, meristematic zone; PCC, Pearson correlation coefficient; PM, plasma membrane; QC, quiescent center; RC, root columella; ROI, region of interest; SCN, stem cell niche; SFH8, SEC FOURTEEN-HOMOLOG8; TAP, tandem affinity purification tag; Tub., tubulin; TZ, transition zone.
Fig 2
Fig 2. SFH8 recruits KISC at the PM and KISC regulates SFH8 polarity.
(A) T-DNA insertion sites for sfh8–1 and sft8–2 (second and third exons, respectively). (B) GFP-KIN7.3 PM localization in WT or sfh8 (5 DAG, epidermis region 3). The polarity index of KIN7.3 is also shown on the images (data are means ± SD, N = 3 pooled experiments from region 3, n = 6–8 cells per experiment; differences were significant at p < 0.0001 and calculated by a 1-sided Dunnett). Arrowheads in the insets show apical or lateral localization of KIN7.3. Scale bars, 5 μm. Right: quantification of cytoplasmic to PM signal (data are means ± SD, N = 3 pooled experiments, n = 18–24 cells per experiment; “*”: p < 0.0001 to WT, calculated by a 2-tailed t test). (C) SFH8-mNeon (SFH8pro) localization in WT, rsw4, and k135 (5 DAG, region 3). Images are representative of an experiment replicated >10 times for polarity. Numbers in micrographs are the polarity indexes of SFH8 (data are means ± SD, N = 3 pooled experiments from region 3, n = 9–17 cells per experiment; “*”: p < 0.0001 to WT, calculated by a 1-sided Dunnett). Scale bars, 5 μm. (D) SFH8-mNeon (SFH8pro) polarity loss in lines overexpressing transiently KIN7.3 full length or KIN7.3 tail (“t”; KIN7.3pro˃XVEpro module induced for 24–36 h with 2 μM estradiol; epidermis region 3). Numbers in micrographs are the polarity indexes of SFH8 (Data are means ± SD, N = 3 pooled experiments from region 3; n = 410; “*”: p < 0.0001 to WT, calculated by a 1-sided Dunnett). Scale bars, 10 μm. (E) Perturbed gravitropism and growth of lines overexpressing transiently full-length or tail KIN7.3 (“t”; KIN7.3pro˃XVEpro module induced for 24–36 h with 2 μM estradiol). Scale bars, 8 μm. (F) Circular plots showing the quantification of perturbed gravitropism in KIN7.3pro˃XVEpro˃KIN7.3t expressing roots (data are means ± SD, N = 3 pooled experiments, n = 8–10 roots per experiment). Raw data can be found in the Supporting information section (S1 Data). DAG, day after germination; KISC, kinesin-separase complex; PM, plasma membrane; rsw4, radially swollen 4; SFH8, SEC FOURTEEN-HOMOLOG8; WT, wild type.
Fig 3
Fig 3. KISC trimming of SFH8 promotes the cluster-to-filamentous transition.
(A) Detection of SFH8 N terminal fragment from lines expressing HF-mScarlet-SFH8 (RPS5apro) (black arrowhead with an asterisk at approximately 40 kDa) in WT, k135, or rsw4 backgrounds (24 h at the restrictive temperature 28°C to induce rsw4 mutation [28]; 2 lines were used). Right: immunoblot showing the remaining C terminal SFH8 fragment (black arrowhead; asterisk shows an additional truncated product of low abundance) in WT lines expressing HF-SFH8 (RPS5apro). The experiment was replicated 4 times. (B) Localization of SFH8 N- or C-terminally tagged with mNeon (SFH8pro; 7 DAG, epidermis of regions 1, 3, and 4). Note the formation of puncta in the cytoplasm of lines expressing mNeon-SFH8 at region 3 onwards and the reduction of the corresponding PM signal for mNeon-SFH8. The experiment was replicated 5 times. Scale bars, 3 μm. Images are representative of an experiment replicated >10 times. (C) Localization of an SFH8 cleavage biosensor (RPS5apro:HF-mScarlet-SFH8-mNeon). Scale bar, 50 μm. Upper right: details of regions 1 and 3 (mid-plane epidermis, scale bars, 4 μm), and relative signal intensity of cytoplasmic versus PM signal (chart). Data are means ± SD (N = 10 pooled experiments, n = 4 cells per experiment). Lower panel (left): super-resolution imaging of cluster-to-filament conversion (epidermis regions 2 and 4). Note the absence of mScarlet signal from filaments (denoted as “no colocalization”). The experiment was replicated 5 times. Scale bars, 0.8 μm. (D) SFH8 protein architecture (IDR corresponding to aa 1–96; CRAL-TRIO: active site for SEC14 proteins). The φEXXR cleavage motif for ESP is also shown. (E) SFH8 IDR peptides identified in pRPS5a:SFH8-mScarlet-HF pull-down experiments coupled with LC–MS/MS. Right: the cleavage motif of ESP on SFH proteins, φEXXR is conserved (presented here for 3 SFH protein paralogs, SFH6/8/9). P1’-P1 correspond to residues R and D, respectively. Raw data can be found in the Supporting information section (S1 Data and S1 Raw Images). DAG, day after germination; FL, full-length; IDR, intrinsically disordered region; KISC, kinesin-separase complex; PM, plasma membrane; rsw4, radially swollen 4; SFH8, SEC FOURTEEN-HOMOLOG8; WT, wild type.
Fig 4
Fig 4. SFH8 forms PM liquid-like clusters that lack association with KISC.
(A) TIRFM setting for visualization of SFH8 at the PM. The model is showing the region used for imaging, and an example TIRFM micrograph of SFH8-mNeon (lower right; SFH8pro). Scale bar, 2 μm. In TIRFM imaging, the focal plane is restricted to the outermost tissues, and, therefore, epidermis of region 1 or 2 is inaccessible (see Fig 1C for a root model showing that the epidermis in this region is encapsulated by the root cap). (B) Example of a dual-channel TIRFM of lines expressing SFH8-mNeon (SFH8pro) and KIN7.3-RFP (RPS5apro). The experiment was replicated 5 times. Scale bar, 0.3 μm. (C) Kymograph showing laterally diffusing (*) and nondiffusing (**) clusters of SFH8. Arrowheads indicate the spatial offset of the diffusing cluster (lateral displacement on the PM plane is around approximately 200 nm). The arrows (2 μm and 1 s) show the spatiotemporal resolution. (D) Quantification of SFH8 clusters (SFH8pro) in 3 different stages, fusion, fission, and “stable” (i.e., not undergoing fission or fusion). The circularity of clusters is also shown (right). Data are means ± SD (N = 3 pooled experiments, n = 4–6 fields with percentages per experiment; the p-values were calculated by 1-way ANOVA). (E) Examples of SFH8-mNeon clusters fusing on the PM. Note that similar sizes and fusion dynamics of clusters were observed with 2 promoters (SFH8pro and RPS5apro), suggesting independence of these parameters from expression levels (higher for RPS5apro). Scale bars, 0.3 μm. (F) Dual-channel TIRFM of SFH8-mNeon/KIN7.3-RFP coexpressing line showing SFH8 clusters and the formation of filaments that do not diffuse. Note the lateral diffusion of SFH8 clusters and the lack of filaments motility (circles). The experiment was replicated 3 times. Scale bars, 0.3 μm. (G) Kymographs show clusters with low (left) and high (right) dwelling times at the PM. Right: pie graphs showing quantifications of KIN7.3 and SFH8 colocalization percentages in clusters or filaments (N = 3 pooled experiments, n = as indicated; p-values were calculated by Wilcoxon). The arrows (1 μm and 0.2 s) show the spatiotemporal resolution. Raw data can be found in the Supporting information section (S1 Data). KISC, kinesin-separase complex; PM, plasma membrane; SFH8, SEC FOURTEEN-HOMOLOG8; TIRFM, total internal reflection fluorescence microscopy.
Fig 5
Fig 5. KISC abrogation retains the clustered phase of SFH8 through SFH8 N-terminus.
(A) FRAP analysis of SFH8-mNeon immobile fraction (SFH8pro; 7 DAG, epidermis regions 1–4). Data are means ± SD (N = 1, n = 10 roots at each point). Right: clusters and filaments in 2 root regions (7 DAG, cortex regions 1 and 4) determined by super-resolution confocal microscopy (midsection; regions 1 and 4, left and right, respectively) and a model showing the SFH8 clusters-to-filaments conversion and its dependence by KISC (relevant to (B)). (B) SFH8-mNeon (SFH8pro) localization in WT, k135, and rsw4 root cells (5 DAG, region 3, TIRFM; arrowheads indicate filaments). Scale bar, 0.5 μm. Right: quantification of SFH8-mNeon clusters and filaments in WT, k135, and rsw4 (data are means ± SD, N = 3 pooled experiments, n = 2–3 roots with 5 fields of view per experiment; p-values were calculated by Wilcoxon). Clusters with circularity below 0.5 were defined as filamentous. (C) In silico predictions of IDRs by PONDR (left), and phase separation propensity determined by catGRANULE [40] for SFH8 and SFH6 (right). (D) Micrographs from N. benthamiana leaf epidermis showing the reduced puncta formation in a chimeric protein of SFH6IDR and the C-terminal SFH8 (SDH6IDRSFH8), in the presence of ESP/CyclinD (see also S3 Fig for the activation of ESP protein by CyclinD). The experiment was replicated 3 times. Scale bars, 20 μm. (E) Comparative analysis of the SFH8 IDR amino acid residue composition. Each amino acid residue is assigned to one of 6 groups on the x-axis, and the fraction of grouped amino acids is shown. For comparison, model “condensators” are shown (ARF19 to FUS). The lengths of the IDRs were determined by the fIDPnn [41]. (F) Micrographs (midplane) showing the localization of SFH8R84A (7 DAG, epidermis region 3). Scale bars, 2 μm. Right: persistence of PM SFH8 condensates in sfh8 SFH8R84A lines (TIRFM, setting as in Fig 4A). Scale bars, 0.2 μm. Bottom: the pie graphs show the quantification of mNeon-SFH8 or mNeon-SFH8R84A clusters and filaments (N = 4 pooled experiments, n = 122; p-values were calculated by a 2-tailed t test). (G) Puncta formation and polarity of mNeon-SFH8 PM signal (SFH8pro) in WT, k135, or rsw4 (7 DAG, epidermis of region 3). Numbers indicate polarity indexes (data are means ± SD, N = 3 pooled experiments, n = 5–10 cells per experiment; “***”: p < 0.0001 to WT; p-values were calculated by Dunnett). Scale bars, 5 μm. (H) Quantifications of mNeon-SFH8 puncta in WT, k135, or rsw4 (7 DAG, epidermis region 3; N = 3 pooled experiments, n = 74–98 cells per experiment; p-values were calculated by ANOVA). Raw data can be found in the Supporting information section (S1 Data). DAG, day after germination; ESP, EXTRA SPINDLE POLES; FRAP, fluorescence recovery after photobleaching; IDR, intrinsically disordered region; KISC, kinesin-separase complex; PLD, prion-like domain; PM, plasma membrane; rsw4, radially swollen 4; SFH8, SEC FOURTEEN-HOMOLOG8; TIRFM, total internal reflection fluorescence microscopy; WT, wild type.
Fig 6
Fig 6. SFH8 can affect PIN2 dynamics at the PM.
(A) Micrographs showing PIN2-GFP signal intensity (colour-coded as spectrum intensity) in WT and sfh8 and quantification (right) of PIN2-GFP on PM of WT, sfh8, k135, and rsw4 (7 DAG, region 3; data are means ± SD, N = 2 pooled experiments; n = 5–10 cells per experiment; p-values were calculated by multiple comparisons Dunnett). Scale bars, 50 μm. (B) PIN2 localization (α-PIN2) in WT and sfh8 (colour-coded as in (A); a-tubulin staining was used to show focal plane; 5 DAG, region 3). Arrowheads indicate PIN2 accumulation maximum. Note in sfh8, the slight polarity offset and the high number of PIN2-positive endosome-like structures. The sfh8 signal intensity has been adjusted to normalize signal intensity between sfh8 and WT. Scale bars, 10 μm. Right: quantification of endosomes above the confocal diffraction limit (approximately 200 nm) in WT and sfh8 under normal conditions (data are means ± SD, N = 4 pooled experiments; n = 25–34 cells per experiment, 5 DAG, region 3; p-value was calculated by ordinary ANOVA). (C) PIN2 localization (α-PIN2; 7 DAG, midsection epidermis and cortex region 3) in WT, sfh8, and SFH8R84A sfh8 (brightness has been adjusted here in sfh8 and sfh8 SFH8R84A), or HF-SFH8 (“F”). Yellow arrowheads denote PIN2 polarity. Right: quantification of cells with proper PIN2 polarity in cortex of WT, sfh8 (expressing also SFH8R84A, mScarlet-SFH8 (“S”) or HF-SFH8), k135, and rsw4 (data are means ± SD, N = 10 pooled experiments, n = 8–10 cells per experiment; “*”: p < 0.0001 to WT; 1-way ANOVA, for the number of cells: N = 4, n = 118, Kruskal–Wallis). Scale bars, 5 μm. (D) PIN2-GFP localization in WT and sfh8 treated with 50 μm BFA for 1 h and after BFA washout for 30 min (7 DAG, epidermis and cortex region 3). The experiment was replicated 3 times. Scale bars, 4 μm. (E) Quantification of BFA bodies (50 μm BFA for 1 h agglomerates ± CHX) in WT and sfh8. CHX was added to a final concentration of 30 μM (1 h pretreatment and retained throughout the experiment). Data are means ± SD (N = 3 pooled experiments; n = 5 fields of view per experiment; p-values were calculated by a paired 2-tailed t test between WT/SFH8 in the presence of BFA). Scale bars, 5 μm. (F) FRAP from polarized PIN2 (7 DAG, epidermis region 3) in WT and sfh8. Note the offset of PIN2 polarity (yellow arrowheads) in sfh8. The rectangular denotes the bleached ROI. The experiment was replicated twice. Scale bars, 3 μm. Right: quantification of the corresponding PIN2 signal recovery. Data are means ± SD (N = 2 pooled experiments, n = 5–10 cells per experiment). The red faded band parallel to the y-axis indicates laser iteration time (“bleach”). Numbers next to the genotype, denote recovery half-time (t1/2) ± SD (p-value was calculated by a paired 2-tailed t test). Raw data can be found in the Supporting information section (S1 Data). BFA, brefeldin A; CHX, cycloheximide; DAG, day after germination; FRAP, fluorescence recovery after photobleaching; PIN, PINFORMED; PM, plasma membrane; ROI, region of interest; rsw4, radially swollen 4; SFH8, SEC FOURTEEN-HOMOLOG8; WT, wild type.
Fig 7
Fig 7. SFH8 restricts PIN2 delivery when it is uncleaved.
(A) Micrographs of tagged with mScarlet uncleaved SFH8 (RPS5apro; region 1) and cleaved SFH8 (converted to SFH8ΔIDR; region 4) that can colocalize with PIN2-GFP for C-terminally tagged SFH8 (left) but not with N-terminally tagged SFH8 (middle; 7 DAG, epidermis regions 1 and 4). Right: micrographs showing the colocalization of HF-KIN7.3-tagRFP (RPS5apro) with PIN2-GFP (7 DAG, epidermis regions 1 and 4). The experiment was replicated 3 times. Scale bars, 5 μm. (B) Quantifications of PCC colocalization between SFH8/PIN2, KIN7.3/PIN2, or KIN7.3/SFH8 (apicobasal or lateral domains, for KIN7.3; data are means ± SD, N = 3 pooled experiments, n = 10–15 cells per experiment; “*”: p < 0.01, “**”: <0.001, “***”: <0.0001, to region 1; p-values were calculated by nested 1-way ANOVA). ns, nonsignificant. (C) Quantifications of polarity index for SFH8, KIN7.3, and PIN2 (data are means ± SD, N = 3 pooled experiments, n = 4–10 cells from each root region per experiment; “*”: p < 0.01, “**”: <0.001, “***”: <0.0001, to region 1; p-values were calculated by nested 1-way ANOVA). (D) Super-resolution micrographs with insets showing details of HF-mScarlet-SFH8 (RPS5apro) cluster/PIN2 exclusion (7 DAG, epidermis region 3 for the upper 2 micrographs and region 2 for the lower micrograph “clusters”). The experiment was replicated 3 times. Scale bars (left micrographs), 1 μm. Right: PCC values represent colocalization analyses between KIN7.3 or SFH8 with PIN2, while clusters of SFH8 (region 2) showed anticorrelation (denoted by the arrowhead in the inset “c” and low PCC). Data are means ± SD (N = 3, n = 36–36 measurements on PM per experiment). Raw data can be found in the Supporting information section (S1 Data). DAG, day after germination; PCC, Pearson correlation coefficient; PIN, PINFORMED; SFH8, SEC FOURTEEN-HOMOLOG8.
Fig 8
Fig 8. Filaments of SFH8 promote its interactions and establish more accessible interfaces at the PM.
(A) PLA principle. See also [13]. (B) PLA-positive signal produced by SFH8/PIN2-GFP interaction (α-SFH8/α-GFP) when SFH8 is in its truncated form (SFH8ΔIDR) in region 3 onwards (7 DAG). Note the lack of PLA when SFH8 is full length. sfh8 was used as a negative control. The experiment was replicated 3 times. Scale bars, 5 μm. (C) α-SFH8 signal localization in WT (“sfh8” is a negative control with only background signal). Scale bars, 5 μm. The experiment was replicated 3 times. (D) Details of PLA-positive PIN2/SFH8 signal puncta at the PM. Scale bar, 1 μm. (E) Quantification of PIN2/SFH8 PLA signals in 4 regions of WT or sfh8 (data are means ± SD, N = 4 pooled experiments, n = 10–30 cells per experiment; p-values were calculated by a nested 1-way ANOVA). (F) SE-FRET efficiency (colour-coded as spectrum intensity) in regions 2 and 3 (5 DAG, epidermis and cortex) between PIN2-GFP and SFH8-mScarlet (RPS5apro). The 2 proteins interact in epidermis and cortex (note the “FRET intensity” micrograph). The spectrum intensity scale is shown next to the micrographs. The experiment was replicated 3 times. Scale bar, 50 μm. (G) Quantification of SE-FRET between SFH8/PIN2 and SFH8/PIP2a (data are means ± SD, N = 3 pooled experiments, n = 12–15 cells per experiment; p-values were calculated by a paired 2-tailed t test). (H) A minimal system to detect the effects of proteins in stereochemical hindrance during fusion, using DNA zippers that bring together liposomes and promote their fusion. If SFH8 would exert stereochemical hindrance (due to the entropic bristle effect), liposome fusion would be blocked. (I) DNA zipper assay with GST-SFH8ΔIDR or -SFH8 (full length; liposomes; lumen was labelled with fluorescein only). The enlarged micrographs (upper right) show a time series of the tethering/fusion of 2 liposomes that converted to GUVs in the presence of SFH8ΔIDR. Scale bars, 2 μm. Bottom right: quantification of corresponding fusion events (data are means ± SD, N = 3 pooled experiments, n = 80–100 liposomes per experiment; means indicated with vertical lines; p-values were calculated by Wilcoxon). (J) Super-resolution micrographs showing the fusion blockage by fluorescently labelled SFH8 (G-SFH8) clusters on liposomes (stained with PE-Texas red [magenta]). Arrowhead denotes an SFH8 cluster formed on the LUV liposome (images after deconvolution). The experiment was replicated 3 times. Scale bars, 2 μm. (K) Super-resolution micrographs showing liposome (LUVs) content mixing with lumen stained with fluorescein (green), and lipids stained with PE-Texas red (magenta). Scale bars, 2 μm. Insets (right) show a hemifusion event (upper), and a combination of hemifusion with a tethered LUV (lower inset). The arrowheads show content mixing (pseudo-coloured white). Lower: quantification of the distribution (%) of LUVs in fused, unfused, and hemifused in the presence of recombinant GST, GST-SFH8, or GST-SFH8ΔIDR (data are means ± SD, N = 3 pooled experiments, n = 32–40 fields of view per experiment; p-values were calculated by Dunnett for “fusion” relative to GST). Raw data can be found in the Supporting information section (S1 Data). DAG, day after germination; FRET, Förster resonance energy transfer; GST, glutathione S-transferase; LUV, large unilamellar vesicle; PIN, PINFORMED; PLA, proximity ligation assay; PM, plasma membrane; SE, sensitized emission; SFH8, SEC FOURTEEN-HOMOLOG8; WT, wild type.
Fig 9
Fig 9. SFH8 modulates development.
(A) Phenotypes of WT, sfh8-1 (sfh8 onwards), and sfh8 rescued seedlings expressing SFH8-mNeon (SFH8pro; 10 DAG). (B) Kinematic root growth in the order of hours quantified using “SPIRO” (see also Materials and methods; 3 DAG = time 0; data are means ± SD, N = 5 pooled experiments, n = 8–10 roots per experiment). (C) Root growth rate (0–14 DAG) of WT, sfh8, k135, and rescued sfh8 expressing (with RPS5apro or SFH8pro, N- or C-terminally tagged with mNeon; data are means ± SD, N = 3 pooled experiments, n = 8–10 roots per experiment; “*”: p < 0.01, “**”: <0.001, “***”: <0.0001, WT vs. sfh8; p-values were calculated by a t test). (D) Phenotypes and quantifications of root length of WT, sfh8, k135, rsw4, rsw4 sfh8 and k135 sfh8, and the rescued sfh8 SFH8 (SFH8pro:SFH8-mNeon; data are means ± SD, N = 3 pooled experiments, n = 7–8 roots per experiment; p-values were calculated by a paired t test). (E) Micrographs of root meristems WT, sfh8, and of the rescued sfh8 SFH8 (5 DAG; red signal: stained cell walls with propidium iodide). Right: quantifications of WT, sfh8, or KISC mutants’ meristem sizes (data are means ± SD, N = 3 pooled experiments, n = 19; ordinary ANOVA). The arrowheads indicate the meristem (from QC to the “first elongating cell” showing >50% increase of size along the proximodistal axis). Scale bars, 50 μm. (F) Cytrap marker expression in WT and sfh8 (7 DAG), tracking S and M phases of the cell cycle. Scale bars, 50 μm. Right: corresponding quantifications (data are means ± SD, N = 3 pooled experiments, n = 9–11 roots per experiment; p-values were calculated by a paired t test). Raw data can be found in the Supporting information section (S1 Data). AUs, arbitrary units; DAG, day after germination; KISC, kinesin-separase complex; rsw4, radially swollen 4; SFH8, SEC FOURTEEN-HOMOLOG8; WT, wild type.
Fig 10
Fig 10. Model for SFH8 functions during development.
Proposed model for the role of SFH8 in root development. SFH8 (full-length) is recruited on the plasma membrane in a nonpolar manner and forms LLPS clusters at the PM (cell 1). These clusters seem to block the delivery of polar proteins to the PM (e.g., PIN2). Later, KISC is recruited on SFH8, and KISC proteolytic part (ESP) cleaves the N-terminal part of SFH8, which results in the production of SFH8ΔIDR (SFH8 lacking the N-terminal IDR; cell 2). The released IDR floats in the cytoplasm in the form of LLPS puncta. Microtubules may direct the KISC at the PM; however, microtubules/KISC do not remain associated at the PM. Later, SFH8ΔIDR ages to a filamentous form with clear polarity at the PM and interacts with other polar proteins, like, for example, PIN2 (cell 3). This phase transition of SFH8 and its polar localization are essential components of robust root development. The released IDR persists in the cytoplasm and has an unknown role. ESP, EXTRA SPINDLE POLES; IDR, intrinsically disordered region; KISC, kinesin-separase complex; LLPS, liquid–liquid phase separation; PIN, PINFORMED; PM, plasma membrane; SFH8, SEC FOURTEEN-HOMOLOG8.

Similar articles

Cited by

  • Basic design of artificial membrane-less organelles using condensation-prone proteins in plant cells.
    Koja Y, Arakawa T, Yoritaka Y, Joshima Y, Kobayashi H, Toda K, Takeda S. Koja Y, et al. Commun Biol. 2024 Oct 26;7(1):1396. doi: 10.1038/s42003-024-07102-8. Commun Biol. 2024. PMID: 39462114 Free PMC article.
  • Guidelines for naming and studying plasma membrane domains in plants.
    Jaillais Y, Bayer E, Bergmann DC, Botella MA, Boutté Y, Bozkurt TO, Caillaud MC, Germain V, Grossmann G, Heilmann I, Hemsley PA, Kirchhelle C, Martinière A, Miao Y, Mongrand S, Müller S, Noack LC, Oda Y, Ott T, Pan X, Pleskot R, Potocky M, Robert S, Rodriguez CS, Simon-Plas F, Russinova E, Van Damme D, Van Norman JM, Weijers D, Yalovsky S, Yang Z, Zelazny E, Gronnier J. Jaillais Y, et al. Nat Plants. 2024 Aug;10(8):1172-1183. doi: 10.1038/s41477-024-01742-8. Epub 2024 Aug 12. Nat Plants. 2024. PMID: 39134664 Review.
  • Seed longevity is controlled by metacaspases.
    Liu C, Hatzianestis IH, Pfirrmann T, Reza SH, Minina EA, Moazzami A, Stael S, Gutierrez-Beltran E, Pitsili E, Dörmann P, D'Andrea S, Gevaert K, Romero-Campero F, Ding P, Nowack MK, Van Breusegem F, Jones JDG, Bozhkov PV, Moschou PN. Liu C, et al. Nat Commun. 2024 Aug 8;15(1):6748. doi: 10.1038/s41467-024-50848-2. Nat Commun. 2024. PMID: 39117606 Free PMC article.
  • Stress-related biomolecular condensates in plants.
    Solis-Miranda J, Chodasiewicz M, Skirycz A, Fernie AR, Moschou PN, Bozhkov PV, Gutierrez-Beltran E. Solis-Miranda J, et al. Plant Cell. 2023 Sep 1;35(9):3187-3204. doi: 10.1093/plcell/koad127. Plant Cell. 2023. PMID: 37162152 Free PMC article.
  • Protein phase separation in plant membrane biology: more than just a compartmentalization strategy.
    Dragwidge JM, Van Damme D. Dragwidge JM, et al. Plant Cell. 2023 Sep 1;35(9):3162-3172. doi: 10.1093/plcell/koad177. Plant Cell. 2023. PMID: 37352127 Free PMC article.

References

    1. Milovanovic D, Wu Y, Bian X, De Camilli P. A liquid phase of synapsin and lipid vesicles. Science. 2018;361(6402):604–607. doi: 10.1126/science.aat5671 - DOI - PMC - PubMed
    1. Bose M, Lampe M, Mahamid J, Ephrussi A. Liquid-to-solid phase transition of oskar ribonucleoprotein granules is essential for their function in Drosophila embryonic development. Cell. 2022;185(8):1308–1324 e23. doi: 10.1016/j.cell.2022.02.022 - DOI - PMC - PubMed
    1. Su X, Ditlev JA, Hui E, Xing W, Banjade S, Okrut J, et al.. Phase separation of signaling molecules promotes T cell receptor signal transduction. Science. 2016;352(6285):595–599. doi: 10.1126/science.aad9964 - DOI - PMC - PubMed
    1. Farag M, Cohen SR, Borcherds WM, Bremer A, Mittag T, Pappu RV. Condensates formed by prion-like low-complexity domains have small-world network structures and interfaces defined by expanded conformations. Nat Commun. 2022;13(1):7722. doi: 10.1038/s41467-022-35370-7 - DOI - PMC - PubMed
    1. Mateos-Gil P, Tsortos A, Velez M, Gizeli E. Monitoring structural changes in intrinsically disordered proteins using QCM-D: application to the bacterial cell division protein ZipA. Chem Commun (Camb). 2016;52(39):6541–6544. doi: 10.1039/c6cc02127a - DOI - PubMed

Grants and funding

Funding for this work was through the Vetenskapsrådet (VR) (298264-2015 to PNM), Svenska Forskningsrådet Formas (MOP-86675 to PNM), Hellenic Foundation for Research & Innovation (HFRI)-Always Strive for Excellence-Theodore Papazoglou (1624 to PNM), Hellenic Foundation of Research and Innovation (HFRI) (06526 to AM), National Secretariat of research and innovation (GR) (Τ2ΕΔΚ-00597 to PNM), H2020 Marie Skłodowska-Curie Actions (RISE 872969 PANTHEON to PNM), Foundation for Research and Technology (FORTH-IMBB) Start-Up Funding (to PNM), and by the Deutsche Forschungsgemeinschaft (SCHA 1274/5-1, 841 Germany’s Excellence Strategy EXC-2070-390732324 PhenoRob to GS). The funders had no role in study design, data collection and analysis, decision to publish, or preparation of the manuscript.