. 2023 Apr 20;12(8):1195.
doi: 10.3390/cells12081195.

Inducible MLL-AF9 Expression Drives an AML Program during Human Pluripotent Stem Cell-Derived Hematopoietic Differentiation

Affiliations

Inducible MLL-AF9 Expression Drives an AML Program during Human Pluripotent Stem Cell-Derived Hematopoietic Differentiation

Branco M H Heuts et al. Cells. .

Abstract

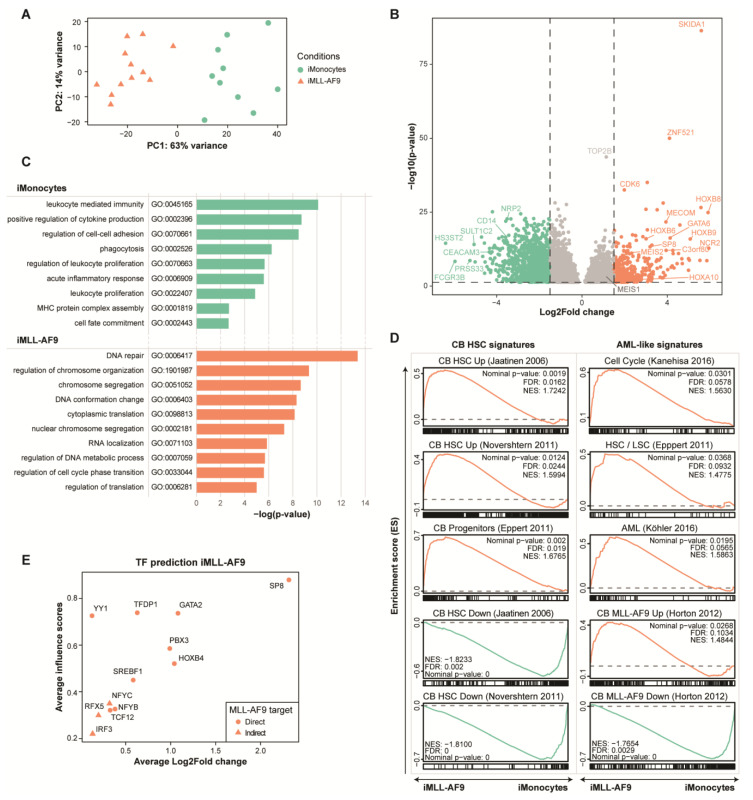
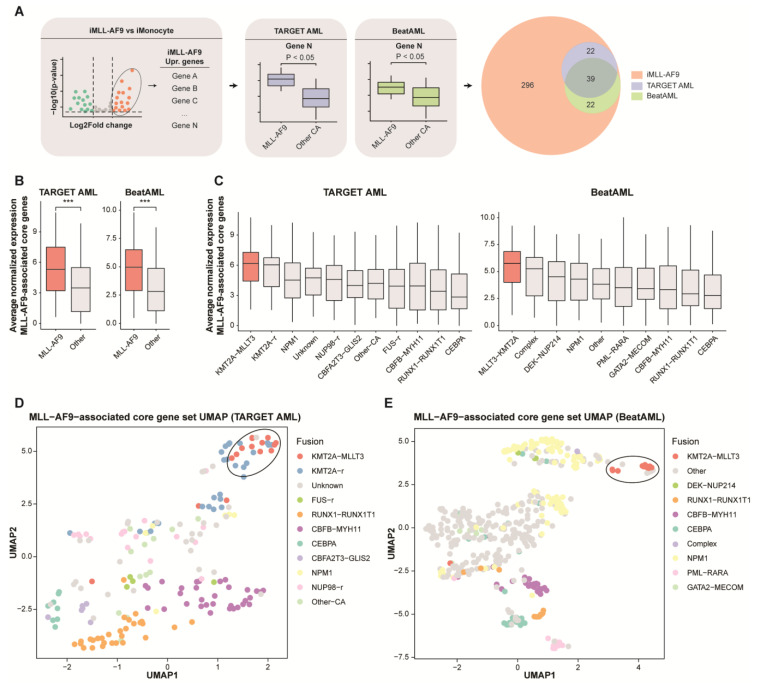
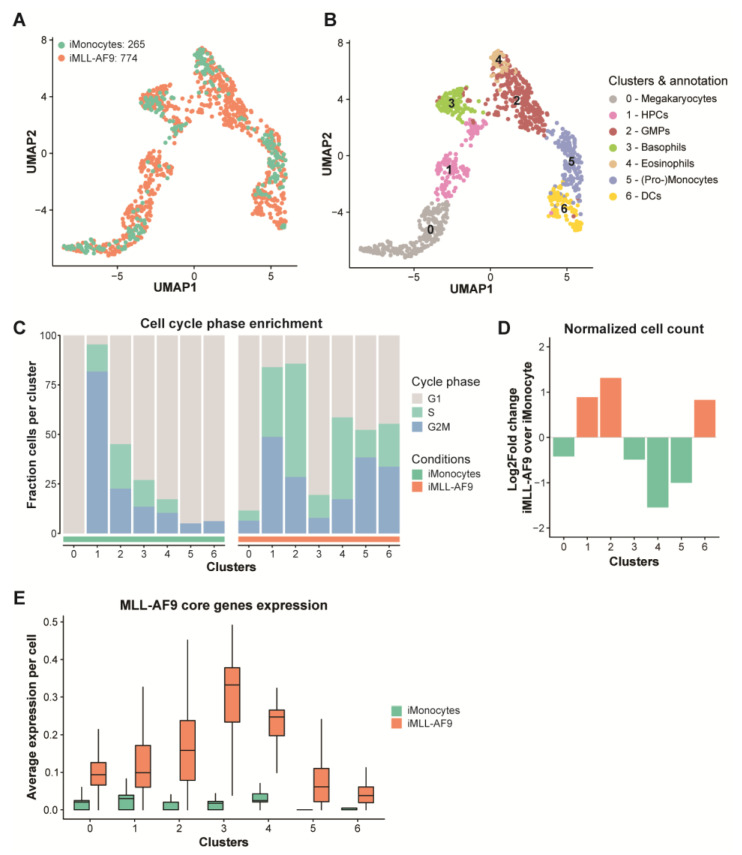
A t(9;11)(p22;q23) translocation produces the MLL-AF9 fusion protein, which is found in up to 25% of de novo AML cases in children. Despite major advances, obtaining a comprehensive understanding of context-dependent MLL-AF9-mediated gene programs during early hematopoiesis is challenging. Here, we generated a human inducible pluripotent stem cell (hiPSC) model with a doxycycline dose-dependent MLL-AF9 expression. We exploited MLL-AF9 expression as an oncogenic hit to uncover epigenetic and transcriptomic effects on iPSC-derived hematopoietic development and the transformation into (pre-)leukemic states. In doing so, we observed a disruption in early myelomonocytic development. Accordingly, we identified gene profiles that were consistent with primary MLL-AF9 AML and uncovered high-confidence MLL-AF9-associated core genes that are faithfully represented in primary MLL-AF9 AML, including known and presently unknown factors. Using single-cell RNA-sequencing, we identified an increase of CD34 expressing early hematopoietic progenitor-like cell states as well as granulocyte-monocyte progenitor-like cells upon MLL-AF9 activation. Our system allows for careful chemically controlled and stepwise in vitro hiPSC-derived differentiation under serum-free and feeder-free conditions. For a disease that currently lacks effective precision medicine, our system provides a novel entry-point into exploring potential novel targets for personalized therapeutic strategies.

Keywords: MLL-AF9; bioinformatics; differentiation; hematopoiesis; induced pluripotent stem cells (iPSCs); myeloid; oncogene.


Conflict of interest statement

The authors declare no conflict of interest.

Figures

Figure 1
Figure 1
Abnormal human iPSC-derived differentiation along the early hematopoietic monocyte axis. (A) RT-qPCR analysis of iPSCs before and after induction of MLL-AF9 with 14 or 50 ng/mL doxycycline for 24 h. THP-1, an MLL-AF9-positive cell line, was used as a positive control. The colors represent two sets of primer pairs. AAVS1-MLL-AF9 represents the combination of a primer pair on the AAVS1 locus and MLL-AF9, while MLL-AF9 represents a primer pair covering the fusion point of MLL-AF9. GAPDH was used as an endogenous control. (B) Western blot analysis identified MLL-AF9 protein expression in iPSCs after 24 h stimulation with 50 ng/mL doxycycline using an antibody targeting MLL-N, resulting in the detection of endogenous MLL and the MLL-AF9 fusion protein. Vinculin (130 kDa) was used a loading control. (C) A schematic representation of iPSCs to iMonocyte or iMLL-AF9 differentiation, highlighting the induced changes along the differentiation axis. The plus signs signify the induction/maintenance of doxycycline at the respective days. “Transfer” indicates the transfer of cells in the supernatant to a new culture plate supplemented with Stemline II medium and monocyte cytokine cocktail. Cells were maintained until exhaustion occurred. (D) Total cumulative expansion of cells grown (per mL) during monocytic differentiation for each condition. (E) At day 15 of the differentiation protocol, flow cytometric analysis was performed using a cocktail of antibodies that target monocyte cell-surface markers (CD64 and CD14) on iMonocytes and iMLL-AF9 cells. (F) Boxplots depicting the mean log-normalized expression values of CD34 and SPN (CD43) for iMonocytes versus iMLL-AF9. The whiskers represent standard deviation; edges depict the inter-quartile ranges. The black center line represents the median. Two and three asterisks signify p-value < 0.01 and p-value < 0.001, respectively (one-way ANOVA).
Figure 2
Figure 2
Identification of MLL-AF9-induced expression changes and key transcription factors. (A) PCA plot of iMonocytes and iMLL-AF9 cells. RNA-seq samples collected from three independent differentiation experiments, including at least three biological replicates each between day 20 and day 28. Shapes and colors represent the conditions. (B) Volcano plot representing differentially expressed genes of iMLL-AF9 cells compared to iMonocytes. Y-axis depicts -log of the p-values and x-axis the log2 fold change. Dotted lines signify a cut-off for significance (p-value < 0.05) and an absolute log2 fold change > 1.5. The color green and orange indicate significantly upregulated genes in iMonocytes and iMLL-AF9 cells, respectively. (C) Significantly enriched and summarized GO-terms important in either iMonocytes or iMLL-AF9 cells, including -log of p-values for each term. (D) Gene set enrichment figures with CB HSCs [33,34], CB progenitors [35], cell cycle genes [36], leukemic stem cells (LSC) [35], acute myeloid leukemia [37], and MLL-AF9 CB signatures [6]. Depicted are the enrichment scores (ES), nominal p-values, false discovery rates (FDR), and normalized enrichment scores (NES). The colors signify the condition in which the gene set is enriched—orange represents iMLL-AF9 cells and green represents iMonocytes. (E) Scatterplot representing the average log2 fold change (x-axis) and average inferred influence scores (y-axis) of TFs important in iMLL-AF9 cells compared to iMonocytes from two independent differentiation experiments. The influence score represents how well differences in two cell states can be explained by a TF. The shape represents direct binding of the MLL-AF9 fusion protein to the respective TF locus.
Figure 3
Figure 3
Uncovering high-confidence MLL-AF9-associated genes in primary AML. (A) Schematic representation of identifying MLL-AF9-associated genes. First, significant upregulated genes in iMLL-AF9 cells compared to iMonocytes are uncovered. For each upregulated gene, the expression was determined and statistically tested (one-way ANOVA) in two independent primary AML cohorts: (pediatric) TARGET AML and (adult) BeatAML. CA stands for cytogenetic abnormality. Finally, 39 genes that were significantly upregulated in both cohorts as well as the iMLL-AF9 cells, were considered MLL-AF9-associated core genes. (B) Boxplots depicting the mean log-normalized expression value of MLL-AF9-associated core genes (n = 61) for each MLL-AF9 patient versus patients with other AML subtypes, for each respective cohort (TARGET AML and BeatAML). The whiskers represent standard deviation; edges depict the inter-quartile ranges. The black center line represents the median. Three asterisks signify p-value < 0.001. (C) Boxplots illustrating the mean log-normalized expression value of the MLL-AF9-associated core genes per AML subtype in each respective cohort (TARGET AML and BeatAML). The whiskers represent standard deviation, edges depict the inter-quartile ranges, and the black center line illustrates the median. (D) UMAP visualization of 187 primary AML samples from the TARGET AML pediatric cohort using the expression of 39 MLL-AF9-associated core genes. Dots are colored according to cytogenetic abnormality annotation. (E) Similar to (D), except using 460 primary AML samples from the BeatAML adult cohort.
Figure 4
Figure 4
Single-cell RNA-seq analysis of iPSC-derived iMonocytes and iMLL-AF9 cells. (A) UMAP visualization of 265 iMonocytes and 774 iMLL-AF9 cells. Dots are colored according to conditions. (B) UMAP visualizing Louvain clustering. Clusters are numbered and colored. Each cluster is annotated according to expression of established markers. (C) Bar chart representing the fraction of cells enriched for a specific cell cycle phase (G1, G2M, S) for each cluster and condition. (D) Bar chart illustrating the normalized cell count fold change of iMLL-AF9 cells over iMonocytes. The orange color represents higher cell count for the MLL-AF9 induced condition and green represents higher cell count in the iMonocyte condition. (E) Boxplots illustrating the mean normalized and denoised expression of MLL-AF9-associated core genes for each cell per cluster. The whiskers represent standard deviation, edges depict the inter-quartile ranges, and the black center line illustrates the median. Colors represent the conditions.

Similar articles

Cited by

References

    1. Look A.T. Oncogenic Transcription Factors in the Human Acute Leukemias. Science. 1997;278:1059–1064. doi: 10.1126/science.278.5340.1059. - DOI - PubMed
    1. Martens J.H.A., Stunnenberg H.G. The Molecular Signature of Oncofusion Proteins in Acute Myeloid Leukemia. FEBS Lett. 2010;584:2662–2669. doi: 10.1016/j.febslet.2010.04.002. - DOI - PubMed
    1. Krivtsov A.V., Armstrong S.A. MLL Translocations, Histone Modifications and Leukaemia Stem-Cell Development. Nat. Rev. Cancer. 2007;7:823–833. doi: 10.1038/nrc2253. - DOI - PubMed
    1. Muntean A.G., Hess J.L. The Pathogenesis of Mixed-Lineage Leukemia. Annu. Rev. Pathol. Mech. Dis. 2012;7:283–301. doi: 10.1146/annurev-pathol-011811-132434. - DOI - PMC - PubMed
    1. Kotani S., Yoda A., Kon A., Kataoka K., Ochi Y., Shiozawa Y., Hirsch C., Takeda J., Ueno H., Yoshizato T., et al. Molecular Pathogenesis of Disease Progression in MLL-Rearranged AML. Leukemia. 2018;33:612–624. doi: 10.1038/s41375-018-0253-3. - DOI - PMC - PubMed

Publication types

MeSH terms

Substances

Grants and funding

This research was funded by Stichting Kinderen Kankervrij, 315.