. 2023 Apr 5:11:866847.
doi: 10.3389/fcell.2023.866847. eCollection 2023.

Dose-dependent effect of GFI1 expression in the reconstitution and the differentiation capacity of HSCs

Affiliations

Dose-dependent effect of GFI1 expression in the reconstitution and the differentiation capacity of HSCs

Xiaoqing Xie et al. Front Cell Dev Biol. .

Abstract

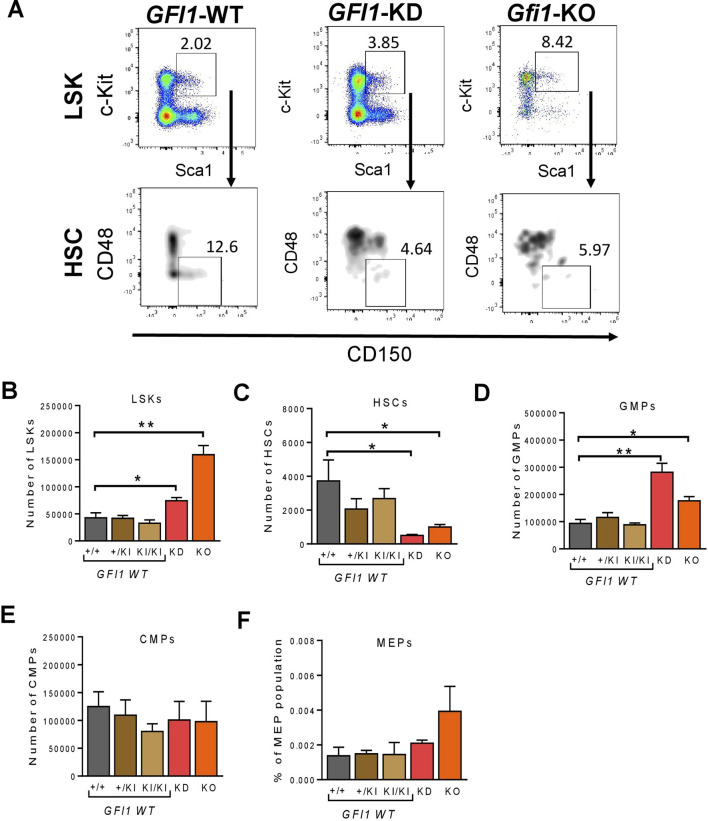
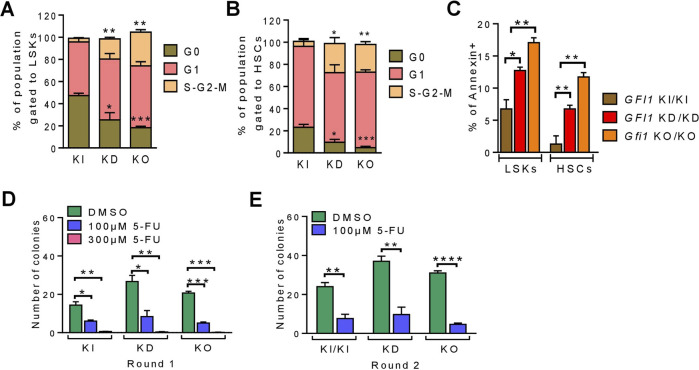
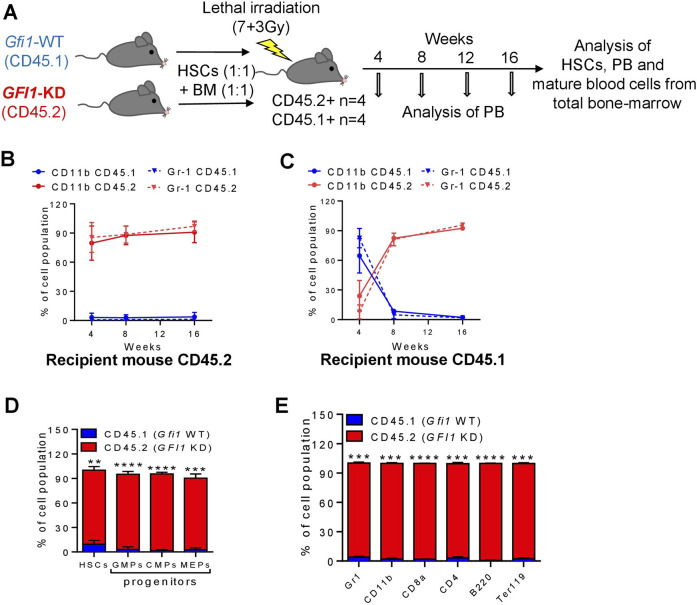
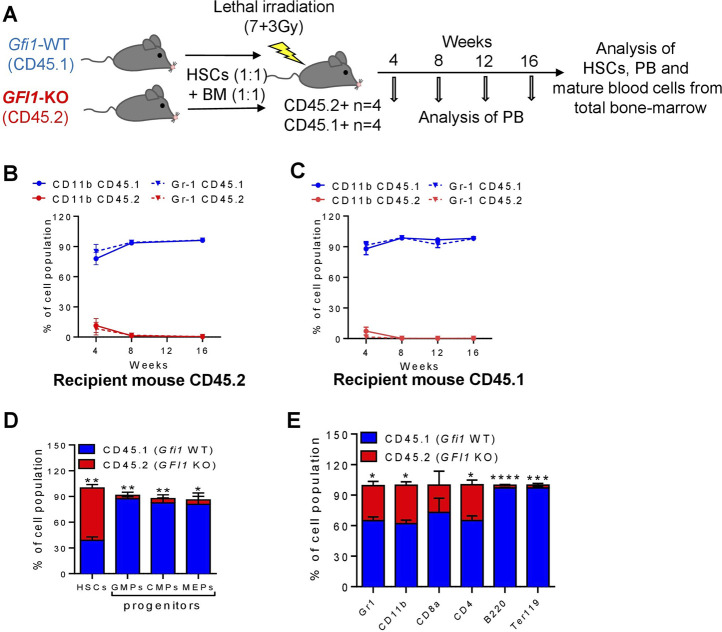
GFI1 is a transcriptional repressor and plays a pivotal role in regulating the differentiation of hematopoietic stem cells (HSCs) towards myeloid and lymphoid cells. Serial transplantation of Gfi1 deficient HSCs repopulated whole hematopoietic system but in a competitive setting involving wild-type HSCs, they lose this ability. The underlying mechanisms to this end are poorly understood. To better understand this, we used different mouse strains that express either loss of both Gfi1 alleles (Gfi1-KO), with reduced expression of GFI1 (GFI1-KD) or wild-type Gfi1/GFI1 (Gfi1-/GFI1-WT; corresponding to the mouse and human alleles). We observed that loss of Gfi1 or reduced expression of GFI1 led to a two to four fold lower number of HSCs (defined as Lin-Sca1+c-Kit+CD150+CD48-) compared to GFI1-WT mice. To study the functional influence of different levels of GFI1 expression on HSCs function, HSCs from Gfi1-WT (expressing CD45.1 + surface antigens) and HSCs from GFI1-KD or -KO (expressing CD45.2 + surface antigens) mice were sorted and co-transplanted into lethally irradiated host mice. Every 4 weeks, CD45.1+ and CD45.2 + on different lineage mature cells were analyzed by flow cytometry. At least 16 weeks later, mice were sacrificed, and the percentage of HSCs and progenitors including GMPs, CMPs and MEPs in the total bone marrow cells was calculated as well as their CD45.1 and CD45.2 expression. In the case of co-transplantation of GFI1-KD with Gfi1-WT HSCs, the majority of HSCs (81% ± 6%) as well as the majority of mature cells (88% ± 10%) originated from CD45.2 + GFI1-KD HSCs. In the case of co-transplantation of Gfi1-KO HSCs with Gfi1-WT HSCs, the majority of HSCs originated from CD45.2+ and therefore from Gfi1-KO (61% ± 20%); however, only a small fraction of progenitors and mature cells originated from Gfi1-KO HSCs (<1%). We therefore in summary propose that GFI1 has a dose-dependent role in the self-renewal and differentiation of HSCs.

Keywords: Gfi1; HSC; differentiation; dose-dependent; engraftment.


Conflict of interest statement

The authors declare that the research was conducted in the absence of any commercial or financial relationships that could be construed as a potential conflict of interest.

Figures

FIGURE 1
FIGURE 1
Gfi1 is required for HSC generation. (A). Gating strategy for the identification of LSKs and HSCs. Murine BM cells were isolated, stained and gated for surface marker’s expression (lineage marker, c-Kit, Sca1, CD48 and CD150) by flow cytometry. Representative flow cytometry data (GFI1-WT, GFI1-KD and Gfi1-KO mice) are shown. (B). Reduced levels of GFI1 (GFI1-KD) and loss of Gfi1 (Gfi1-KO) led to an increase in LSK (LinSca1+c-Kit+) cell number compared to GFI1 WT (+/+, +/KI, KI/KI). Depicted is the number of LSK cells in the total BM cells. (C). Knockdown or loss of GFI1/Gfi1 resulted in a significant decrease in the number of HSCs (LinSca1+c-Kit+CD150+CD48). (D–F). The bar plots show the number of hematopoietic progenitor cells (GMPs, CMPs and MEPs) in GFI1 WT (+/+, +/KI, KI/KI), GFI1-KD and GFI1-KO mice (n ≥ 3; Avg ± SEM; *p ≤ 0.048; **p = 0.0091; ***p = 0.0004).
FIGURE 2
FIGURE 2
Reduced or loss of GFI1 expression resulted in enhanced cell proliferation and apoptosis. (A, B). The cell cycle status of GFI1-KI, -KD and -KO mice was measured in LSKs and HSCs populations (n ≥ 3; Avg ± SEM; *p ≤ 0.0336; **p ≤ 0.0027; ***p ≤ 0.0008). (C). The apoptosis rate of GFI1-WT, -KD and -KO mice was measured by the percentage of annexin-positive cells in LSKs and HSCs populations (n = 3; Avg± SEM; *p = 0.0176; **p ≤ 0.0093). (D, E). The CFU assay was performed from the HSCs of GFI1- KI, -KD and -KO mice with different doses of 5-FU as indicated. Quantification of the colonies represents the clonogenic potential of different HSCs populations in different conditions and rounds of plating [first round (D) and second round (E)] (n = 3; Avg ± SEM; *p ≤ 0.0151; **p ≤ 0.0069; ***p ≤ 0.0004; ****p ≤ 0.0001).
FIGURE 3
FIGURE 3
Mature cells were derived from CD45.2+ GFI1-KD HSCs in a competitive transplantation setting with CD45.1+ Gfi1-WT HSCs. (A). Schematic representation of the competitive transplantation assay setup. HSCs were isolated from CD45.1 expressed Gfi1-WT mice and CD45.2-expressing GFI1-KD mice and were mixed in equal numbers (200 HSCs from each mouse) and transplanted into lethally irradiated C57Bl/6 recipient mice using 500,000 total BM cells as carrier cells (250,000 from each mouse). After the transplantation, the PB was analyzed at different time points and the BM was analyzed upon euthanization for the presence of HSCs and mature blood cells. (B, C). CD45.1 and CD45.2 expression on the cell surface of myeloid (granulocytes and monocytes) cells in the peripheral (PB) were measured by flow cytometry at 4, 8, 12, and 16 weeks after transplantation into CD45.2+ and CD45.1 + recipient mice. Granulocytes were defined as Ly6GhiCD11b+, Monocytes were defined as Ly6GintCD11b+. (D) The percentage of HSCs and progenitor populations (GMPs, CMPs and MEPs) expressing CD45.1 and CD45.2 receptors, measured from the total BM cells (n = 3; Avg ± SEM; **p = 0.0061; ****p ≤ 0.0001). (E) The percentage of differentiated cell populations (gr1-granulocytes, CD11b-monocytes, CD8a-cytotoxic T cells, CD4 T-Helper cells, B220-B lymphocytes, Ter119-erythrocytes) expressing CD45.1 and CD45.2 receptors, measured from the BM cells (n = 3; Avg ± SEM; ***p ≤ 0.0003; ****p ≤ 0.0001).
FIGURE 4
FIGURE 4
Mature cells were derived from CD45.1+ Gfi1-WT HSCs in a competitive transplantation setting with CD45.2+ Gfi1-KO HSCs. (A). Schematic diagram of the competitive transplantation assay setup. HSCs were isolated from CD45.1 expressed Gfi1-WT mice and CD45.2-expressing GFI1-KO mice and were mixed in equal numbers (200 HSCs from each mouse) and transplanted into lethally irradiated C57Bl/6 recipient mice using 500,000 total bone-marrow cells as carrier cells (250,000 from each mouse). After the transplantation, the PB was analyzed at different time points and the BM was analyzed upon euthanization for the presence of HSCs and mature blood cells. (B, C). CD45.1 and CD45.2 expression on the cell surface of myeloid (granulocytes and monocytes) cells in the PB were measured by flow cytometry at 4, 8, 12 and 16 weeks after transplantation into CD45.2+ and CD45.1 + recipient mice. Granulocytes were defined as Ly6GhiCD11b+, Monocytes were defined as Ly6GintCD11b+. (D) The percentage of HSCs and progenitor populations (GMPs, CMPs and MEPs) expressing CD45.1 and CD45.2 receptors was measured from the total BM cells (n = 3; Avg± SEM; *p = 0.0313; **p ≤ 0.0087). (E). The percentage of differentiated cell populations (gr1-granulocytes, CD11b-monocytes, CD8a-cytotoxic T cells, CD4 T-Helper cells, B220-B lymphocytes, Ter119-erythrocytes) expressing CD45.1 and CD45.2 receptors were measured from the total BM cells (n = 3; Avg ± SEM; *p ≤ 0.0433; ***p = 0.0005).
FIGURE 5
FIGURE 5
RNA-seq data indicate differential regulation of cell-cycle-related pathways in GFI1-KD HSCs. Pathway analysis from the RNA-seq data shows significantly altered pathways in GFI1-KD HSCs in comparison with GFI1-KI HSCs.

Similar articles

References

    1. Akala O. O., Park I. K., Qian D., Pihalja M., Becker M. W., Clarke M. F. (2008). Long-term haematopoietic reconstitution by Trp53-/-p16Ink4a-/-p19Arf-/- multipotent progenitors. Nature 453 (7192), 228–232. 10.1038/nature06869 - DOI - PubMed
    1. Botezatu L., Michel L. C., Helness A., Vadnais C., Makishima H., Hönes J. M., et al. (2016). Epigenetic therapy as a novel approach for GFI136N-associated murine/human AML. Exp. Hematol. 44 (8), 713–726. 10.1016/j.exphem.2016.05.004 - DOI - PubMed
    1. Fraszczak J., Vadnais C., Rashkovan M., Ross J., Beauchemin H., Chen R., et al. (2019). Reduced expression but not deficiency of GFI1 causes a fatal myeloproliferative disease in mice. Leukemia 33 (1), 110–121. 10.1038/s41375-018-0166-1 - DOI - PMC - PubMed
    1. Goardon N., Marchi E., Atzberger A., Quek L., Schuh A., Soneji S., et al. (2011). Coexistence of LMPP-like and GMP-like leukemia stem cells in acute myeloid leukemia. Cancer cell 19 (1), 138–152. 10.1016/j.ccr.2010.12.012 - DOI - PubMed
    1. Hock H., Hamblen M. J., Rooke H. M., Schindler J. W., Saleque S., Fujiwara Y., et al. (2004). Gfi-1 restricts proliferation and preserves functional integrity of haematopoietic stem cells. Nature 431 (7011), 1002–1007. 10.1038/nature02994 - DOI - PubMed

Grants and funding

JS and the work were supported by a grant from the Fritz-Thyssen foundation. CK was supported by a Max-Eder fellowship from the German Cancer Fund (Deutsche Krebshilfe) and the Dr Werner Jackstädt-Stiftung. The work was supported by the Jose Carreras Leukämie Foundation (DJCLS 17R/2018), partially by the Deutsche Krebshilfe (70112392), Deutsche Forschungsgemeinschaft (KH331/2-3), and the intramural funding of the faculty of Medicine at University Hospital of Muenster (Kha2/002/20). HB acknowledges funding by the Deutsche Forschungsgemeinschaft (DFG, German Research Foundation) under Germany`s Excellence Strategy – EXC 22167-390884018.