

The Insulin Receptor Substrate 2 Mediates the Action of Insulin on HeLa Cell Migration via the PI3K/Akt Signaling Pathway
- PMID: 36975518
- PMCID: PMC10047682
- DOI: 10.3390/cimb45030148
The Insulin Receptor Substrate 2 Mediates the Action of Insulin on HeLa Cell Migration via the PI3K/Akt Signaling Pathway
Abstract
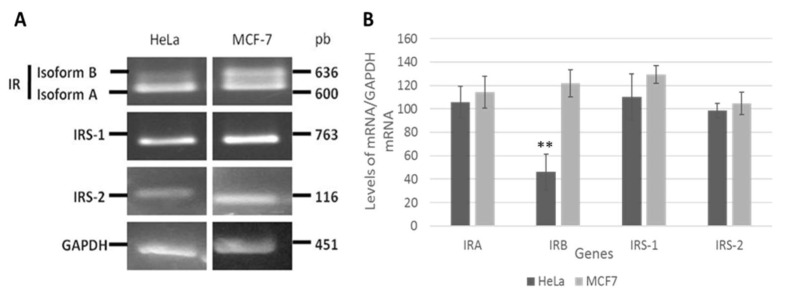
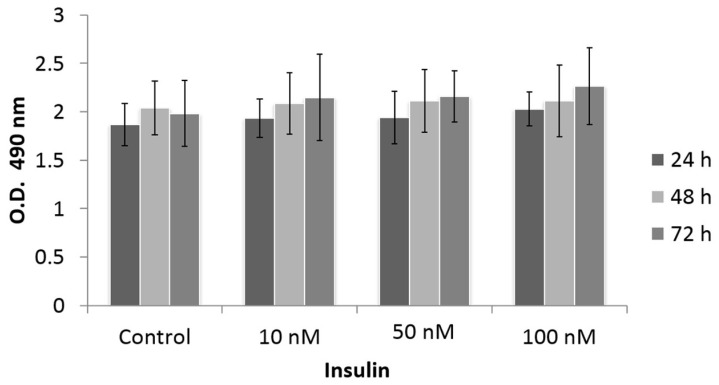
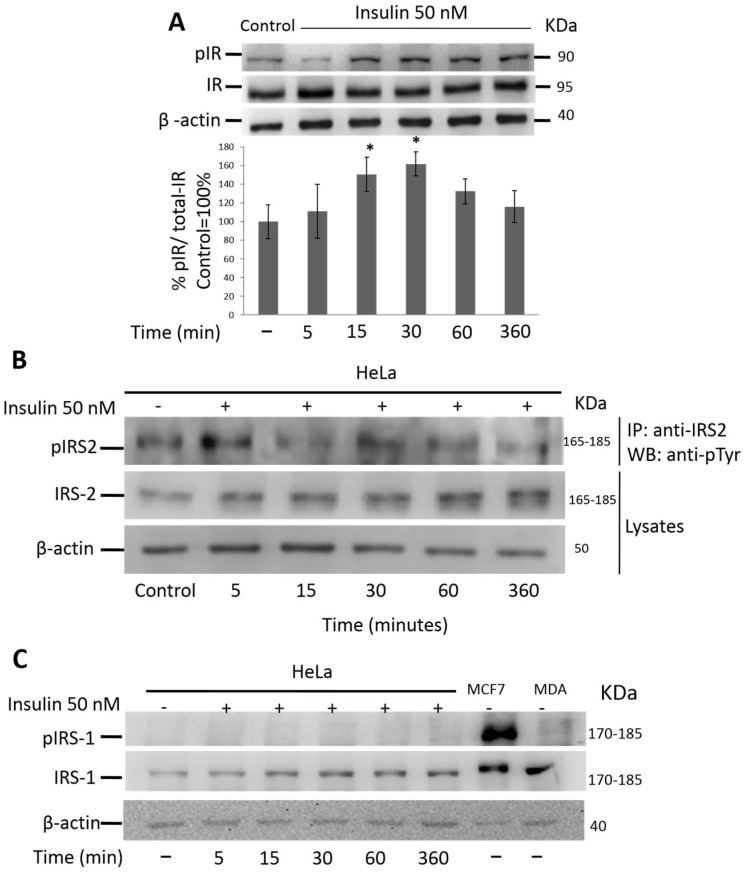
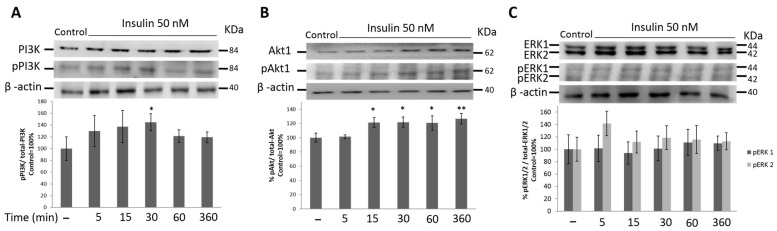
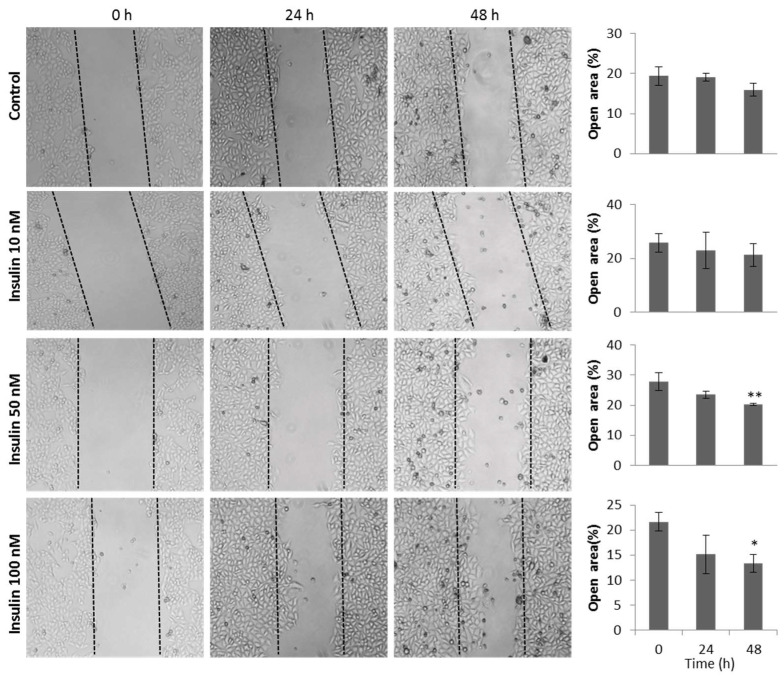
Insulin signaling plays an important role in the development and progression of cancer since it is involved in proliferation and migration processes. It has been shown that the A isoform of the insulin receptor (IR-A) is often overexpressed, and its stimulation induces changes in the expression of the insulin receptor substrates (IRS-1 and IRS-2), which are expressed differently in the different types of cancer. We study the participation of the insulin substrates IRS-1 and IRS-2 in the insulin signaling pathway in response to insulin and their involvement in the proliferation and migration of the cervical cancer cell line. Our results showed that under basal conditions, the IR-A isoform was predominantly expressed. Stimulation of HeLa cells with 50 nM insulin led to the phosphorylation of IR-A, showing a statistically significant increase at 30 min (p ≤ 0.05). Stimulation of HeLa cells with insulin induces PI3K and AKT phosphorylation through the activation of IRS2, but not IRS1. While PI3K reached the highest level at 30 min after treatment (p ≤ 0.05), AKT had the highest levels from 15 min (p ≤ 0.05) and remained constant for 6 h. ERK1 and ERK2 expression was also observed, but only ERK2 was phosphorylated in a time-dependent manner, reaching a maximum peak 5 min after insulin stimulation. Although no effect on cell proliferation was observed, insulin stimulation of HeLa cells markedly promoted cell migration.
Keywords: IRS1; IRS2; PI3K/Akt; cell migration; cervical cancer; insulin receptor.
Conflict of interest statement
The authors state that they have no conflict of interest to declare.
Figures
Similar articles
-
Insulin receptor substrates 1 and 2 but not Shc can activate the insulin receptor independent of insulin and induce proliferation in CHO-IR cells.Exp Cell Res. 2007 Feb 15;313(4):805-15. doi: 10.1016/j.yexcr.2006.11.015. Epub 2006 Dec 5. Exp Cell Res. 2007. PMID: 17222824
-
Continually high insulin levels impair Akt phosphorylation and glucose transport in human myoblasts.Metabolism. 2005 Dec;54(12):1687-93. doi: 10.1016/j.metabol.2005.06.019. Metabolism. 2005. PMID: 16311104
-
Fatty acid-induced insulin resistance: decreased muscle PI3K activation but unchanged Akt phosphorylation.J Clin Endocrinol Metab. 2002 Jan;87(1):226-34. doi: 10.1210/jcem.87.1.8187. J Clin Endocrinol Metab. 2002. PMID: 11788651
-
Insulin Substrate Receptor (IRS) proteins in normal and malignant hematopoiesis.Clinics (Sao Paulo). 2018 Oct 11;73(suppl 1):e566s. doi: 10.6061/clinics/2018/e566s. Clinics (Sao Paulo). 2018. PMID: 30328953 Free PMC article. Review.
-
Role of insulin receptor substance-1 modulating PI3K/Akt insulin signaling pathway in Alzheimer's disease.3 Biotech. 2021 Apr;11(4):179. doi: 10.1007/s13205-021-02738-3. Epub 2021 Mar 20. 3 Biotech. 2021. PMID: 33927970 Free PMC article. Review.
Cited by
-
ULK2 suppresses ovarian cancer cell migration and invasion by elevating IGFBP3.PeerJ. 2024 Jun 28;12:e17628. doi: 10.7717/peerj.17628. eCollection 2024. PeerJ. 2024. PMID: 38952983 Free PMC article.
-
Gingipain from Porphyromonas gingivalis causes insulin resistance by degrading insulin receptors through direct proteolytic effects.Int J Oral Sci. 2024 Aug 1;16(1):53. doi: 10.1038/s41368-024-00313-z. Int J Oral Sci. 2024. PMID: 39085196 Free PMC article.
-
PI3K/AKT/mTOR signaling transduction pathway and targeted therapies in cancer.Mol Cancer. 2023 Aug 18;22(1):138. doi: 10.1186/s12943-023-01827-6. Mol Cancer. 2023. PMID: 37596643 Free PMC article. Review.
-
Molecular Targeting of the Phosphoinositide-3-Protein Kinase (PI3K) Pathway across Various Cancers.Int J Mol Sci. 2024 Feb 6;25(4):1973. doi: 10.3390/ijms25041973. Int J Mol Sci. 2024. PMID: 38396649 Free PMC article. Review.
-
Phytochemical analysis, in-vitro and in-silico study of antiproliferative activity of ethyl acetate fraction of Launaea cornuta (Hochst. ex Oliv. & Hiern) C. Jeffrey against human cervical cancer cell line.Front Pharmacol. 2024 Jun 28;15:1399885. doi: 10.3389/fphar.2024.1399885. eCollection 2024. Front Pharmacol. 2024. PMID: 39005932 Free PMC article.
References
-
- Najjar S. Insulin Action: Molecular Basis of Diabetes. In: Najjar S., editor. eLS. John Wiley & Sons; Hoboken, NJ, USA: 2003. pp. 1–10.
-
- Dearth R.K., Cui X., Kim H.J., Kuiatse I., Lawrence N.A., Zhang X., Divisova J., Britton O.L., Mohsin S., Allred D.C., et al. Mammary tumorigenesis and metastasis caused by overexpression of insulin receptor substrate 1 (IRS-1) or IRS-2. Mol. Cell. Biol. 2006;26:9302–9314. doi: 10.1128/MCB.00260-06. - DOI - PMC - PubMed
Grants and funding
LinkOut - more resources
Full Text Sources
Miscellaneous
