A mitochondrial SCF-FBXL4 ubiquitin E3 ligase complex degrades BNIP3 and NIX to restrain mitophagy and prevent mitochondrial disease
- PMID: 36896912
- PMCID: PMC10308365
- DOI: 10.15252/embj.2022113033
A mitochondrial SCF-FBXL4 ubiquitin E3 ligase complex degrades BNIP3 and NIX to restrain mitophagy and prevent mitochondrial disease
Abstract
Mitophagy is a fundamental quality control mechanism of mitochondria. Its regulatory mechanisms and pathological implications remain poorly understood. Here, via a mitochondria-targeted genetic screen, we found that knockout (KO) of FBXL4, a mitochondrial disease gene, hyperactivates mitophagy at basal conditions. Subsequent counter screen revealed that FBXL4-KO hyperactivates mitophagy via two mitophagy receptors BNIP3 and NIX. We determined that FBXL4 functions as an integral outer-membrane protein that forms an SCF-FBXL4 ubiquitin E3 ligase complex. SCF-FBXL4 ubiquitinates BNIP3 and NIX to target them for degradation. Pathogenic FBXL4 mutations disrupt SCF-FBXL4 assembly and impair substrate degradation. Fbxl4-/- mice exhibit elevated BNIP3 and NIX proteins, hyperactive mitophagy, and perinatal lethality. Importantly, knockout of either Bnip3 or Nix rescues metabolic derangements and viability of the Fbxl4-/- mice. Together, beyond identifying SCF-FBXL4 as a novel mitochondrial ubiquitin E3 ligase restraining basal mitophagy, our results reveal hyperactivated mitophagy as a cause of mitochondrial disease and suggest therapeutic strategies.
Keywords: BNIP3/NIX; FBXL4; mitochondrial disease; mitophagy; ubiquitin-proteasome pathway.
© 2023 The Authors.
Conflict of interest statement
The authors declare that they have no conflict of interest.
Figures
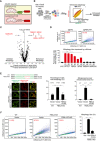
Schematic of the mitoQC reporter.
Schematic of the screen process of mitophagy regulators.
Volcano plot of the screen result. The top hits are highlighted in red.
Verification of screen hits by mtKeima‐based FACS analysis of mitophagy. Upper: representative FACS analysis of mitophagy in HeLa cells expressing sgNTC and sgFBXL4. Bottom: quantitative analysis of mitophagy levels in HeLa cells expressing the indicated sgRNAs. The percentage of cells with high mitophagy level is indicated in red. Two independent sgRNAs were used for each gene. NTC: nontargeting control.
Imaging analysis of mitophagy levels in the indicated HeLa cells. Left: sequencing result of WT and FBXL4‐KO cells and representative mitophagy images, white arrows point to mitolysosomes (FBXL4‐KO cells were not labeled because of the large numbers of mitolysosomes); middle: percentage of cells with mitophagy (mitolysosome‐positive); right: quantification of mitolysosome/mitochondria area. n: number of cells analyzed (middle); number of imaging areas (20–30 cells/area) analyzed (right).
FACS analysis of mitophagy levels in the indicated HeLa cells. Left: representative FACS results; right: quantitative analysis of mitophagy levels.
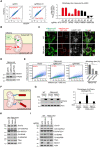
- A
Verification of screen hits by mitoQC‐based FACS analysis of mitophagy. Left: representative FACS analysis; right: quantitative analysis of mitophagy levels in HeLa cells expressing the indicated sgRNAs. Two independent sgRNAs were used for each gene. NTC: nontargeting control.
- B
Schematic of the pH‐dependent dual excitation of mtKeima.
- C
Live cell imaging analysis of mitolysosomes. WT and FBXL4‐KO HeLa cells expressing mtKeima and LAMP1‐YFP were subject to live cell confocal imaging.
- D
Immunoblot analysis of the indicated HeLa cells. FBXL4‐KO HeLa cells were infected with lentiviruses expressing sgNTC, sgBECLIN1, or sgFIP200.
- E
FACS analysis of mitophagy levels in the indicated HeLa cells. The same cells in (D) were analyzed. Left: representative FACS analysis; right: quantitative analysis.
- F
Schematic of a cleavage‐based mitophagy reporter. The linker between mCherry and mitochondrial targeting sequence is sensitive to lysosomal hydrolases.
- G
Immunoblot analysis of reporter cleavage in the indicated HeLa cells. Left: representative immunoblot. Arrow points to the cleaved mCherry. Right: quantitative analysis of mCherry cleavage.
- H, I
Immunoblot analysis of mitochondrial proteins in the indicated HeLa cells.
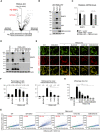
- A
Volcano plot of the screen result of mitophagy regulators in FBXL4‐KO HeLa cells. Mitochondrial outer‐membrane protein MTCH2 and mitophagy receptors BNIP3 and NIX are highlighted in red.
- B
Immunoblot analysis of the indicated HeLa cells. WT and FBXL4‐KO HeLa cells were rescued with vector or FBXL4‐FLAG.
- C
qPCR analysis of BNIP3 and NIX in the indicated HeLa cells. The same cells in (B) were analyzed.
- D
Immunoblot analysis of the indicated HeLa cells. B: BNIP3; N: NIX. Two clones were shown for each double and triple knockout cell.
- E, F
Representative live cell imaging (E) and quantitative analysis (F) of mitophagy levels in the indicated HeLa cells. n: number of cells analyzed (left); number of imaging areas analyzed (right).
- G
Representative FACS analysis of mitophagy levels in the indicated HeLa cells.
- H
FACS‐based quantitative analysis of mitophagy levels in the indicated HeLa cells.

- A, B
Representative FACS analysis (A) and quantitative analysis (B) of mitophagy levels in the indicated HeLa cells. Two independent sgRNAs for MTCH2 were used. Data are mean + SD from three biological replicates. Statistics: two‐tailed unpaired Student's t‐test; ***P < 0.001.
- C
Immunoblot analysis of the indicated HeLa cells. *Nonspecific bands.
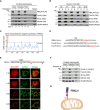
Determination of the submitochondrial localization of FBXL4 by Protease K and trypsin digestion. Mitochondria from HeLa FBXL4‐FLAG stable line were purified and stored as intact mitochondria or treated with hypotonic swelling buffer or lysed with Triton X‐100 buffer. Different mitochondrial preparations were then digested with Protease K or trypsin.
Analysis of the association of FBXL4 with membrane by alkaline carbonate extraction. Purified mitochondria from HeLa FBXL4‐FLAG stable line were treated with alkaline carbonate buffer at the indicated pH and then centrifuged to collect the supernatant and the pellet fractions. S: supernatant; P: pellet.
“DAS” prediction of the transmembrane domain (TMD) of FBXL4. The red box highlights the putative TMD at FBXL4 N terminus.
Analysis of the TMD and the flanking sequences of FBXL4, Tom20, and Tom70. Positively charged residues are highlighted in red; negatively charged residues are highlighted in green. H.s.: Homosapien; R.n.: Rattus norvegicus.
Identification of the mitochondrial targeting sequence of FBXL4. Indicated FBXL4 N‐terminal sequences were fused to RFP and expressed in HeLa cells to analyze their subcellular localization.
Determination of the submitochondrial localization of FBXL4(1–23)‐RFP by Protease K digestion. Experiments were performed similarly as (A).
Schematic of FBXL4 N‐anchored to mitochondrial outer membrane.
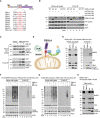
Alignment of F‐box sequences. Critical residues for Skp1 binding are highlighted in red.
Immunoprecipitation analysis of the FBXL4‐Skp1‐Cullin1 (SCF‐FBXL4) complex. HeLa cells were infected with lentiviruses expressing the indicated genes. ∆F: the F‐box deletion mutant of FBXL4‐FLAG; 4A: FBXL4‐4A mutant as shown in (A).
Immunoprecipitation analysis of the FBXL4‐UBXD8‐VCP complex. HeLa cells expressing vector or FBXL4‐FLAG were treated with DMSO or MG132 (20 μM) for 8 h.
Schematic of the SCF‐FBXL4‐UBXD8‐VCP complex at mitochondrial outer membrane.
Immunoprecipitation analysis of the association of FBXL4 with BNIP3 and NIX. FBXL4‐KO HeLa cells were rescued with GFP, FBXL4‐FLAG, or FBXL4(∆F)‐FLAG.
Immunoprecipitation analysis of the ubiquitination of BNIP3. FLAG‐BNIP3 (knockin), FBXL4‐KO, and HA‐ubiquitin (Ub) HeLa cells were rescued with WT or ∆F FBXL4 and treated with DMSO or MG132 (20 μM) for 8 h.
Immunoprecipitation analysis of the ubiquitination of NIX. FLAG‐NIX (knockin), FBXL4‐KO, and HA‐Ub HeLa cells were treated the same as (F).
Immunoblot analysis of the indicated HeLa cells. FBXL4‐KO HeLa cells were rescued with vector, FBXL4‐FLAG, FBXL4(4A)‐FLAG, or FBXL4(∆F)‐FLAG.
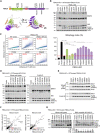
Schematic of FBXL4 domain organization and predicted structure by AlphaFold2.
Immunoblot analysis of the indicated HeLa cells. WT and FBXL4‐KO HeLa cells were rescued with vector, WT or mutant FBXL4‐FLAG.
FACS‐based analysis of mitophagy levels in the indicated HeLa cells. The same HeLa cells in (B) were used. Left: representative FACS analysis; right: quantitative analysis of mitophagy levels. The dashed red line marks the mitophagy level in FBXL4‐KO cells rescued with FBXL4‐FLAG.
Immunoprecipitation analysis of FBXL4‐substrate interaction. FBXL4‐KO HeLa cells were rescued with vector, FBXL4(∆F)‐FLAG or mutant FBXL4(∆F)‐FLAG.
Immunoprecipitation analysis of FBXL4‐Skp1 interaction. FBXL4‐KO HeLa cells were rescued with vector, WT or mutant FBXL4‐FLAG.
Analysis of the mass spectrometry results of immunoprecipitation with WT or mutant FBXL4‐FLAG. FBXL4‐KO HeLa cells expressing WT, V140A or I551N FBXL4‐FLAG were subject to DSP crosslinking and anti‐FLAG immunoprecipitation. The immunoprecipitates were analyzed by mass spectrometry. The Mascot score of immunoprecipitated proteins was plotted. Because of space limitation, six common proteins with Mascot score between 5,000 and 20,000 were removed. Cullin1, which has decreased interaction with both FBXL4 mutants, is highlighted in red.
Immunoprecipitation analysis of the integrity of the SCF‐FBXL4 complex. Upper: FBXL4‐KO HeLa cells expressing vector, WT or mutant FBXL4‐FLAG were crosslinked with DSP and subject to anti‐FLAG immunoprecipitation; lower: quantification of the ratio of Cullin1/FLAG band intensities.

Viability of the indicated mice. n: number of mice analyzed.
Immunoblot analysis of organs from the indicated mice at P0 of age. Elevated BNIP3 and NIX levels are highlighted by red boxes; reduced mitochondrial proteins are highlighted by blue boxes. Three mice for each genotype were analyzed. Protein samples from HeLa cells treated with DMSO or Actinomycin D (ActD) were used as positive control for PARP cleavage.
Schematic of AAV‐based gene knockout and mitophagy examination. Upper: schematic of the bicistronic AAV(mtKeima)‐sgRNA vector that simultaneously expresses mtKeima and sgRNA; Middle: schematic of delivering AAV9(mtKeima)‐sgNTC or AAV9(mtKeima)‐sgFBXL4 to the Cas9‐knockin mice to generate the control mice and hepatic Fbxl4‐KO mice; below: immunoblot analysis of the indicated mouse liver at 45 days after AAV delivery. Three mice for each genotype were analyzed. Data are mean + SD from three biological replicates. Statistics: two‐tailed unpaired Student's t‐test; *P < 0.05.
Live cell confocal imaging of mitophagy level in the indicated mouse liver at 45 days after AAV delivery. Left: representative images. The dashed line indicates cell boundary. Right: quantitative analysis of mitophagy levels in hepatocytes. n: number of cells analyzed. Data are mean ± SD. Statistics: two‐tailed unpaired Student's t‐test; ***P < 0.001.
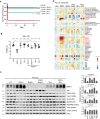
Viability of the indicated mice. n: number of mice analyzed.
Body weight of the indicated male mice at P30. Data are mean ± SD. Statistics: one‐way ANOVA with the Tukey–Kramer test; *P < 0.05; ***P < 0.001.
Immunoblot analysis of liver samples from the indicated mice at P0 of age. Left: immunoblot analysis, three mice for each genotype were analyzed; right: quantification of the ratio of mitochondrial protein/actin band intensities. Data are mean + SD from three biological replicates. Statistics: two‐tailed unpaired Student's t‐test; *P < 0.05; **P < 0.01; ***P < 0.001; ns, not significant.
Metabolite analysis of liver samples from the indicated mice at P0 of age. Three to five mice for each genotype were analyzed.

- A
Immunoblot analysis of the indicated HeLa cells. WT and FBXL4‐KO HeLa cells were infected with lentivirus expressing TO‐DN‐Cullin1. Cells were then treated with doxycycline (Dox, 2 μg/ml) for the indicated time.
- B
qPCR analysis of the indicated HeLa cells. The same cells in (A) were used. Dox (2 μg/ml) was treated for 12 h.
- C, D
Representative FACS analysis (C) and quantitative analysis (D) of mitophagy levels in the indicated HeLa cells. WT and FBXL4‐KO HeLa cells were infected with lentivirus expressing TO‐DN‐Cullin1. Cells were then treated with Dox (2 μg/ml) for 48 h.

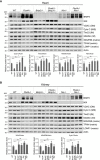
- A, B
Immunoblot analysis of heart (A) and kidney (B) from the indicated mice at P0 of age. Three mice for each genotype were analyzed. Data are mean + SD from three biological replicates (A, B). Statistics: two‐tailed unpaired Student's t‐test; *P < 0.05; **P < 0.01; ***P < 0.001; ns, not significant.
Comment in
-
Eating your mitochondria-when too much of a good thing turns bad.EMBO J. 2023 Jul 3;42(13):e114542. doi: 10.15252/embj.2023114542. Epub 2023 Jun 5. EMBO J. 2023. PMID: 37272260 Free PMC article.
Similar articles
-
PPTC7 antagonizes mitophagy by promoting BNIP3 and NIX degradation via SCFFBXL4.EMBO Rep. 2024 Aug;25(8):3324-3347. doi: 10.1038/s44319-024-00181-y. Epub 2024 Jul 11. EMBO Rep. 2024. PMID: 38992176 Free PMC article.
-
FBXL4 suppresses mitophagy by restricting the accumulation of NIX and BNIP3 mitophagy receptors.EMBO J. 2023 Jul 3;42(13):e112767. doi: 10.15252/embj.2022112767. Epub 2023 May 10. EMBO J. 2023. PMID: 37161784 Free PMC article.
-
FBXL4 ubiquitin ligase deficiency promotes mitophagy by elevating NIX levels.EMBO J. 2023 Jul 3;42(13):e112799. doi: 10.15252/embj.2022112799. Epub 2023 Apr 27. EMBO J. 2023. PMID: 37102372 Free PMC article.
-
Coordinating BNIP3/NIX-mediated mitophagy in space and time.Biochem Soc Trans. 2024 Oct 30;52(5):1969-1979. doi: 10.1042/BST20221364. Biochem Soc Trans. 2024. PMID: 39377319 Free PMC article. Review.
-
N-degron-mediated degradation and regulation of mitochondrial PINK1 kinase.Curr Genet. 2020 Aug;66(4):693-701. doi: 10.1007/s00294-020-01062-2. Epub 2020 Mar 10. Curr Genet. 2020. PMID: 32157382 Review.
Cited by
-
PPTC7 antagonizes mitophagy by promoting BNIP3 and NIX degradation via SCFFBXL4.EMBO Rep. 2024 Aug;25(8):3324-3347. doi: 10.1038/s44319-024-00181-y. Epub 2024 Jul 11. EMBO Rep. 2024. PMID: 38992176 Free PMC article.
-
PPTC7 maintains mitochondrial protein content by suppressing receptor-mediated mitophagy.Nat Commun. 2023 Oct 13;14(1):6431. doi: 10.1038/s41467-023-42069-w. Nat Commun. 2023. PMID: 37833277 Free PMC article.
-
Novel Development of Magnetic Resonance Imaging to Quantify the Structural Anatomic Growth of Diverse Organs in Adult and Mutant Zebrafish.Zebrafish. 2024 Feb;21(1):28-38. doi: 10.1089/zeb.2023.0018. Epub 2023 Aug 21. Zebrafish. 2024. PMID: 37603286
-
Dual-localized PPTC7 limits mitophagy through proximal and dynamic interactions with BNIP3 and NIX.Life Sci Alliance. 2024 Jul 11;7(9):e202402765. doi: 10.26508/lsa.202402765. Print 2024 Sep. Life Sci Alliance. 2024. PMID: 38991726 Free PMC article.
-
Mitophagy in hypertension-mediated organ damage.Front Cardiovasc Med. 2024 Jan 4;10:1309863. doi: 10.3389/fcvm.2023.1309863. eCollection 2023. Front Cardiovasc Med. 2024. PMID: 38239871 Free PMC article. Review.
References
-
- Andreux PA, Blanco‐Bose W, Ryu D, Burdet F, Ibberson M, Aebischer P, Auwerx J, Singh A, Rinsch C (2019) The mitophagy activator urolithin A is safe and induces a molecular signature of improved mitochondrial and cellular health in humans. Nat Metab 1: 595–603 - PubMed
-
- Bai C, Sen P, Hofmann K, Ma L, Goebl M, Harper JW, Elledge SJ (1996) SKP1 connects cell cycle regulators to the ubiquitin proteolysis machinery through a novel motif, the F‐box. Cell 86: 263–274 - PubMed
-
- Barøy T, Pedurupillay CRJ, Bliksrud YT, Rasmussen M, Holmgren A, Vigeland MD, Hughes T, Brink M, Rodenburg R, Nedregaard B et al (2016) A novel mutation in FBXL4 in a Norwegian child with encephalomyopathic mitochondrial DNA depletion syndrome 13. Eur J Med Genet 59: 342–346 - PubMed
Publication types
MeSH terms
Substances
LinkOut - more resources
Full Text Sources
Medical
Molecular Biology Databases
Research Materials

