

Mask mandates save lives
- PMID: 36854572
- PMCID: PMC9968482
- DOI: 10.1016/j.jhealeco.2022.102721
Mask mandates save lives
Abstract
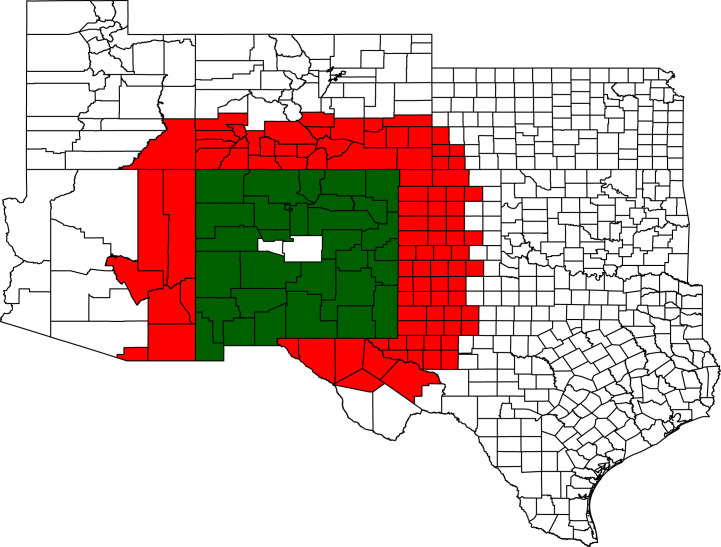
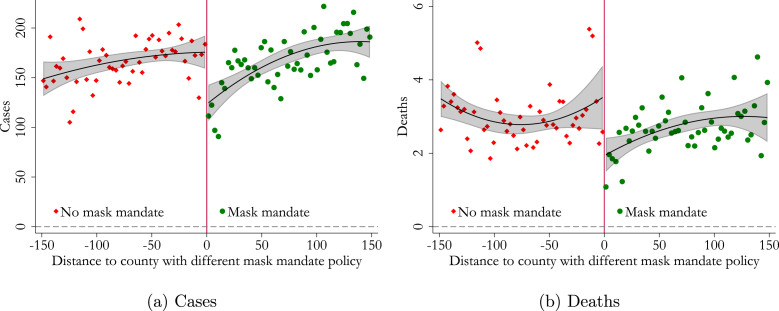
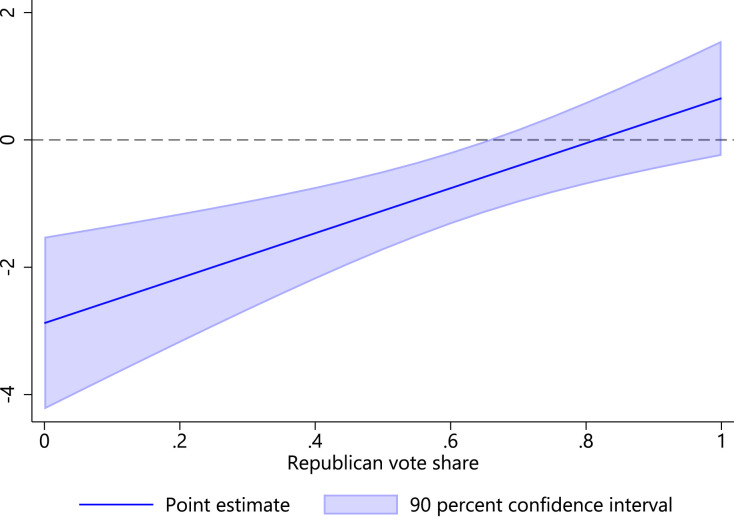
We quantify the effect of statewide mask mandates in the United States in 2020. Our regression discontinuity design exploits county-level variation in COVID-19 outcomes across the border between states with and without mandates. State mask mandates reduced new weekly COVID-19 cases, hospital admissions, and deaths by 55, 11, and 0.7 per 100,000 inhabitants on average. The effect depends on political leaning with larger effects in Democratic-leaning counties. Our results imply that statewide mandates saved 87,000 lives through December 19, 2020, while a nationwide mandate could have saved 57,000 additional lives. This suggests that mask mandates can help counter pandemics, particularly if widely accepted.
Keywords: COVID-19; Face masks; Public health measures; Regression discontinuity.
Copyright © 2023 International Monetary fund. Published by Elsevier B.V. All rights reserved.
Figures

Similar articles
-
The Differential Impact of Reopening States With and Without COVID-19 Face Mask Mandates on County-Level Consumer Spending.Public Health Rep. 2022 Sep-Oct;137(5):1000-1006. doi: 10.1177/00333549221103816. Epub 2022 Jul 6. Public Health Rep. 2022. PMID: 35792601 Free PMC article.
-
The Association Between State-Issued Mask Mandates and County COVID-19 Hospitalization Rates.J Public Health Manag Pract. 2022 Nov-Dec 01;28(6):712-719. doi: 10.1097/PHH.0000000000001602. J Public Health Manag Pract. 2022. PMID: 36194816 Free PMC article.
-
Evaluating the effectiveness of countywide mask mandates at reducing SARS-CoV-2 infection in the United States.J Osteopath Med. 2022 Jan 27;122(4):211-215. doi: 10.1515/jom-2021-0214. J Osteopath Med. 2022. PMID: 35086185
-
Community Use Of Face Masks And COVID-19: Evidence From A Natural Experiment Of State Mandates In The US.Health Aff (Millwood). 2020 Aug;39(8):1419-1425. doi: 10.1377/hlthaff.2020.00818. Epub 2020 Jun 16. Health Aff (Millwood). 2020. PMID: 32543923 Review.
-
The Burden of Coronavirus Disease 2019-Related Cases, Hospitalizations, and Mortality Based on Vaccination Status and Mandated Mask Use: Statewide Data From Wisconsin and Narrative Review of the Literature.Anesth Analg. 2022 Mar 1;134(3):524-531. doi: 10.1213/ANE.0000000000005858. Anesth Analg. 2022. PMID: 35180169 Review.
Cited by
-
Epidemiological impact of revoking mask-wearing recommendation on COVID-19 transmission in Tokyo, Japan.Infect Dis Model. 2024 Aug 10;9(4):1289-1300. doi: 10.1016/j.idm.2024.08.002. eCollection 2024 Dec. Infect Dis Model. 2024. PMID: 39252817 Free PMC article.
-
Estimated public health impact of concurrent mask mandate and vaccinate-or-test requirement in Illinois, October to December 2021.BMC Public Health. 2024 Apr 12;24(1):1013. doi: 10.1186/s12889-024-18203-8. BMC Public Health. 2024. PMID: 38609903 Free PMC article.
-
The Lancet Commission on lessons for the future from the COVID-19 pandemic.Lancet. 2022 Oct 8;400(10359):1224-1280. doi: 10.1016/S0140-6736(22)01585-9. Epub 2022 Sep 14. Lancet. 2022. PMID: 36115368 Free PMC article. Review. No abstract available.
References
-
- Abaluck Jason, Kwong Laura H, Styczynski Ashley, Haque Ashraful, Kabir Md Alamgir, Bates-Jefferys Ellen, Crawford Emily, Benjamin-Chung Jade, Benhachmi Salim, Raihan Shabib, et al. National Bureau of Economic Research; 2021. Normalizing Community Mask-Wearing: A Cluster Randomized Trial in Bangladesh: Tech. Rep.
-
- Calonico Sebastian, Cattaneo Matias D., Farrell Max H., Titiunik Rocío. Rdrobust: Software for regression-discontinuity designs. Stata J. 2017;17(2):372–404.
-
- Calonico Sebastian, Cattaneo Matias D, Farrell Max H, Titiunik Rocio. Regression discontinuity designs using covariates. Rev. Econ. Stat. 2019;101(3):442–451.
-
- Dieterle Steven, Bartalotti Otávio, Brummet Quentin. Revisiting the effects of unemployment insurance extensions on unemployment: A measurement-error-corrected regression discontinuity approach. Am. Econ. J.: Econ. Policy. 2020;12(2):84–114.
Further Reading
-
- Eichenbaum Martin S., Rebelo Sergio, Trabandt Mathias. The macroeconomics of epidemics. Rev. Financ. Stud. 2021;34(11):5149–5187.
-
- Judson Ruth A., Owen Ann L. Estimating dynamic panel data models: a guide for macroeconomists. Econom. Lett. 1999;65(1):9–15.
-
- Dube Arindrajit, Lester T. William, Reich Michael. Minimum wage effects across state borders: Estimates using contiguous counties. Rev. Econ. Stat. 2010;92(4):945–964.
-
- Butts Kyle. Geographic difference-in-discontinuities. Appl. Econ. Lett. 2021:1–5.
-
- Grembi Veronica, Nannicini Tommaso, Troiano Ugo. Do fiscal rules matter? Am. Econ. J.: Appl. Econ. 2016:1–30.
MeSH terms
LinkOut - more resources
Full Text Sources
Medical
