. 2023 Feb 27;15(1):29.
doi: 10.1186/s13148-023-01446-4.

Regulatory networks driving expression of genes critical for glioblastoma are controlled by the transcription factor c-Jun and the pre-existing epigenetic modifications

Affiliations

Regulatory networks driving expression of genes critical for glioblastoma are controlled by the transcription factor c-Jun and the pre-existing epigenetic modifications

Adria-Jaume Roura et al. Clin Epigenetics. .

Abstract

Background: Glioblastoma (GBM, WHO grade IV) is an aggressive, primary brain tumor. Despite extensive tumor resection followed by radio- and chemotherapy, life expectancy of GBM patients did not improve over decades. Several studies reported transcription deregulation in GBMs, but regulatory mechanisms driving overexpression of GBM-specific genes remain largely unknown. Transcription in open chromatin regions is directed by transcription factors (TFs) that bind to specific motifs, recruit co-activators/repressors and the transcriptional machinery. Identification of GBM-related TFs-gene regulatory networks may reveal new and targetable mechanisms of gliomagenesis.

Results: We predicted TFs-regulated networks in GBMs in silico and intersected them with putative TF binding sites identified in the accessible chromatin in human glioma cells and GBM patient samples. The Cancer Genome Atlas and Glioma Atlas datasets (DNA methylation, H3K27 acetylation, transcriptomic profiles) were explored to elucidate TFs-gene regulatory networks and effects of the epigenetic background. In contrast to the majority of tumors, c-Jun expression was higher in GBMs than in normal brain and c-Jun binding sites were found in multiple genes overexpressed in GBMs, including VIM, FOSL2 or UPP1. Binding of c-Jun to the VIM gene promoter was stronger in GBM-derived cells than in cells derived from benign glioma as evidenced by gel shift and supershift assays. Regulatory regions of the majority of c-Jun targets have distinct DNA methylation patterns in GBMs as compared to benign gliomas, suggesting the contribution of DNA methylation to the c-Jun-dependent gene expression.

Conclusions: GBM-specific TFs-gene networks identified in GBMs differ from regulatory pathways attributed to benign brain tumors and imply a decisive role of c-Jun in controlling genes that drive glioma growth and invasion as well as a modulatory role of DNA methylation.

Keywords: Chromatin accessibility; DNA binding; DNA methylation; Gene expression; Glioblastoma; Transcription factors; Transcriptional deregulation.


Conflict of interest statement

The authors declare that they have no competing interests.

Figures
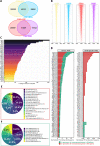
Fig. 1
Fig. 1
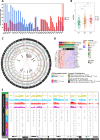
Global characterization of transcription factor binding sites in open chromatin regions in glioblastoma cell lines and glioblastoma specimens. A Total number of predicted transcription factor binding sites (TFBS) in open-chromatin regions using ATAC-seq fragments and position-weight matrices (PWMs) motifs in established human glioma cell lines LN18 and LN229 and in glioblastoma samples. In silico TFBS predictions for both cell lines were selected for downstream analysis. B Profile heatmap of total ATAC-seq peaks identified around transcription start sites (TSS) in cell lines and GBM specimens. C Top 50 occurrences of TFBS (identified with HOmo sapiens COmprehensive MOdel COllection - HOCOMOCO v11) in gene promoters (TSS ± 1.5 kb) in LN18 and LN229 glioma cell lines; the last letter (A–D) represents the quality, where A represents motifs with the highest confidence and the number defines the motif rank, with zero indicating the primary model (primary binding preferences). D Prediction of “generic” (left-panel) and “grade-specific” (right-panel) TFBS  in the promoters (TSS ± 1.5 kb) of dysregulated genes in gliomas of grade IV and II. The abscissa represents a normalization factor for TFBS occurrences in which the total number of differentially expressed genes in a given glioma grade is taken into account. E, F Transcription factor (TF) families (HOCOMOCOv11) with putative binding sites in the promoters of overexpressed genes in IV glioma (E) and grade II glioma (F). Unique TF families found in either group are highlighted with asterisks
Fig. 2
Fig. 2
c-Jun dysregulation in the Pan-cancer atlas and the TCGA glioma dataset and identification of genomic targets in open-chromatin regions. A JUN mRNA expression profile ordered by expression differences between tumor samples (TCGA) and paired normal tissues (TCGA normal + GTEx normal). The differential expression was calculated using one-way ANOVA (Tumors or Normal, *p value < 0.05). B c-Jun mRNA expression across glioma grades using the TCGA data. The differential expression was calculated using Wilcoxon rank-sum statistical test (*p value < 0.05, **p value < 0.01 and ***p value < 0.001). C Chromatin accessibility profiling (1st and 2nd tracks) and TFBS predictions in or outside promoters (3rd track). The 4th track depicts TFBS predictions in overexpressed genes in certain glioma grades, and red lines connect JUN gene location (chr1:58,776,845–58,784,048) to each of the c-Jun-controlled genes in GBM. D Unsupervised hierarchical clustering heatmap of c-Jun gene targets in grade II and grade IV gliomas from the TCGA dataset (248 grade II gliomas; 160 grade IV gliomas). E Landscape of c-Jun binding prediction in the cis-regulatory regions of selected overexpressed GIV genes, in the studied cell lines and GBM patient samples. Location of the identified c-Jun motif is shown in green. The ATAC-seq signal and MACS2 broad peaks for each cell line and GBM patient sample are shown separately. Exons (rectangles) and introns (lines) are depicted as well as the gene orientation (arrows) in the UCSC gene composite track
Fig. 3
Fig. 3
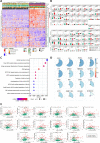
Transcription factor expression differs across glioma grades and c-Jun positively correlates with its target genes. A Unsupervised clustering of genes coding for grade-specific transcription factors. The TCGA patients (grade II: 248 patients, grade IV: 160 patients) and genes were clustered using Ward's minimum variance method. Patients who lacked clinical information on Histology, Grade, Age or Gender are illustrated in grey. B Normalized transcription factor expression in grade II and grade IV glioma (TCGA RNA-seq data) and in established glioma cell lines LN18 and LN229 (CL; 2 replicates of each shown). TFs were grouped based on dendrogram clusters depicted in A. The adjusted p-values for statistical differences between glioma grades are displayed and the Wilcoxon rank-sum statistical test and Benjamini–Hochberg (BH) correction were used. Transcription factors with a logarithmic expression of zero or nearly zero in glioma patients have no statistical validity. C Reactome analysis of genes having grade IV-specific transcription factor motifs in their promoters. BH procedure was used to correct for multiple testing. D Correlation of mRNA levels between JUN mRNA and its targets (TCGA grade II and grade IV patients). Genes are ordered based on obtained Pearson’s correlation, ranging from blue (coefficient = 1) to red (coefficient =  − 1) and associated p values were corrected by multiple testing (*padj < 0.05, **padj < 0.01 and ***padj < 0.001). E Pearson's correlation coefficient of c-Jun reverse phase protein array (phosphorylated c-Jun pS73) against mRNA of c-Jun target genes. The adjusted BH p-values for statistically significant correlations are displayed. The data points are color-coded according to the glioma's grade, along with their regression line
Fig. 4
Fig. 4
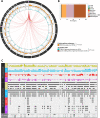
The integration of the glioma enhancer atlas in the context of c-Jun and related factors. A The density of the ChIPseq H3K27ac peak from the predicted  glioma enhancer atlas (1st track) identified by Stepniak et al. TFBS motif predictions in LN18 and LN229 glioma cell lines inside enhancers and c-Jun binding sites are displayed separately (2nd track). Each putative JUN motif found in glioma enhancers is linked to JUN gene position (chr1:58,776,845–58,784,048). B Feature distribution of glioma enhancer (H3K27ac peaks). C Integration of glioma enhancers and chromatin openness in glioma cell lines and GBM specimens with TFBS for c-Jun and other bZIP proteins. Exons (rectangles) and introns (lines) are depicted as well as the gene orientation (arrows) in the UCSC gene composite track
Fig. 5
Fig. 5
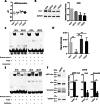
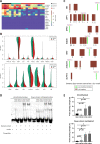
c-Jun transcription factor binds to the VIM promoter in human astrocytes and glioma cell lines. c-Jun levels in normal human astrocytes (NHA), low-grade glioma patient-derived cell cultures (WG12) and established glioma cell lines (LN18, LN229). A c-JUN mRNA expression was evaluated by RT-qPCR. Data were normalized to the expression of GAPDH mRNA determined in the same sample, n = 4. B Protein levels of c-Jun analyzed by Western blot with the densitometry of immunoblots. Data were normalized to the levels of GAPDH in the same sample, n = 3, mean± SD. The densitometry is presented as relative values to NHA set as 1. P values were calculated using GraphPad software and considered significant when *p < 0.05 (One-way ANOVA). C DNA-binding activity of double-stranded DNA from the Vimentin promoter site. EMSA was performed using the LightShift Chemiluminescent EMSA Kit. Nuclear extracts were isolated from NHA, WG12, LN18 and LN229. Unlabeled competitor probes were added to lanes 3, 5, 7, and 9, n = 3. D Densitometry analysis of EMSA presented as signal intensity mean ± SD. One-way ANOVA with Dunnett’s post hoc test revealed significant differences at **p < 0.01,  n = 3.  E Supershift EMSA assay for measuring c-Jun transcription factor binding to DNA from the Vimentin promoter. Antibody against c-Jun was added to samples in lanes 3, 5, 7, and 9 to verify if the observed shift of the probe band in the gel was dependent on c-Jun binding,  n = 3. F Impact of inhibition of c-Jun phosphorylation on the level of Vimentin. LN18 cells were treated for 3 h with SP600125 (SP), an inhibitor of JNK kinases. Protein levels were analyzed by Western blot with the densitometry analysis. Data are presented as relative values to control (cells treated with DMSO, set as 1). Data were normalized to the levels of GAPDH in the same sample. P values were calculated using GraphPad software and considered significant when *p < 0.05 (t-test), n = 3, ± SD
Fig. 6
Fig. 6
DNA methylation differs in cis-regulatory regions in c-Jun gene targets. A Heatmap of hierarchical clustering analysis showing median DNA methylation of promoters of c-Jun target genes (2 kb upstream and 500 bp downstream relative to TSS) in glioma samples. The following labels were used: IDHmut (4 GII/GIII tumors), GII/GIII (4 only GII/GIII-IDHwt tumors) and GIV (10 IDHwt tumors). DNA methylation levels showed as beta values, with 0.0–0.2 representing hypomethylated cytosines and 0.6–1.0 representing hypermethylated cytosines. B Differences in beta values distribution in gene promoters with the predicted c-Jun TFBS in GII/GIII-IDHwt versus GIV glioma samples that are statistically non-significant (upper panel) and statistically significant (bottom panel). C Distance of c-Jun motif to the beginning of differentially methylated C-rich regions between high- and low-grade gliomas. Green boxes represent a c-Jun predicted binding site, while brown boxes show each C-rich region that was found significantly differently methylated between low- and high-grade glioma samples (Chi-squared test at significance level adjusted p < 0.05). D Competitive electrophoretic mobility assay (EMSA) was used for measuring binding affinity of nuclear extracts from tumor derived cell lines and NHA, to the methylated and unmethylated double-stranded DNA from the UPP1 promoter site. Binding of proteins from NHA, WG12, LN18, and LN229 to the methylated and unmethylated probes was evaluated. Lane 1, 6: unlabeled probes; lanes 2–5 and 7–10: protein binding. E Probe binding strength in EMSA densitometry analysis is expressed as a percentage of the overall variation across all cell lines. One-way ANOVA with Fisher's LSD post hoc tests revealed significant differences at *p < 0.05 and **p < 0.01; Hedge's effect size (g) indicates the strength of the difference of the binding between the studied cell lines (medium effects g ≈ 0.5; large effects g ≈ 0.8), n = 3 ± SD

Similar articles

Cited by

References

    1. Louis DN, Perry A, Reifenberger G, von Deimling A, Figarella-Branger D, Cavenee WK, et al. The 2016 World Health Organization classification of tumors of the central nervous system: a summary. Acta Neuropathol. 2016;131:803–820. doi: 10.1007/s00401-016-1545-1. - DOI - PubMed
    1. Molinaro AM, Taylor JW, Wiencke JK, Wrensch MR. Genetic and molecular epidemiology of adult diffuse glioma. Nat Rev Neurol. 2019;15:405–417. doi: 10.1038/s41582-019-0220-2. - DOI - PMC - PubMed
    1. Lee TI, Young RA. Transcriptional regulation and its misregulation in disease. Cell. 2013;152:1237–1251. doi: 10.1016/j.cell.2013.02.014. - DOI - PMC - PubMed
    1. Stępniak K, Machnicka MA, Mieczkowski J, Macioszek A, Wojtaś B, Gielniewski B, et al. Mapping chromatin accessibility and active regulatory elements reveals pathological mechanisms in human gliomas. Nat Commun. 2021;12(1):3621. doi: 10.1038/s41467-021-23922-2. - DOI - PMC - PubMed
    1. Suter DM. Transcription factors and DNA play hide and seek. Trends Cell Biol. 2020;30:491–500. doi: 10.1016/j.tcb.2020.03.003. - DOI - PubMed

Publication types