. 2023 Jun;39(6):929-946.
doi: 10.1007/s12264-022-00995-7. Epub 2022 Dec 15.

REEP1 Preserves Motor Function in SOD1G93A Mice by Improving Mitochondrial Function via Interaction with NDUFA4

Affiliations

REEP1 Preserves Motor Function in SOD1G93A Mice by Improving Mitochondrial Function via Interaction with NDUFA4

Siyue Qin et al. Neurosci Bull. 2023 Jun.

Abstract

A decline in the activities of oxidative phosphorylation (OXPHOS) complexes has been consistently reported in amyotrophic lateral sclerosis (ALS) patients and animal models of ALS, although the underlying molecular mechanisms are still elusive. Here, we report that receptor expression enhancing protein 1 (REEP1) acts as an important regulator of complex IV assembly, which is pivotal to preserving motor neurons in SOD1G93A mice. We found the expression of REEP1 was greatly reduced in transgenic SOD1G93A mice with ALS. Moreover, forced expression of REEP1 in the spinal cord extended the lifespan, decelerated symptom progression, and improved the motor performance of SOD1G93A mice. The neuromuscular synaptic loss, gliosis, and even motor neuron loss in SOD1G93A mice were alleviated by increased REEP1 through augmentation of mitochondrial function. Mechanistically, REEP1 associates with NDUFA4, and plays an important role in preserving the integrity of mitochondrial complex IV. Our findings offer insights into the pathogenic mechanism of REEP1 deficiency in neurodegenerative diseases and suggest a new therapeutic target for ALS.

Keywords: Amyotrophic lateral sclerosis; Complex IV assembly; Mitochondria; NDUFA4; REEP1.


Conflict of interest statement

The authors declare that there are no conflicts of interest.

Figures

Fig. 1
Fig. 1
Reduction of REEP1 in the spinal cord of G93A mice. A Representative immunoblots and quantification of REEP expression in the spinal cord of NTG (non-transgenic) and G93A mice (n = 4 mice per group). B Representative immunohistochemical staining of REEP1 in the lumbar spinal cord of NTG (n = 30 neurons from 3 mice) and G93A mice (n = 35 neurons from 3 mice). Scale bars, 50 μm. Data are the mean ± SEM. *P <0.05, ****P <0.0001, two-tailed Student’s t-test.
Fig. 2
Fig. 2
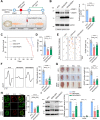
REEP1 upregulation improves the motor performance of G93A mice. A Schematic of REEP1 AAV injection and behavioral test timeline. AAV serotype 1 encoding human REEP1 under the neuron-specific promoter eSYN (AAV1-hREEP1-Flag) was injected into the spinal cord at the first lumbar segment (L1) of G93A mice. B Representative immunoblots and quantification of REEP1 levels in the lumbar spinal cord of NTG, G93A/GFP, and G93A/REEP1 mice (n = 4 mice per group). C Kaplan-Meier survival curves of NTG (n = 16), G93A/GFP (n = 10), and G93A/REEP1 mice (n = 11). D Hindlimb grip strength of NTG (n = 17), G93A/GFP (n = 9), and G93A/REEP1 mice (n =12) at 100 days old. E Footprint performance and stride length quantification of NTG (n = 11), G93A/GFP (n = 7), and G93A/REEP1 mice (n = 7). The arrow shows the direction of walking. F Representative images and quantification of CMAPs evoked by supramaximal stimulation of the sciatic nerve in NTG (n = 12), G93A/GFP (n = 8), and G93A/REEP1 mice (n = 9). G Representative images of skeletal muscles and quantification of gastrocnemius muscle weight of NTG (n = 16), G93A/GFP (n = 8), and G93A/REEP1 mice (n = 8). Scale bar, 0.5 cm. H Representative images and quantification of NMJ innervation of NTG, G93A/GFP, and G93A/REEP1 mice (n = 4 mice per group). Green, acetylcholine receptors (AchR) stained by α-bungarotoxin for motor endplates; red, SV2 for NMJs. Scale bars, 10 μm. I Representative immunoblots and quantification of Agrin, Wnt3a, and MuSK in gastrocnemius muscle of NTG, G93A/GFP, and G93A/REEP1 mice (n = 5 mice per group). Data are the mean ± SEM. *P <0.05, **P <0.01, ***P <0.001, ****P <0.0001, one-way ANOVA followed by Tukey’s multiple comparisons test (B, D, E–I).
Fig. 3
Fig. 3
REEP1 augmentation prevents neuronal loss and gliosis in G93A mice. A Representative images and quantification of Nissl staining in the spinal cord of NTG (n = 10), G93A/GFP (n = 7), and G93A/REEP1 mice (n = 7). Scale bar, 100 μm. B Representative images and quantification of immunofluorescence staining of Chat in the spinal cord of NTG (n = 6), G93A/GFP (n = 6), and G93A/REEP1 mice (n = 9). Scale bars, 200 μm. C Representative images and quantification of immunofluorescence staining of GFAP in the spinal cord of NTG (n = 6), G93A/GFP (n = 10), and G93A/REEP1 mice (n = 9). Scale bars, 200 μm. D Representative images and quantification of immunofluorescence staining of Iba1 in the spinal cord of NTG (n = 6), G93A/GFP (n = 8), and G93A/REEP1 mice (n = 9). Scale bars, 200 μm. Data are the mean ± SEM. *P <0.05, ***P <0.001, ****P <0.0001, one-way ANOVA followed by Tukey’s multiple comparisons test.
Fig. 4
Fig. 4
Loss of REEP1 impairs mitochondrial function. A Schematic of CRISPR/Cas9 genome-editing of the REEP1 gene in Lenti-X 293T cells to obtain REEP1-KO cells validated by western blot and DNA sequencing analysis. GAPDH was used as the loading control. B Representative images and quantification of aggregated mitochondria in WT (n = 191 cells from 3 experiments) and REEP1-KO cells (n = 178 cells from 3 experiments). Mitochondria are stained with TOM20. DAPI to visualize nuclei. Scale bar, 20 μm. C Quantification of mitochondrial membrane potential staining by TMRM in WT (n = 101 cells from three experiments) and REEP1KO cells (n = 111 cells from three experiments). Scale bar, 20 μm. D Quantification of ATP levels in WT and REEP1-KO cells (n = 4 replicates). E Representative immunoblots and quantification of mitochondrial OXPHOS assembly in WT and REEP1-KO cells (n = 6 replicates). F Quantification of mitochondrial CIV activity in WT and REEP1-KO cells (n = 4 replicates). G Representative immunoblots and quantification of mitochondrial OXPHOS assembly in 120-day-old NTG (n = 4) and G93A mice (n = 5). H Growth curves for WT and REEP1KO cells over 72 h. Data are the mean ± SEM. *P <0.05, **P <0.01, ****P <0.0001, two-tailed Student’s t-test (B–G) and two-way ANOVA followed by Bonferroni multiple comparisons test (H).
Fig. 5
Fig. 5
REEP1 interacts with NDUFA4. A Representative immunoblots of REEP1 and markers for sub-mitochondrial fractions from Lenti-X 293T cells: TOM20 for the outer mitochondrial membrane, Cyto C for the inner membrane space of mitochondria, COXIV for the inner mitochondrial membrane, and HSP60 for the mitochondrial matrix. B Gene Ontology enrichment analysis of unique interactors of REEP1 according to categories based on biological process. C Representative immunoblots of co-immunoprecipitation between transfected REEP1-Strep and NDUFA4-Flag in Lenti-X 293T cells. D Schematic of REEP1 deletion mutants used for mapping the binding site for NDUFA4. E, F Representative immunoblots of co-immunoprecitation between transfected exgenously-expressed NDUFA4-GFP and REEP1 WT/REEP1Δ101–110.
Fig. 6
Fig. 6
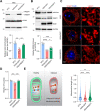
REEP1 regulates CIV assembly through interaction with NDUFA4. A Representative immunoblots of REEP1 in the ER and mitochondrial fractions of indicated cells. Calnexin and COXIV were used as ER and mitochondrial markers, respectively. Overexpressed REEP1 WT and REEP1∆101–110 carrying Strep-tag. B Representative images and quantification of aggregated mitochondria in WT (n = 192 cells from 3 experiments), REEP1KO (n = 210 cells from 3 experiments), REEP1KO+REEP1 (n = 218 cells from 3 experiments), and REEP1-KO+∆101–110 cells (n = 169 cells from 3 experiments). Mitochondria are stained by TOM20. DAPI is used to visualize nuclei. Scale bar, 20 μm. C Quantification of mitochondrial membrane potential staining by TMRM in WT (n = 99 cells from 3 experiments), REEP1-KO (n = 82 cells from 3 experiments), REEP1-KO+REEP1 (n = 94 cells from 3 experiments), and REEP1-KO+∆101–110 cells (n = 104 cells from 3 experiments). D Quantification of ATP levels in WT, REEP1-KO, REEP1-KO+REEP1, and REEP1-KO+∆101–110 cells (n = 4 replicates). E Representative immunoblots and quantification of mitochondrial OXPHOS assembly in WT, REEP1-KO, REEP1-KO+REEP1, and REEP1-KO+∆101–110 cells (n = 3 replicates). F Quantification of mitochondrial CIV activity in WT, REEP1-KO, REEP1-KO+REEP1, and REEP1-KO+∆101–110 cells (n = 4 replicates). G Representative immunoblots and quantification of NDUFA4 expression in the spinal cord from 120-day-old NTG and G93A mice (n = 4 mice per group). H Representative immunoblots and quantification of NDUFA4 expression in WT, REEP1-KO, REEP1-KO+REEP1, and REEP1-KO+∆101–110 cells (n = 4 replicates). I Relative mRNA levels of NDUFA4 in WT, REEP1-KO, REEP1-KO+REEP1, and REEP1-KO+∆101–110 cells (n = 3 replicates). Data are the mean ± SEM. *P <0.05, **P <0.01, ***P <0.001, ****P <0.0001, two-tailed Student’s t-test (G) and one-way ANOVA followed by Tukey’s multiple comparisons test (B–F, H, and I).
Fig. 7
Fig. 7
Impaired mitochondrial function in G93A mice is restored by REEP1 upregulation. A Representative immunoblots and quantification of REEP1 levels in mitochondrial fractions from the lumbar spinal cord of NTG, G93A/GFP, and G93A/REEP1 mice (n = 3 mice per group). B Representative immunoblots and quantification of NDUFA4 levels in the lumbar spinal cord of NTG, G93A/GFP, and G93A/REEP1 mice (n = 4 mice per group). C Representative images and quantification of the mitochondrial length in motor neurons from NTG, G93A/GFP, and G93A/REEP1 mice (n = 10–15 cells from 3 mice per group). Scale bar, 5 μm. D Quantification of CIV activity of mitochondria from NTG, G93A/GFP, and G93A/REEP1 mice (n = 4 mice per group). E Schematic of mitochondrial dysfunction caused by REEP1 deficiency. Under healthy conditions, REEP1 is localized in the outer and inner mitochondrial membranes, where it maintains OXPHOS assembly through interaction with its subunits. In the mitochondria of ALS patients, the reduction of REEP1 expression causes mitochondrial CIV disassembly and membrane potential loss. Data are the mean ± SEM. *P <0.05, **P <0.01, ***P <0.001, ****P <0.0001, one-way ANOVA followed by Tukey’s multiple comparisons test (A–D).

Similar articles

Cited by

References

    1. Hao Z, Wang R, Ren H, Wang G. Role of the C9ORF72 gene in the pathogenesis of amyotrophic lateral sclerosis and frontotemporal dementia. Neurosci Bull. 2020;36:1057–1070. doi: 10.1007/s12264-020-00567-7. - DOI - PMC - PubMed
    1. Wiedemann FR, Manfredi G, Mawrin C, Beal MF, Schon EA. Mitochondrial DNA and respiratory chain function in spinal cords of ALS patients. J Neurochem. 2002;80:616–625. doi: 10.1046/j.0022-3042.2001.00731.x. - DOI - PubMed
    1. Borthwick GM, Johnson MA, Ince PG, Shaw PJ, Turnbull DM. Mitochondrial enzyme activity in amyotrophic lateral sclerosis: Implications for the role of mitochondria in neuronal cell death. Ann Neurol. 1999;46:787–790. doi: 10.1002/1531-8249(199911)46:5<787::AID-ANA17>3.0.CO;2-8. - DOI - PubMed
    1. Mattiazzi M, D'Aurelio M, Gajewski CD, Martushova K, Kiaei M, Beal MF, et al. Mutated human SOD1 causes dysfunction of oxidative phosphorylation in mitochondria of transgenic mice. J Biol Chem. 2002;277:29626–29633. doi: 10.1074/jbc.M203065200. - DOI - PubMed
    1. Saito H, Kubota M, Roberts RW, Chi Q, Matsunami H. RTP family members induce functional expression of mammalian odorant receptors. Cell. 2004;119:679–691. doi: 10.1016/j.cell.2004.11.021. - DOI - PubMed

MeSH terms

Substances