. 2022 Nov 22;25(12):105646.
doi: 10.1016/j.isci.2022.105646. eCollection 2022 Dec 22.

FTO promotes innate immunity by controlling NOD1 expression via m6A-YTHDF2 manner in teleost

Affiliations

FTO promotes innate immunity by controlling NOD1 expression via m6A-YTHDF2 manner in teleost

Shang Geng et al. iScience. .

Abstract

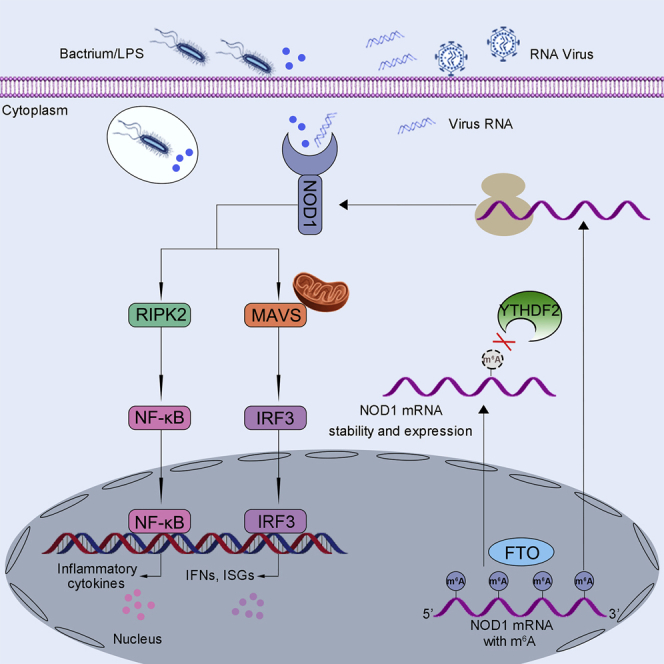
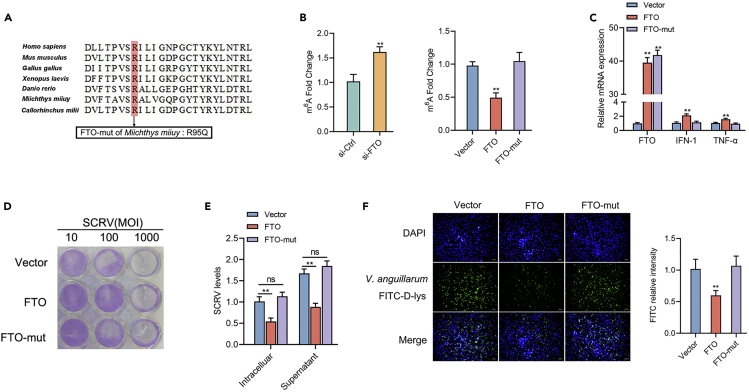
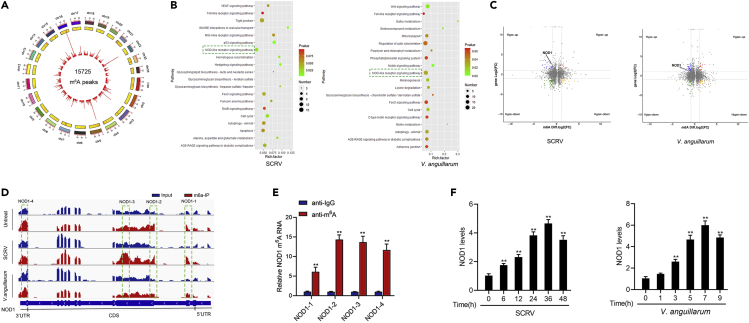
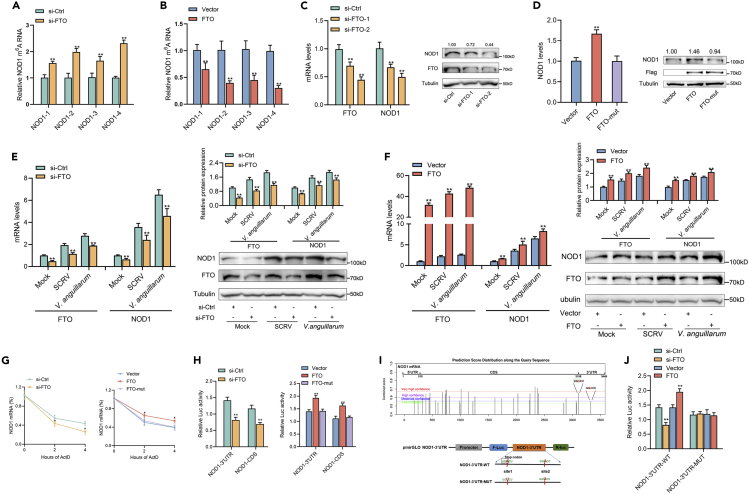
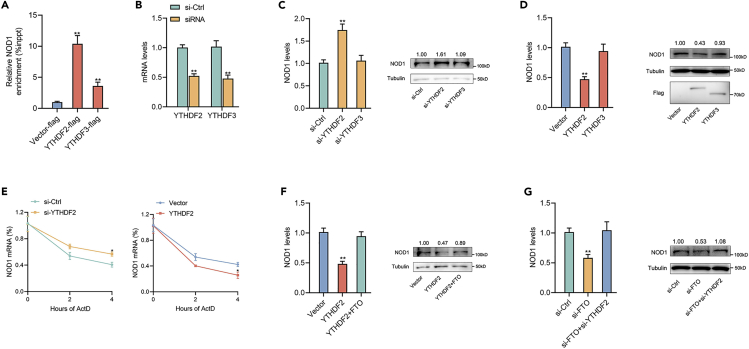
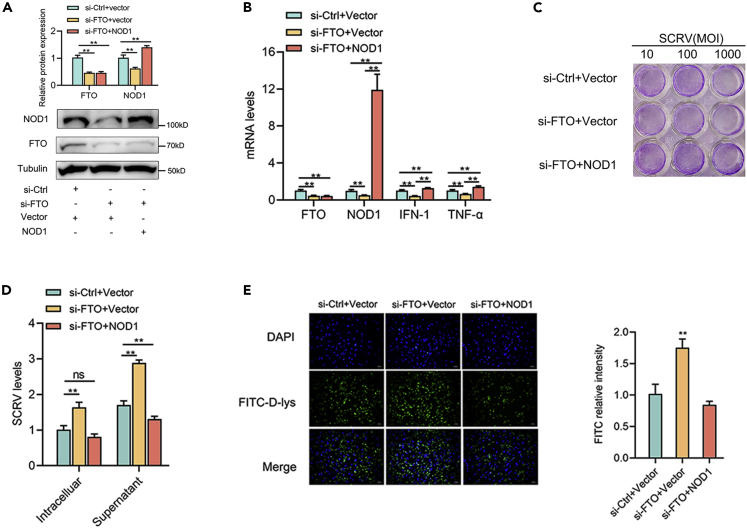
N6-methyladenosine (m6A), the most abundant internal mRNA modification in eukaryotes, plays a vital role in regulating innate immunity. However, its underlying mechanism remains largely unknown, especially in lower vertebrates. The results of the present study show that fat-mass- and obesity-associated protein (FTO), also known as a m6A demethylase, improved the innate immunity and prevented Siniperca chuatsi rhabdo virus and Vibrio anguillarum infection in miiuy croaker. Significantly, FTO-promoted immunity was dependent on its m6A demethylase activity. In terms of mechanism, NOD1 has abundant methylation modification in its CDS and 3'UTR regions, and FTO can reduce its methylation level, thus avoiding its degradation by YTHDF2. In summary, our results indicate that the FTO-mediated m6A modification in NOD1 mRNA promotes innate immunity by activating the NOD-like receptor pathway, which provides a molecular mechanism for the regulation of immune response via RNA methylation in teleost.

Keywords: Epigenetics; immunology; transcriptomics.


Conflict of interest statement

The authors declare no competing interests.

Figures

None
Graphical abstract
Figure 1
Figure 1
FTO promotes host innate immunity (A) mRNA and protein levels of FTO in MKC cells measured by qRT-PCR and Western blotting at indicated time after SCRV infection. (B) mRNA and protein levels of FTO in MKC cells measured by qRT-PCR and Western blotting at indicated time after V. anguillarum infection. (C) FTO knockdown and FTO overexpressing MKC cells seeded in 48-well plates overnight were treated with SCRV at the dose indicated for 48 h. Then, cell monolayers were fixed with 4% paraformaldehyde and stained with 1% crystal violet. (D) FTO inhibits SCRV replication. MKC cells were transfected with si-Ctrl or si-FTO and pcDNA3.1 vector or FTO expression plasmid for 24 h, then infected with SCRV for 24 h. The qPCR analysis was conducted for intracellular and supernatant SCRV RNA levels. (E) MKCs were transfected with si-FTO or si-Ctrl and with FTO plasmid or control vector, then infected with FITC-labeled V. anguillarum, and then examined by using a fluorescence microscope. Scale bars, 20 mm; original magnification ×400. (F and G) MKCs were transfected with si-FTO or si-Ctrl (F) and MKCs were transfected with FTO plasmid or vector (G) and then infected with V. anguillarum. The intracellular bacterial number was determined at different hours post-infection and shown as CFUs. (H) qPCR assays were performed to determine the expression levels of IFN-1, TNF-α, Mx1, and ISG15 in MKC cells transfected with si-FTO or si-Ctrl and with FTO plasmid or control vector after 24 h of the SCRV stimulation of MKCs. (I) qPCR assays were performed to determine the expression levels of IFN-1, TNF-α, IL-6, and IL-8 in MKC cells transfected with si-FTO or si-Ctrl and with FTO plasmid or control vector after 6 h of V. anguillarum stimulation of MKCs. All data presented as the means ± SE from at least three independent triplicated experiments. ∗∗, p < 0.01; ∗, p < 0.05 versus the controls.
Figure 2
Figure 2
The RNA demethylase activity of FTO is required for promoting innate immunity (A) Sequence alignment on both sides of the mutation site "R" in FTO in H. sapiens (no. NP_001073901.1), M. musculus (no. NP_036066.2), G. gallus (no. NP_001172076.1), X. laevis (no. NP_001087481.1), D. rerio (no. XP_001345910.4), M. miiuy (no. OP168916) and C. milii (no. XP_007887772.2). (B) FTO significantly decreased the mRNA m6A content. MKC cells were transfected with si-Ctrl or si-FTO and vector or FTO or FTO-mut plasmid for 48 h, then the m6A level was measured by colorimetry. (C) mRNA expression of FTO, IFN-1, and TNF-α in MKC cells transfected with FTO or FTO-m. (D) FTO and FTO-mut overexpressed MKC cells seeded in 48-well plates overnight were treated with SCRV at the dose indicated for 48 h. Then, cell monolayers were fixed with 4% paraformaldehyde and stained with 1% crystal violet. (E) MKC cells were transfected with pcDNA3.1 vector and FTO or FTO-mut expression plasmid for 24 h, then infected with SCRV for 24 h. The qPCR analysis was conducted for intracellular and supernatant SCRV RNA levels. (F) MKCs were transfected with pcDNA3.1 vector and FTO or FTO-mut plasmid, then infected with FITC-labeled V. anguillarum, and then examined by using a fluorescence microscope. Scale bars, 20 mm; original magnification ×400. All data presented as the means ± SE from at least three independent triplicated experiments. ∗∗, p < 0.01; ∗, p < 0.05 versus the controls.
Figure 3
Figure 3
NOD1 has abundant methylation modifications and high expression changes (A) Circos plots showing a total of 15725 m6A peaks identified from normal spleen tissues of miiuy croaker. Each red bar represents an m6A peak, and the height of the bar indicates the fold enrichment of each peak. (B) KEGG pathway analysis of transcripts with changed m6A levels in SCRV and V. anguillarum-infected spleen tissues versus normal spleen tissues. The size of the dot represents the number of transcripts with changed m6A modification in the corresponding pathway, and the color of the dot indicates the p value of the pathway. (C) Distribution of genes with a significant change in both the mRNA and m6A modification levels in the SCRV and V. anguillarum infected spleen relative to normal spleen tissues. (D) The m6A abundance in NOD1 mRNA transcripts detected by MeRIP-seq, the m6A peak of NOD1 is circled in the green box. For the four peaks, we designed m6A-specific primers on both sides of the peak. (E) m6A abundance on NOD1 mRNA in MKC cells detected by MeRIP-qPCR. (F) mRNA levels of NOD1 in MKC cells measured by qRT-PCR at indicated time after SCRV and V. anguillarum infection. All data presented as the means ± SE from at least three independent triplicated experiments. ∗∗, p < 0.01; ∗, p < 0.05 versus the controls.
Figure 4
Figure 4
FTO-mediated m6A demethylation of NOD1 mRNA affects its stability and expression level (A and B) The m6A level alteration of NOD1 upon FTO knockdown (A) or overexpression (B) was examined by MeRIP-qPCR. (C) MKC cells were transfected with si-Ctrl, si-FTO-1, or si-FTO-2, then the expression of NOD1 was detected by qRT-PCR and Western blotting. (D) MKC cells were transfected with pcDNA3.1 vector, FTO, or FTO-mut plasmid, then the expression of NOD1 was detected by qRT-PCR and Western blotting. (E) MKC cells were transfected with si-FTO or negative control si-Ctrl for 24 h and stimulated with SCRV for 24 h or infected with V. anguillarum for 6 h, then the expression of NOD1 was detected by qRT-PCR and Western blotting. (F) MKC cells were transfected with pcDNA3.1 vector or FTO plasmid for 24 h and stimulated with SCRV for 24 h or infected with V. anguillarum for 6 h, then the expression of NOD1 was detected by qRT-PCR and Western blotting. (G) MKC cells were transfected with si-FTO or si-Ctrl, and vector, FTO, or FTO-mut for 24 h, then 5 μg/mL actinomycin D was added to the cells to inhibit global mRNA transcription for 0, 2, and 4 h. The half-life of NOD1 was analyzed by qRT-PCR. (H) Relative luciferase activity of pmirGLO-NOD1-CDS and pmirGLO-NOD1-3′UTR firefly luciferase reporters in MKC cells transfected with si-Ctrl or si-FTO and vector, FTO, or FTO-mut. (I) The mRNA sequence of NOD1 was submitted to the SRAMP website, and then the predicted m6A sites were displayed. Two predicted methylation sites located on the 3′UTR of NOD1 were marked out. Schematic diagram of m6A site mutation on 3′UTR of NOD1 was shown, ‘A’ in the predicted methylation motif was replaced by ‘U’. (J) Relative luciferase activity of wild-type or mutant pmirGLO-NOD1-3′UTR plasmids in MKC cells transfected with si-Ctrl or si-FTO and vector or FTO plasmid. All data presented as the means ± SE from at least three independent triplicated experiments. ∗∗, p < 0.01; ∗, p < 0.05 versus the controls.
Figure 5
Figure 5
FTO mediates gene expression of NOD1 in an m6A-YTHDF2-dependent manner (A) Binding relationship between YTHDF2 or YTHDF3 and NOD1 mRNA validated using a RIP assay. MKC cells were transfected with YTHDF2-Flag or YTHDF3-Flag or pcDNA3.1-Flag for 48 h. (B) SiRNA silencing effect test of YTHDF2 and YTHDF3. MKC cells were transfected with si-YTHDF2 or si-YTHDF3 for 48 h. (C) MKC cells were transfected with si-YTHDF2 or si-YTHDF3 for 48 h. then the expression of NOD1 was detected by qRT-PCR and Western blotting. (D) MKC cells were transfected with YTHDF2 or YTHDF3 plasmids for 48 h. then the expression of NOD1 was detected by qRT-PCR and Western blotting. (E) MKC cells were transfected with si-YTHDF2 or negative control si-Ctrl and YTHDF2 or pcNDA3.1 vector for 24 h, then 5 μg/mL actinomycin D was added to the cells to inhibit global mRNA transcription for 0, 2, and 4 h. The half-life of NOD1 was analyzed by qRT-PCR. (F) Relative mRNA and protein levels of NOD1 in MKC cells after co-transfected with YTHDF2 and FTO plasmid. (G) Relative mRNA and protein levels of NOD1 in MKC cells after co-transfected with si-FTO and si-YTHDF2. All data presented as the means ± SE from at least three independent triplicated experiments. ∗∗, p < 0.01; ∗, p < 0.05 versus the controls.
Figure 6
Figure 6
FTO-mediated upregulation of NOD1 promotes innate immunity (A) protein expression levels of NOD1 in MKCs transfected with si-Ctrl, si-FTO, and siFTO + NOD1 plasmid, as detected using western blotting. (B) Relative mRNA expression of NOD1, IFN-1, and TNF-α in MKC cells transfected with si-FTO or si-FTO + NOD1 plasmid. (C) MKC cells seeded in 48-well plates overnight were transfected with si-FTO or si-FTO + NOD1 plasmid was treated with SCRV at the dose indicated for 36 h. Then, cell monolayers were fixed with 4% paraformaldehyde and stained with 1% crystal violet. (D) MKC cells were transfected with si-FTO or si-FTO + NOD1 plasmid for 24 h, then infected with SCRV for 36 h. The qPCR analysis was conducted for intracellular and supernatant SCRV RNA levels. (E) MKCs were transfected with si-FTO or si-FTO + NOD1 plasmid, then infected with FITC-labeled V. anguillarum, and then examined by using a fluorescence microscope. Scale bars, 20 mm; original magnification ×400. All data presented as the means ± SE from at least three independent triplicated experiments. ∗∗, p < 0.01; ∗, p < 0.05 versus the controls.

Similar articles

Cited by

References

    1. Shulman Z., Stern-Ginossar N. The RNA modification N-6-methyladenosine as a novel regulator of the immune system. Nat. Immunol. 2020;21:501–512. - PubMed
    1. Dina C., Meyre D., Gallina S., Durand E., Körner A., Jacobson P., Carlsson L.M.S., Kiess W., Vatin V., Lecoeur C., et al. Variation in FTO contributes to childhood obesity and severe adult obesity. Nat. Genet. 2007;39:724–726. - PubMed
    1. Scuteri A., Sanna S., Chen W.M., Uda M., Albai G., Strait J., Najjar S., Nagaraja R., Orrú M., Usala G., et al. Genome-wide association scan shows genetic variants in the FTO gene are associated with obesity-related traits. PLoS Genet. 2007;3:e115. - PMC - PubMed
    1. Jia G., Fu Y., Zhao X., Dai Q., Zheng G., Yang Y., Yi C., Lindahl T., Pan T., Yang Y.G., He C. N6-Methyladenosine in nuclear RNA is a major substrate of the obesity-associated FTO. Nat. Chem. Biol. 2011;7:885–887. - PMC - PubMed
    1. Wang L., Wen M., Cao X. Nuclear hnRNPA2B1 initiates and amplifies the innate immune response to DNA viruses. Science. 2019;365:eaav0758. - PubMed

LinkOut - more resources