. 2022 Dec 5;13(1):7483.
doi: 10.1038/s41467-022-35163-y.

Cannabinoid non-cannabidiol site modulation of TRPV2 structure and function

Affiliations

Cannabinoid non-cannabidiol site modulation of TRPV2 structure and function

Liying Zhang et al. Nat Commun. .

Abstract

TRPV2 is a ligand-operated temperature sensor with poorly defined pharmacology. Here, we combine calcium imaging and patch-clamp electrophysiology with cryo-electron microscopy (cryo-EM) to explore how TRPV2 activity is modulated by the phytocannabinoid Δ9-tetrahydrocannabiorcol (C16) and by probenecid. C16 and probenecid act in concert to stimulate TRPV2 responses including histamine release from rat and human mast cells. Each ligand causes distinct conformational changes in TRPV2 as revealed by cryo-EM. Although the binding for probenecid remains elusive, C16 associates within the vanilloid pocket. As such, the C16 binding location is distinct from that of cannabidiol, partially overlapping with the binding site of the TRPV2 inhibitor piperlongumine. Taken together, we discover a new cannabinoid binding site in TRPV2 that is under the influence of allosteric control by probenecid. This molecular insight into ligand modulation enhances our understanding of TRPV2 in normal and pathophysiology.


Conflict of interest statement

The authors declare no competing interests.

Figures
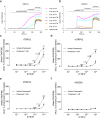
Fig. 1
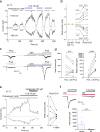
Fig. 1. C16 evoked TRPV2 responses are amplified by probenecid.
Probenecid (Prob, 1 mM), but not its vehicle, sensitized rat (a-c), mouse (d) and human (e) TRPV2-expressing HEK293T cells to the cannabinoid Δ9-tetrahydrocannabiorcol (C16) but not its vehicle. No amplification of C16 responses was observed in untransfected HEK293T cells (f). Data are shown as means ± SEM from three (d) to four (c, e and f) separate experiments, each performed in triplicates. The experiments were performed as shown in a and b with shared legends, where ionomycin (1 μM) was applied at the end of the experiment as positive control. The [Ca2+]i responses were analyzed as area under the curve (AUC) for C16 in the presence of probenecid or its vehicle, and calculated as a percentage of the ionomycin response (AUC) in the presence of the C16 vehicle. P values are given in italics and indicate statistical significance when <0.05; Student’s two-sided unpaired t-test. Source data are provided as a Source Data file.
Fig. 2
Fig. 2. Synergistic effects of C16 and probenecid on rat TRPV2 currents in HEK293T cells.
Representative whole-cell current recording from HEK293T cell expressing rat TRPV2. a Inward and outward currents were elicited by voltage ramps from −100 mV to +100 mV (0.4 V/s) delivered every 1 s from a holding potential of 0 mV. Stimuli of 3 mM probenecid (white horizontal bars) and 10 µM C16 (blue horizontal bars) were individually or synergistically applied to the cell at 42 °C. b Statistical summary of the peak currents (open and blue circles) in (a), induced by probenecid (Prob) and probenecid with C16 (Prob + C16) at +100 mV and −100 mV. Control (yellow circle) indicates currents measured at 25 °C before increasing the temperature to 42 °C at which the effects of probenecid and C16 were recorded. Data are shown as means ± SEM from five separate experiments. c Representative continuous whole-cell inward current traces at a holding potential of −60 mV showing an initial exposure to probenecid alone (Prob, 10 mM) followed by a second application of probenecid (10 mM) after preincubation of either C16 at a subthreshold concentration of 10 µM (see Fig. 1c) or its vehicle (Veh). Each treatment is from a different cell. The co-application of probenecid and C16 only induced a small current in control HEK293T cells (−39 ± 11 pA, n = 4 cells). d As summarized in the graph, the peak currents (open, grey and blue circles) in (c), evoked by probenecid increased in the presence of C16 (n = 6 independent experiments) but not in the presence of vehicle (n = 9 independent experiments). e The TRPV2 inhibitor valdecoxib (100 µM) inhibited outward and inward currents evoked by the combined application of probenecid and C16 (data are from three independent experiments performed as shown by the traces). f The non-selective TRP channel antagonist ruthenium red (RR, 10 µM, n = 7 independent experiments) inhibited currents evoked by the combined application of C16 (10 µM) and probenecid (10 mM) at a holding potential of −60 mV (n = 9 independent experiments). P values are given in italics and indicate statistical significance when <0.05, Student’s two-sided paired t-test (b), Wilcoxon two-sided matched-pairs test (d) and Welch’s two-sided unpaired t-test (f). Data are shown as means ± SEM. a, b, e Experiments recorded in extra- and intracellular Ca2+-free solutions. c, d and f Experiments recorded in extracellular Ca2+-containing solution. Source data are provided as a Source Data file.
Fig. 3
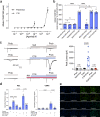
Fig. 3. C16 and probenecid are synergistic activators of rat and human mast cells.
a Concentration-dependent elevation of [Ca2+]i produced by individual probenecid and Δ9-tetrahydrocannabiorcol (C16) application in RBL-2H3 cells. C16 concentrations tested were limited because of its solubility limit. Data are shown as means ± SEM from three (C16) to four (probenecid) independent experiments performed in duplicate or triplicate. b Preincubation of RBL-2H3 cells with C16 (10 µM), but not capsaicin (CAP, 1 µM) or mustard oil (MO, 100 µM) potentiated the response to probenecid (3 mM). The [Ca2+]i increase induced by C16 and probenecid co-treatment was inhibited by the non-selective TRP antagonist ruthenium red (RR; 100 µM) but not by the TRPV1 antagonist capsazepine (CPZ, 3 µM) or the TRPA1 antagonist HC030031 (HC, 100 µM); one-way ANOVA followed by Sidak’s multiple comparisons test: F6,19 = 64.86; ****P < 0.0001 and ns = not significant (P ≥ 0.9940). Data are shown as means ± SEM from three to four independent experiments, as indicated within parentheses, each performed in triplicate. c As shown by traces from continuous recordings in RBL-2H3 cells (each from a separate cell), preincubation with C16 (10 µM), but not its vehicle (Veh), potentiated the whole-cell current induced by a second application of probenecid (Prob, 10 mM), whereas ruthenium red (RR, 10 µM) prevented probenecid-induced currents. Experiments were recorded in extracellular Ca2+-containing solution. As summarized in the bar graph, the average peak current induced by the second application of probenecid in the presence of C16 (n = 9), but not its vehicle (n = 8) or ruthenium red (n = 7) was significantly larger compared to the peak current induced by the first application of probenecid (P values are given in italics and indicate statistical significance when <0.05; Wilcoxon two-sided matched-pairs test). Data are from independent experiments and shown as means ± SEM. d The combination of probenecid and C16 more effectively triggered a ruthenium red sensitive histamine release from RBL-2H3 (n = 5 independent experiments) and human mast cells (CBMC, n = 7 biologically independent donors) than the application of the individual compounds. Data are shown as means ± SEM, and P values given in italics indicate statistical significance when <0.05; repeated measures one-way ANOVA followed by Sidak’s multiple comparisons test: F1.062,4.249 = 34.60 (RBL) and Student’s two-sided paired t-test (CBMC). e Probenecid combined with C16, but neither capsaicin (CAP) nor mustard oil (MO), increased intracellular calcium in the human mast cell line (HMC-1.2) expressing native TRPV2 (n = 2-3 independent experiments). The calcium ionophore ionomycin (1 μM) was used as positive control. Source data are provided as a Source Data file.
Fig. 4
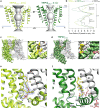
Fig. 4. Molecular effect of C16 and the vanilloid pocket.
a, b Profile of the ion permeation pathway, displayed as gray space-filling models, for (a) TRPV2C16-1 (light green) and TRPV2C16-2 (dark green) and (b) the corresponding calculated radii as a function of the distance along the ion conduction pathway. The pore radii of TRPV2open (PDB-ID: 6BO4) and TRPV2apo-2 (PDB-ID: 6U86) are also included as references and shown by black and white-blue lines, respectively. All pore calculations in this and subsequent analyses are based on polyalanine exchange of residues 504 to 651 including the pore helix (PH), selectivity filter, and lower gate to minimize the effect of differences in the resolution between structures. c, d Overall cryo-EM maps for (c) TRPV2C16-1 (light green) at 2.9 Å and (d) TRPV2 C16-2 (dark green) at 3.1 Å, with close-views of the vanilloid pocket showing putative (c) phosphocholine (PC, yellow), (d) CHS (yellow) and C16 (pink) features. e, f Details of the vanilloid binding pocket with (e) PC (yellow sticks) in TRPV2C16-1 and (f) CSH (yellow sticks) in TRPV2C16-2. C16 is shown as pink sticks in f. Key selected amino acids are shown as sticks. The corresponding cryo-EM density features of PC and CSH, but not C16, are shown as blue mesh (5.0 σ).
Fig. 5
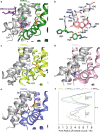
Fig. 5. C16 binding.
Proposed interaction site of C16 at the interface of two TRPV2 subunits. a TRPV2C16-2 (dark green) and one adjacent subunit in grey with C16 shown as pink sticks and the corresponding cryo-EM density as blue mesh (3.0 σ). Shown is also the binding site for cannabidiol CBD, which is distinct from the C16 binding site (adapted from PDB-ID: 6U8A). b The interaction network with C16 (pink sticks) and nearby residues in TRPV2C16-2. c The TRPV2C16-1 structure (light green) also shows cryo-EM density (blue mesh at 3.0 σ level, at which protein sidechains are distinguishable) in the assigned C16 binding region of TRPV2C16-2, although we have left it unmodeled. CHS (a) and PC (c) are shown as yellow sticks. d, e The corresponding site where we observe density for C16 in our structures (a, c) is shown in TRPV2apo-1 (PDB-ID: 6U84, pink) and TRPV2PLG (PDB-ID: 6WKN, purple). PLG is shown as yellow sticks. f The pore radius in TRPV2 cryo-EM structures as a function of the distance along the ion conduction pathway. TRPV2C16-1 (light green), TRPV2C16-2 (dark green), TRPV2apo-1 (PDB-ID: 6U84, pink) and TRPV2PLG (PDB-ID: 6WKN, purple). The pore radius of TRPV2open (PDB-ID: 6BO4) is included for reference (black).
Fig. 6
Fig. 6. Functional validation of the C16 binding site.
Representative whole-cell currents of D536, S526 and L636 rat TRPV2 mutants expressed in HEK293T cells elicited by heat applied in control extracellular solution and then by C16 applied sequentially at concentrations of 30, 60 and 100 µM (marked by horizontal blue bars) at 42 °C. a C16 did not evoke outward and inward currents in the D536E mutant. b The mutant S526A retains the sensitivity to C16. c, d As shown by representative traces for S526E (n = 8 independent experiments) and L636A (n = 7 independent experiments) mutants, C16 inhibited the currents caused by a rise in the temperature from 25 to 42 °C. e Concentration-response relationships for C16 activation of the D536E and S526A mutants. Data are shown as means ± SEM from five (D536E) and four (S526A) independent experiments. Source data are provided as a Source Data file.
Fig. 7
Fig. 7. C16-induced conformational changes.
Overlay of the (a-c) TRPV2C16-2 (dark green) and TRPV2apo-1 (PDB-ID: 6U84, pink) and (d-f) TRPV2C16-2 (dark green) and TRPV2PLG (PDB-ID: 6WKN, purple) structures based on global tetramer alignment. a-c Membrane views of TRPV2C16-2 and TRPV2apo-1 showing (a) two opposite S5-PH-S6 units, (b) a single subunit (S1-S5) and an adjacent subunit (showing S5-PH-S6-TRP helix), and (c) the local changes around the suggested C16 binding site. d-e Membrane views similar to a-c comparing TRPV2C16-2 and TRPV2PLG. Arrows indicate movements of TRPV2C16-2 relative to TRPV2apo-1 and TRPV2PLG, respectively. Local conformational changes are highlighted with stars. C16 is displayed as pink sticks in b, c and e, f.
Fig. 8
Fig. 8. Probenecid-induced conformational changes.
a Cryo-EM maps of TRPV2probenecid at 3.5 Å overall resolution with one subunit shown in magenta and the remaining subunits in grey. b The profile of the ion permeation pathway, displayed as grey space-filling model, (left) and the corresponding calculated pore radius as a function of the distance along the ion conduction pathway (right) for TRPV2probenecid (magenta). The pore radii of TRPV2OPEN (PDB-ID:6BO4; black line) and TRPV2apo-1 (PDB-ID: 6U84; pink line) are also included as references. c, d Overlay of (c) TRPV2probenecid (magenta) and TRPV2 C16-1 (light green) and (d) TRPV2probenecid TRPV2C16-2 (dark green) structures based on the alignment of a single subunit. Residues of interest are labelled and represented as sticks. Also shown are PC (c) and CHS (d) as yellow sticks, C16 (d) as pink sticks. e-g Overlay of globally aligned TRPV2probenecid (magenta) and TRPV2apo-1 (pink). e Membrane view comparisons of opposite pore-forming subunits. f Membrane view of the transmembrane region of a single subunit illustrating the differences in the vanilloid pocket region. g View of the pore from the intracellular side of the membrane. PH indicates pore helix, and arrows indicate structural movements of TRPV2probenecid in relation to TRPV2apo-1. The length of the arrow displays the varying degrees of structural changes. Star indicates local conformational changes.
Fig. 9
Fig. 9. The combined effect of C16 and probenecid on TRPV2.
a Profile of the ion permeation pathway, displayed as gray space-filling models, for TRPV2C16+pro-1 (orange) and TRPV2C16+pro-2 (yellow). The corresponding calculated pore radius as a function of the distance along the ion conduction pathway is also shown for TRPV2C16-pro-1 (orange), TRPV2C16-pro-2, (yellow), TRPV2C16-1, (light green), TRPV2C16-2 (dark green) and TRPV2probenecid (magenta). b, c Overlay of TRPV2C16+pro-2 with either TRPV2probenecid or TRPV2C16-2 structures based on global structural alignments. Membrane views of subunits of the vanilloid pocket (left) and S5-PH-S6 domain (right) are shown (PH designate pore helix). Arrows indicate structural movements of TRPV2C16+pro-2 in relation to either TRPV2probenecid or TRPV2C16-2. The blue mesh indicates cryo-EM density that may relate to C16. Residues of interest are shown as sticks. Local conformational changes are highlighted with stars.
Fig. 10
Fig. 10. Activation and inhibition of TRPV2 by various ligands.
The vanilloid pocket of ligand-free TRPV2 is occupied by lipids and demonstrates auto-stimulation of the selectivity filter (SF, or upper gate), as observed in-between two TRPV2 apo structures (TRPV2apo-1, PDB-ID: 6U84 and TRPV2apo-2, PDB-ID: 6U86). Two ligand-dependent activating mechanisms of TRPV2 are displayed. The presence of C16, probenecid, 2-APB (PDB-ID: 7T37) or RTX (PDB-ID: 6OO7) at different locations in TRPV2 displace the lipid from the vanilloid pocket (note: RTX only activates a modified TRPV2 form). In contrast, CBD (PDB-ID: 6U8A and 6U88) is unable to repel the lipid from the vanilloid pocket. PLG (PDB-ID: 6WKN) inhibition is achieved via the replacement of the lipid in the vanilloid pocket. The arrows indicate approximate molecular shifts.

Similar articles

Cited by

References

    1. Caterina MJ, Rosen TA, Tominaga M, Brake AJ, Julius D. A capsaicin-receptor homologue with a high threshold for noxious heat. Nature. 1999;398:436–441. doi: 10.1038/18906. - DOI - PubMed
    1. Caterina MJ, et al. The capsaicin receptor: a heat-activated ion channel in the pain pathway. Nature. 1997;389:816–824. doi: 10.1038/39807. - DOI - PubMed
    1. Axelsson HE, et al. Transient receptor potential vanilloid 1, vanilloid 2 and melastatin 8 immunoreactive nerve fibers in human skin from individuals with and without Norrbottnian congenital insensitivity to pain. Neuroscience. 2009;162:1322–1332. doi: 10.1016/j.neuroscience.2009.05.052. - DOI - PubMed
    1. Park U, et al. TRP vanilloid 2 knock-out mice are susceptible to perinatal lethality but display normal thermal and mechanical nociception. J. Neurosci. 2011;31:11425–11436. doi: 10.1523/JNEUROSCI.1384-09.2011. - DOI - PMC - PubMed
    1. Leffler A, Linte RM, Nau C, Reeh P, Babes A. A high-threshold heat-activated channel in cultured rat dorsal root ganglion neurons resembles TRPV2 and is blocked by gadolinium. Eur. J. Neurosci. 2007;26:12–22. doi: 10.1111/j.1460-9568.2007.05643.x. - DOI - PubMed

Publication types