. 2022 Nov 17;11(22):3646.
doi: 10.3390/cells11223646.

The Long-Term Pannexin 1 Ablation Produces Structural and Functional Modifications in Hippocampal Neurons

Affiliations

The Long-Term Pannexin 1 Ablation Produces Structural and Functional Modifications in Hippocampal Neurons

Carolina Flores-Muñoz et al. Cells. .

Abstract

Enhanced activity and overexpression of Pannexin 1 (Panx1) channels contribute to neuronal pathologies such as epilepsy and Alzheimer's disease (AD). The Panx1 channel ablation alters the hippocampus's glutamatergic neurotransmission, synaptic plasticity, and memory flexibility. Nevertheless, Panx1-knockout (Panx1-KO) mice still retain the ability to learn, suggesting that compensatory mechanisms stabilize their neuronal activity. Here, we show that the absence of Panx1 in the adult brain promotes a series of structural and functional modifications in the Panx1-KO hippocampal synapses, preserving spontaneous activity. Compared to the wild-type (WT) condition, the adult hippocampal neurons of Panx1-KO mice exhibit enhanced excitability, a more complex dendritic branching, enhanced spine maturation, and an increased proportion of multiple synaptic contacts. These modifications seem to rely on the actin-cytoskeleton dynamics as an increase in the actin polymerization and an imbalance between the Rac1 and the RhoA GTPase activities were observed in Panx1-KO brain tissues. Our findings highlight a novel interaction between Panx1 channels, actin, and Rho GTPases, which appear to be relevant for synapse stability.

Keywords: actin cytoskeleton; dendritic spines; neuronal morphology; pannexin 1.


Conflict of interest statement

The authors declare no conflict of interest.

Figures

Figure 1
Figure 1
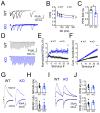
Enhanced excitability but normal glutamatergic synaptic transmission in hippocampal CA1 neurons from Panx1-KO mice. (A) Schematic drawing of a whole cell recording in the pyramidal cell layer (Stratum pyramidale, Sp) of the CA1 region of a hippocampal slice. (B) Representative traces of action potential recordings evoked by a current ramp in CA1 neurons of WT (black) and Panx1-KO (KO, blue) mice. (C) Action potential threshold. n = 10 (WT) and n = 8 (KO) cells from 4–5 animals, * p = 0.0108 Mann–Whitney test. (D) Representative traces of membrane potential changes in response to the current steps. (E) Current-voltage curves. n = 10 (WT) and n = 8 (KO) cells from 4–5 animals, * p < 0.0142, ** p < 0.046 and *** p < 0.001 two-way ANOVA test. (F) Spiking frequency in response to the current steps for WT and KO hippocampal cells. n = 10 (WT) and n = 8 (KO) cells from 4–5 animals, * p < 0.0142 two-way ANOVA test. (G) Schematic drawing of a field recording in the dendritic cell layer (Stratum radiatum, Sr) of the CA1 region of a hippocampal slice. (H) Representative traces of input–output curves of pharmacologically isolated NMDAR fEPSP (NR-FP) and analysis of the slope (I), fiber volley (FV) amplitude (J), plots of NR-FP slope versus the number of pop spikes (K), and averaged number (N) of pop spikes (L). n = 10 (WT) and n = 7 (KO) cells from 4–5 animals, *** p < 0.001 Mann–Whitney test. (M) Representative traces of input–output curves of AMPAR fEPSP (AR-FP) and analysis of the slope (N), FV amplitude (O), plots of AR-FP slope versus the amplitude of the pop spike (P), and averaged amplitude of pop spikes (Q). n = 22 (WT) and n = 25 (KO) cells from 5–6 animals, *** p < 0.001 Mann–Whitney test.
Figure 2
Figure 2
Readily releasable pool (RRP) and vesicle release probability are increased in Panx1-KO synapses. (A) Representative traces of superimposed paired-pulse responses at variable inter-stimulus intervals (ISI) from WT (black) and Panx1-KO (KO, blue) CA1 neurons. (B) Analysis of the paired-pulse facilitation ratio (PPR). n = 5 (WT) and n = 7 (KO) cells from 4–5 animals, * p = 0.0074 two-way ANOVA test. (C) PPR at 300 ms ISI. * p = 0.0144 Mann–Whitney test. (D) Representative traces of EPSCs were evoked by a train of 25 pulses at 10 Hz. (E) Normalized values of EPSCs. n = 5 (WT) and n = 7 (KO) slices from 4–5 animals, ** p = 0.0017 two-way ANOVA test. (F) Plot of the cumulative EPSCs versus number of stimuli. n = 5 (WT) and n = 7 (KO) slices from 4–5 animals, *** p =0.002 two-way ANOVA test. (G) Representative traces of the NMDAR and AMPAR currents. (H) Analysis of AMPAR to NMDAR (AR/NR) ratio recorded at 40 mV (top) and −70 mV (bottom). (I) Representative traces of AMPAR and NMDAR currents induced by a paired-pulse (at 50-ms intervals). (J) Analysis of paired-pulse ratio (PPR) recorded at 40 mV (top) and –70 mV (bottom).
Figure 3
Figure 3
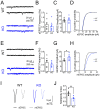
Increased mEPSC amplitude but normal spontaneous release and reduced number of releasing sites in Panx1-KO CA1 neurons. (A) Representative traces of sEPSC events recorded in WT (black) and Panx1-KO (KO, blue) CA1 neurons. n = 8 (WT) and n = 8 (KO) cells from 4–5 animals. (B,C) Analysis of sEPSC frequency (B) and amplitude (C). (D) Cumulative probability plots of the sEPSC amplitude distribution. (E) Representative traces of mEPSC events. (FH) Analysis of mEPSC frequency (F) and amplitude (G). n = 8 (WT) and n = 8 (KO) cells from 4–5 animals, * p = 0.0104 Mann–Whitney test. (H) Cumulative probability plots of the mEPSC amplitude distribution. (I) Averaged traces of individual sEPSC (continuous line) and mEPSC (dotted line) events. (J) Analysis of the multiplicity index. n = 8 (WT) and n = 8 (KO) cells from 4–5 animals, ** p = 0.012 Mann–Whitney test.
Figure 4
Figure 4
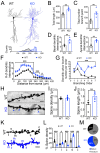
Enhanced dendritic arborization and spine maturation in Panx1-KO neurons. (A) Representative drawings of the Golgi-stained CA1 neurons (top) and histogram distribution of total dendritic length (bottom) for WT (black) and Panx1-KO (KO, blue) mice. Magnification, 40X; bar: 40 µm. (B) Averaged total dendritic length. n = 100 (WT) and n = 100 (KO) neurons from 6 animals, ** p = 0.002 Mann–Whitney test. (C) Averaged basal dendritic branches. n = 100 (WT) and n = 100 (KO) neurons from 6 animals, ** p = 0.002 Mann–Whitney test. (D) Averaged apical dendritic branches. n = 100 (WT) and n = 100 (KO) neurons from 6 animals, ** p = 0.002 Mann–Whitney test. Dendritic branches. (E) Averaged dendritic intersections. n = 100 (WT) and n = 100 (KO) neurons from 6 animals, ** p = 0.002 Mann–Whitney test. Dendritic branches. (F) Number of intersections as a function of the distance from soma. n = 100 (WT) and n = 100 (KO) neurons from 6 animals, * p = 0.02, *** p < 0.001 two-way ANOVA test. (G) Branch order as a function of the distance from soma. n = 100 (WT) and n = 100 (KO) neurons from 6 animals, *** p < 0.001 two-way ANOVA test. (H) Representative images of dendritic segments with dendritic spines (arrowheads). (I) Averaged spine density. (J) Averaged spine length. n = 80 (WT) and n = 80 (KO) dendrites from 6 animals, ** p = 0.004 Mann–Whitney test. (K) Pseudo-colored images of dendritic segments as in (H) showing different types of dendritic spines, filopodium (f), thin (t), short (s), and mushroom (m) types. Magnification 100X, bar: 2 µm. (L) Proportion of different types of dendritic spines. (M) Percentage of mature and inmature dendritic spines. n = 80 (WT) and n = 80 (KO) dendrites from 6 animals, * p = 0.02, ** p = 0.005, *** p < 0.001 two-way ANOVA test.
Figure 5
Figure 5
Multiple contacts, a higher number of docked vesicles, and enhanced PSD length in Panx1-KO synapses. (A) Representative transmission electron microscopy photographs of assymetric synapses of the CA1 Stratum radiatum area of WT (black) and Panx1-KO (KO, blue) mice. Magnification 43.000X, bar: 200 nm. (B) Percentage of single, double, and triple contacts. n = 276 (WT) and n = 392 (KO) synaptic contacts, 6 ultrathin sections from 3 animals, ** p = 0.002, *** p < 0.001 two-way ANOVA test. (C) PSD length. * p = 0.03 Mann–Whitney test. (D) Number of synaptic vesicles per bouton. n = 59 (WT) and n = 79 (KO) synaptic boutons, 6 ultrathin sections from 3 animals, * p = 0.0286 Mann–Whitney test. (E) Cumulative probability of the docked vesicle distribution. (F) Number of docked vesicles at the active zone (AZ). n = 48 (WT) and n = 78 (KO) synaptic boutons, 6 ultrathin sections from 3 animals, * p = 0.03 Mann–Whitney test. (G) Cumulative probability of the vesicles/AZ distribution. (H) Representative blots and densitometric analysis of synaptic proteins membranes avoided of PSD (SM)-enriched fractions. n = 6 (WT) and n = 6 (KO) ultrathin sections from 5–6 animals, *** p < 0.001 two-way ANOVA test. (I) Representative blots and densitometric analysis of synaptic protein levels in synaptic and PSD-enriched. n = 6 (WT) and n = 6 (KO) ultrathin sections from 5–6 animals, * p = 0.002, *** p < 0.001 two-way ANOVA test.
Figure 6
Figure 6
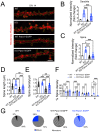
Panx1 regulates morphology in cultured hippocampal neurons. (A) Representative images of DIV 14 hippocampal neurons transfected with EGFP or Panx1-EGFP (green) and stained with rhodamine-phalloidin (red). Magnification, 40X; Scale bar, 15 µm. n = 10 (WT) and n = 14 (KO) cells from 5–6 cultures. (B) Quantification of dendritic length. n = 54 (WT) and n = 55 (KO) cells from 5–6 cultures, ** p = 0.003, *** p < 0.001 two-way ANOVA test. (C) Total of the dendritic branch. n = 54 (WT) and n = 55 (KO) cells from 5–6 cultures, *** p < 0.001 two-way ANOVA test. (D) Sholl analysis of dendritic arbors. n = 54 (WT) and n = 55 (KO) cells from 5–6 cultures, ** p < 0.005, *** p < 0.001 two-way ANOVA test.
Figure 7
Figure 7
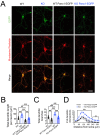
Panx1 cellular and dendritic spine (A) Representative dendritic segments of DIV 14 hippocampal neurons transfected with EGFP or Panx1-EGFP (green) and stained with rhodamine-phalloidin (red). Magnification, 100X; Scale bar, 2 µm. (B) Quantification of rhodamine-phalloidin intensity in the dendritic shaft. n = 23 (WT) and n = 28 (KO) dendrites from 5–6 cultures, *** p < 0.001 two-way ANOVA test. (C) Quantification of rhodamine-phalloidin intensity in dendritic spines. n = 23 (WT) and n = 28 (KO) dendrites from 5–6 cultures, * p = 0.02, *** p < 0.001 two-way ANOVA test. (D) Quantitative analysis of dendritic spine length. n = 23 (WT) and n = 28 (KO) dendrites from 5–6 cultures, ** p = 0.002, *** p < 0.001 two-way ANOVA test. (E) Quantitative analysis of spine density. n = 23 (WT) and n = 28 (KO) dendrites from 5–6 cultures, ** p = 0.03, *** p < 0.001 two-way ANOVA test. (F) Spine classification and quantification of dendritic spines. n = 164 (WT) and n = 163 (KO) spines from 5–6 cultures, * p = 0.01, ** p = 0.003, *** p < 0.001 two-way ANOVA test. (G) Percentage of mature and immature dendritic spines. n = 23 (WT) and n = 28 (KO) dendrites from 5–6 cultures, *** p < 0.001 two-way ANOVA test.
Figure 8
Figure 8
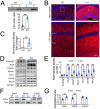
Increased actin polymerization and Rac1 activity in Panx1-KO hippocampi. (A) Representative blots (top) and densitometric analysis of the relative amount of monomers (G) and filaments (F) of actin (bottom), in hippocampal lysates of WT (black) and Panx1-KO (KO, blue) mice. n = 6 (WT) and n = 6 (KO) slices from 4–5 animals, *** p < 0.001 Mann–Whitney test. (B) Representative confocal micrographs showing the rhodamine-phalloidin reactivity of the F-actin network in the CA1 region in the hippocampus. Whole hippocampal at 4X magnification (top panel), scale bar: 150 µm. Magnified view showing the Stratum radiatum (Sr) and the Stratum pyramidale (Sp) layer at 20X magnification (bottom panel), scale bar: 25 µm. (C) Quantification of rhodamine-phalloidin intensity. n = 6 (WT) and n = 6 (KO) slices from 6 animals, *** p < 0.001 Mann–Whitney test. (D,E) Representative blots (D) and densitometric analysis (E) of Rho GTPases and synaptic actin-binding proteins levels. n = 6 (WT) and n = 6 (KO) slices from 6 animals, *** p < 0.001 two-way ANOVA test. (F,G) Representative blots (F) and densitometric analysis (G) of the relative levels of the active Rac1, Cdc42 and RhoA proteins. n = 6 (WT) and n = 6 (KO) slices from 6 animals, ** p = 0.02, *** p < 0.001 two-way ANOVA test.

Similar articles

Cited by

References

    1. Deng Z., He Z., Maksaev G., Bitter R.M., Rau M., Fitzpatrick J.A.J., Yuan P. Cryo-EM structures of the ATP release channel pannexin 1. Nat. Struct. Mol. Biol. 2020;27:373–381. doi: 10.1038/s41594-020-0401-0. - DOI - PubMed
    1. Michalski K., Syrjanen J.L., Henze E., Kumpf J., Furukawa H., Kawate T. The Cryo-EM structure of pannexin 1 reveals unique motifs for ion selection and inhibition. eLife. 2020;9:e56114. doi: 10.7554/eLife.54670. - DOI - PMC - PubMed
    1. Ruan Z., Orozco I.J., Du J., Lu W. Structures of human pannexin 1 reveal ion pathways and mechanism of gating. Nature. 2020;584:646–651. doi: 10.1038/s41586-020-2357-y. - DOI - PMC - PubMed
    1. Decrock E., De Bock M., Wang N., Bultynck G., Giaume C., Naus C.C., Green C.R., Leybaert L. Connexin and pannexin signaling pathways, an architectural blueprint for CNS physiology and pathology? Cell Mol. Life Sci. 2015;72:2823–2851. doi: 10.1007/s00018-015-1962-7. - DOI - PMC - PubMed
    1. Cheung G., Chever O., Rouach N. Connexons and pannexons: Newcomers in neurophysiology. Front. Cell. Neurosci. 2014;8:348. doi: 10.3389/fncel.2014.00348. - DOI - PMC - PubMed

Publication types

Grants and funding

This research was funded by PAI 79150045, FONDECYT 11150776 and 1201342 (Á.O.A.), 11180731 (A.M.G.-J.), 1171006 (M.F.), 1171240 (A.D.M.); Millennium Institute ICM-ANID ICN09–022 (Á.O.A, A.M.G.-J. and A.D.M.); Proyecto Puente 20993 and partial supports from DIUV-CI Grant No. 01/2006 (M.F., Universidad de Valparaíso); ANID Doctorate Fellowship 21190247 (C.F.-M.), 21190642 (F.G.-R.), 21181214 (O.S.), 21211147 (S.O.) and 21191624 (J.I.-G.).