. 2022 Oct 26:13:1004099.
doi: 10.3389/fphys.2022.1004099. eCollection 2022.

Loss of Drosophila Clueless differentially affects the mitochondrial proteome compared to loss of Sod2 and Pink1

Affiliations

Loss of Drosophila Clueless differentially affects the mitochondrial proteome compared to loss of Sod2 and Pink1

Aditya Sen et al. Front Physiol. .

Abstract

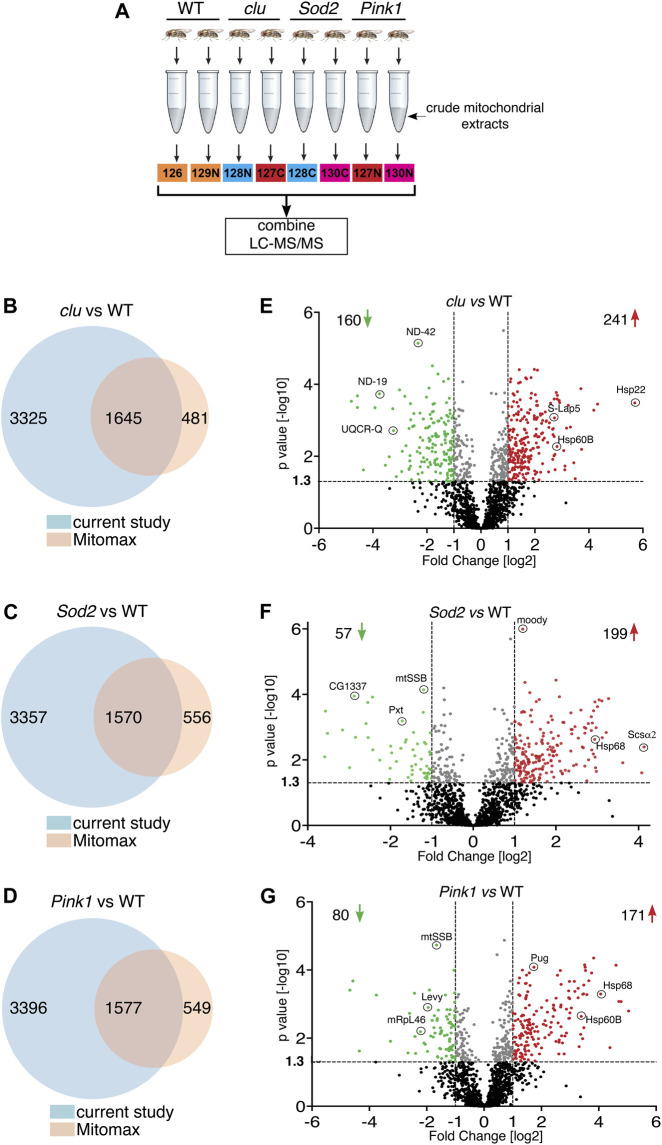
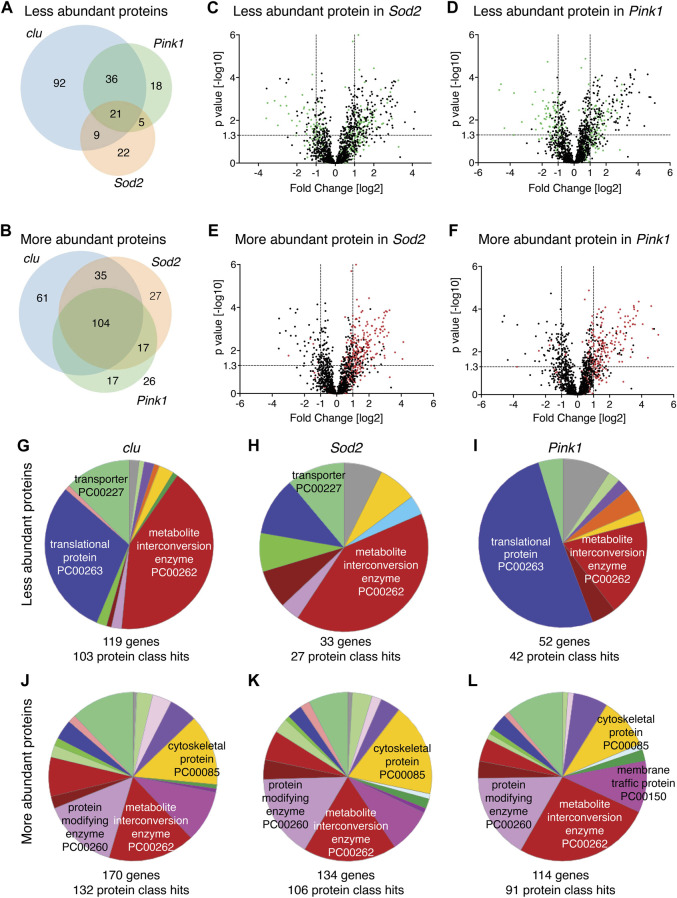
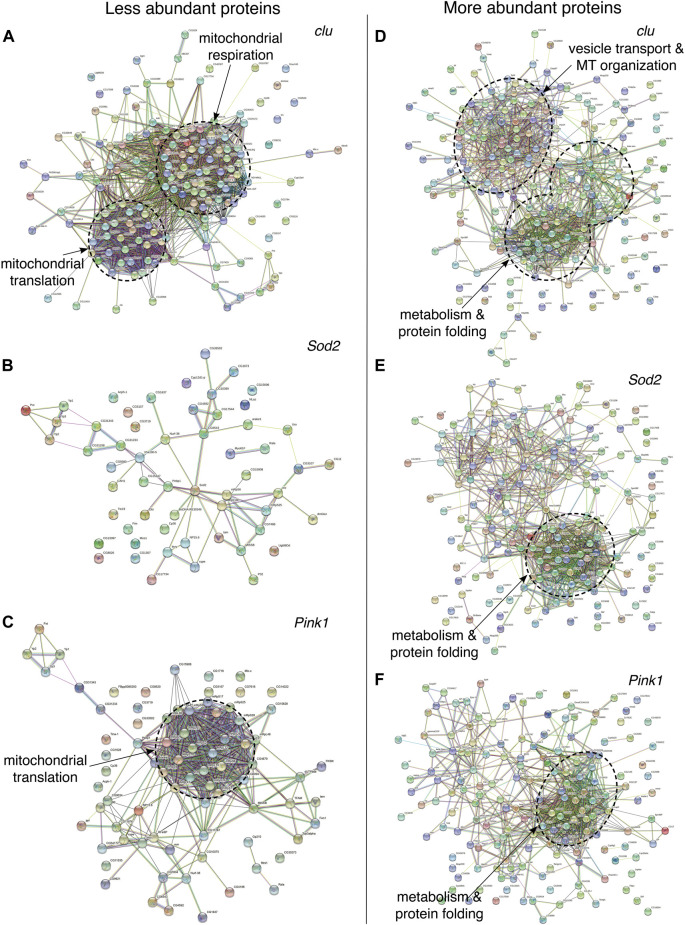
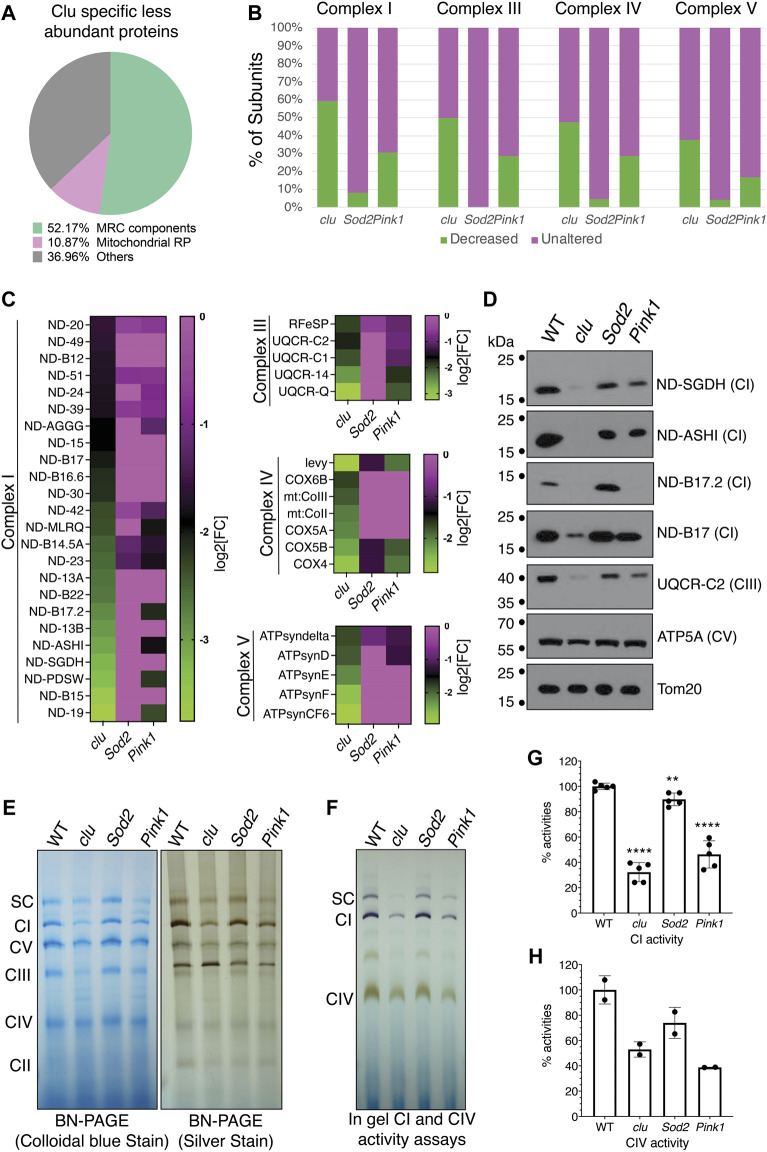
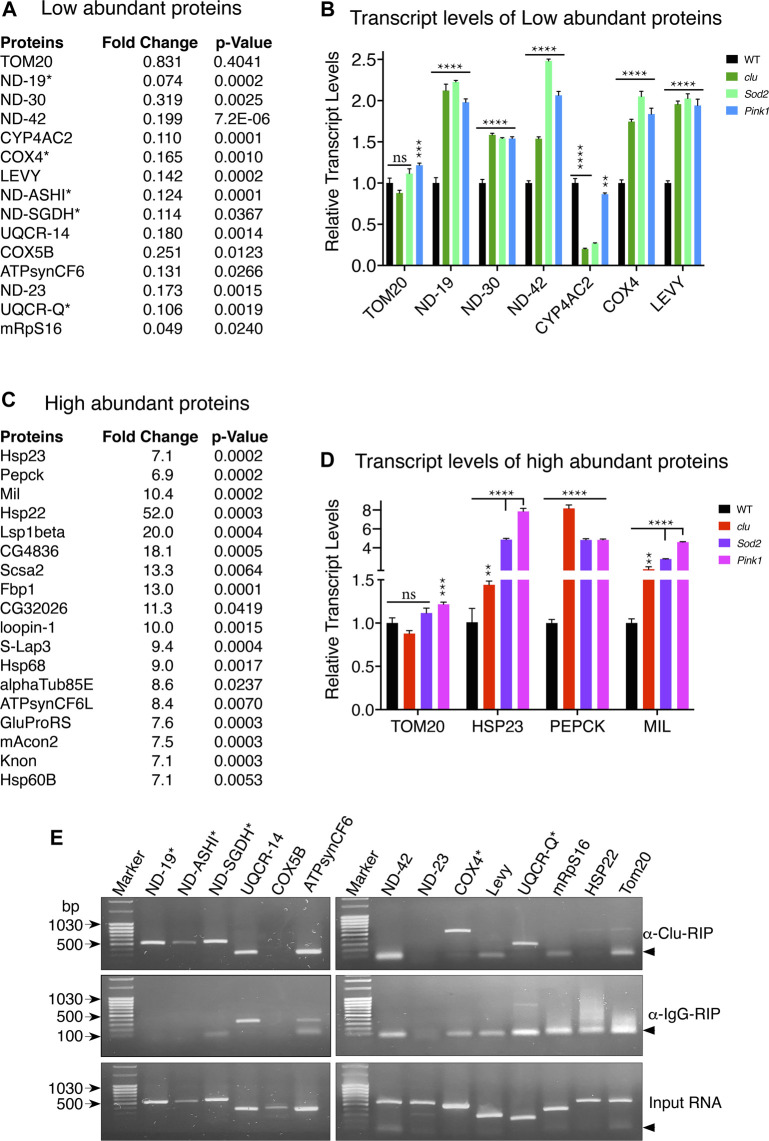
Mitochondria contain their own DNA, mitochondrial DNA, which encodes thirteen proteins. However, mitochondria require thousands of proteins encoded in the nucleus to carry out their many functions. Identifying the definitive mitochondrial proteome has been challenging as methods isolating mitochondrial proteins differ and different tissues and organisms may have specialized proteomes. Mitochondrial diseases arising from single gene mutations in nucleus encoded genes could affect the mitochondrial proteome, but deciphering which effects are due to loss of specific pathways or to accumulated general mitochondrial damage is difficult. To identify specific versus general effects, we have taken advantage of mutations in three Drosophila genes, clueless, Sod2, and Pink1, which are required for mitochondrial function through different pathways. We measured changes in each mutant's mitochondrial proteome using quantitative tandem mass tag mass spectrometry. Our analysis identified protein classes that are unique to each mutant and those shared between them, suggesting that some changes in the mitochondrial proteome are due to general mitochondrial damage whereas others are gene specific. For example, clueless mutants had the greatest number of less and more abundant mitochondrial proteins whereas loss of all three genes increased stress and metabolism proteins. This study is the first to directly compare in vivo steady state levels of mitochondrial proteins by examining loss of three pathways critical for mitochondrial function. These data could be useful to understand disease etiology, and how mutations in genes critical for mitochondrial function cause specific mitochondrial proteomic changes as opposed to changes due to generalized mitochondrial damage.

Keywords: Clueless; PINK1; SOD2; drosophila; mitochondria; mitochondrial proteome; respiratory chain complexes.


Conflict of interest statement

The authors declare that the research was conducted in the absence of any commercial or financial relationships that could be construed as a potential conflict of interest.

Figures

FIGURE 1
FIGURE 1
Mitochondrial protein abundance in clu, Sod2 and Pink1 mutants. (A) Schematic of the TMT mass spectrometry method for analyzing mitochondrial extract from wild type (WT), clu, Sod2, and Pink1 mutant adults. (B–D) Venn diagrams comparing the number of proteins identified in clu (B), Sod2 (C) and Pink1 (D) mutants vs. proteins listed in the Mitomax database. (E–G) Volcano plots showing the proteins identified by LC-MS/MS analysis. Proteins from clu (E), Sod2 (F) and Pink1 (G) mutants were compared with WT. p values (-log10) and Fold Change (log2) were plotted on the y-axis and x-axis, respectively. The vertical dotted lines mark the cut-off limits for Fold Change [log2] >1 and the horizontal dotted line denotes the p value [−log10] = 1.3. Proteins that were significantly less abundant (i.e., Fold Change [log2] < 1 and p value [log10] > 1.3) are shown in green dots, whereas proteins that were significantly more abundant (i.e., Fold Change [log2] > 1 and p value [−log10] > 1.3) are shown in red dots. A few representative proteins from each coordinate are labeled. Proteins with statistically insignificant (p ≥ 0.05) abundant ratio are labeled in black dots and proteins whose abundant ratios are significant but fall within the cut-off limits for Fold Change are marked in gray dots. The number of less and more abundant proteins in each genotype are shown in the respective coordinates.
FIGURE 2
FIGURE 2
(A,B) Venn diagrams comparing the numbers of less abundant (A) and more abundant (B) proteins in clu, Sod2 and Pink1 mutants. (C–F) Volcano plots showing the distribution of proteins that were either less abundant (green dots) and more abundant (red dots) in clu mutants superimposed on Sod2 (C,E) and Pink1 (D,F) volcano plots. p values (−log10) and Fold Change (log2) were plotted on the y-axis and x-axis, respectively. The vertical dotted lines mark the cut-off limits for Fold Change [log2] >1 and the horizontal dotted line denotes the p value [−log10] = 1.3. (G–L) Pie charts showing PANTHER Protein Class (PC) ontology of less abundant proteins (G–I) and more abundant proteins (J–L) for clu, Sod2, and Pink1 mutants. Numbers of genes and protein class hits are below each pie chart. Major protein class hits in each mutant were marked on pie chart slices. Names of all protein classes along with color codes and respective percent hits are in Supplementary Table S3.
FIGURE 3
FIGURE 3
STRING protein-protein interaction (PPI) networks showing the overall clustering features of less (A–C) and more (D–F) abundant proteins in clu, Sod2, and Pink1 mutants. Each of the major functional clusters are encircled with dashed circles and are labeled based on their compositions and biological roles. High-resolution PPI networks for each panel can be found in Supplementary Figures S1–S6 and the major candidates from each respective cluster are in Supplementary Table S6. Nodes represent proteins and edges denote interactions. The color of each node represents the nature of interactions, e.g., known or predicted interaction. A detailed description of nodes and edges can be found at STRING database (https://string-db.org/).
FIGURE 4
FIGURE 4
Mitochondrial respiratory chain proteins are greatly decreased in clu mutants. (A) A pie chart showing clu specific less abundant proteins in different categories as percentage of the whole [total = 92 (Figure 2A)]: Mitochondrial Respiratory Chain (MRC) components, Mitochondrial Ribosomal Proteins (Mitochondrial RP) and Others. (B) Bar graph showing the number of subunits, in percentages, from each entire MRC are either decreased (in green) or remain unaltered (in magenta). (C) Heat maps showing the levels of affected individual MRC proteins of different complexes in clu, Sod2, and Pink1 mutants. The proteins chosen are decreased in clu mutants. Color coded scale bars (green: less abundant and magenta: unaltered) are representing the log2[Fold Change] of individual protein in each mutant compared to wild type. (D) Western blots showing the levels of representative proteins in clu, Sod2, and Pink1. Tom20 was used as a loading control. (E) Proteins from isolated mitochondria were run to determine the levels of native MRC complexes on a BN-PAGE (left panel, stained with colloidal blue, right panel, stained with SilverQuest Silver Staining Kit). (F) In-gel activity assays. Dark purple bands indicate CI activity and brown bands indicate CIV activity. (G,H) The activities from CI (G) and CIV (H) were determined by measuring band intensity of the respective complexes using Fiji software. Band intensities from three gels (n = 3) for CI and two gels (n = 2) for CIV were used for the measurements. Error bars: S.E.M. calculated in GraphPad-PRISM software. p values were calculated in GraphPad-PRISM software using an unpaired t-test and each mutant was compared to the wildtype control. Statistical significance = p < 0.0001 (****) and p < 0.003 (**).
FIGURE 5
FIGURE 5
Loss of clu, Sod2, and Pink1 increase transcript levels for candidate mitochondrial proteins. (A,C) Representative mitochondrial proteins with respective fold changes and p values for less (A) and more (C) abundant proteins in clu mutants. The transcripts of proteins marked with asterisks bind Clu. (B,D) Bar graphs showing the relative transcript levels of selected less (B) and more (D) abundant proteins in clu, Sod2, and Pink1 mutants. (E) RT-PCR after Clu immunoprecipitation (RIP). anti-IgG and input are the two controls. Candidates marked with asterisks bind Clu. Arrowheads show the location of nonspecific primer-primer dimers. (B,D) Error bars: S.E.M. calculated in GraphPad-PRISM software. p-values were calculated in GraphPad-PRISM software using an unpaired t-test and each mutant was compared to the wildtype control. Statistical significance = p < 0.000001 (****), p < 0.00001 (***), p < 0.005 (**), ns = non-significant.

Similar articles

Cited by

References

    1. Agarwal S., Ganesh S. (2020). Perinuclear mitochondrial clustering, increased ROS levels, and HIF1 are required for the activation of HSF1 by heat stress. J. Cell Sci. 133 (13), jcs245589. 10.1242/jcs.245589 - DOI - PubMed
    1. Al-Mehdi A. B., Pastukh V. M., Swiger B. M., Reed D. J., Patel M. R., Bardwell G. C., et al. (2012). Perinuclear mitochondrial clustering creates an oxidant-rich nuclear domain required for hypoxia-induced transcription. Sci. Signal. 5 (231), ra47. 10.1126/scisignal.2002712 - DOI - PMC - PubMed
    1. Andersson S. G., Zomorodipour A., Andersson J. O., Sicheritz-Ponten T., Alsmark U. C., Podowski R. M., et al. (1998). The genome sequence of Rickettsia prowazekii and the origin of mitochondria. Nature 396 (6707), 133–140. 10.1038/24094 - DOI - PubMed
    1. Area-Gomez E., Schon E. A. (2014). Mitochondrial genetics and disease. J. Child. Neurol. 29 (9), 1208–1215. 10.1177/0883073814539561 - DOI - PubMed
    1. Cai Q., Tammineni P. (2017). Mitochondrial aspects of synaptic dysfunction in alzheimer's disease. J. Alzheimers Dis. 57 (4), 1087–1103. 10.3233/JAD-160726 - DOI - PMC - PubMed

LinkOut - more resources