Celastrol promotes apoptotic cell death in children neuroblastoma cells through caspases dependent pathway
- PMID: 36378044
- PMCID: PMC9924766
- DOI: 10.19852/j.cnki.jtcm.20220425.002
Celastrol promotes apoptotic cell death in children neuroblastoma cells through caspases dependent pathway
Abstract
Objective: To investigate the in-depth pharma-cological mechanisms of celastrol in children neuro-blastoma treatment.
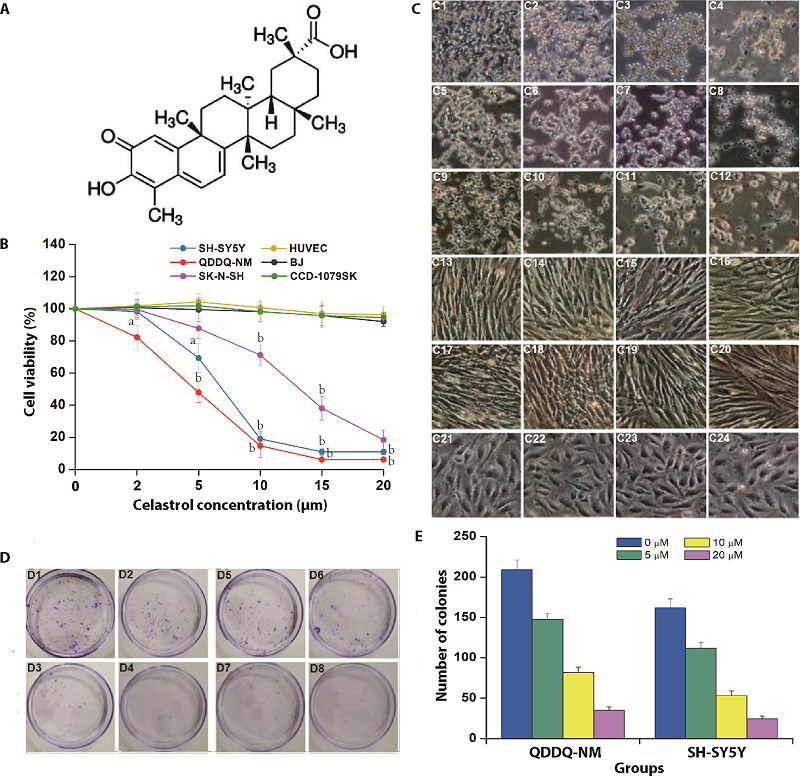
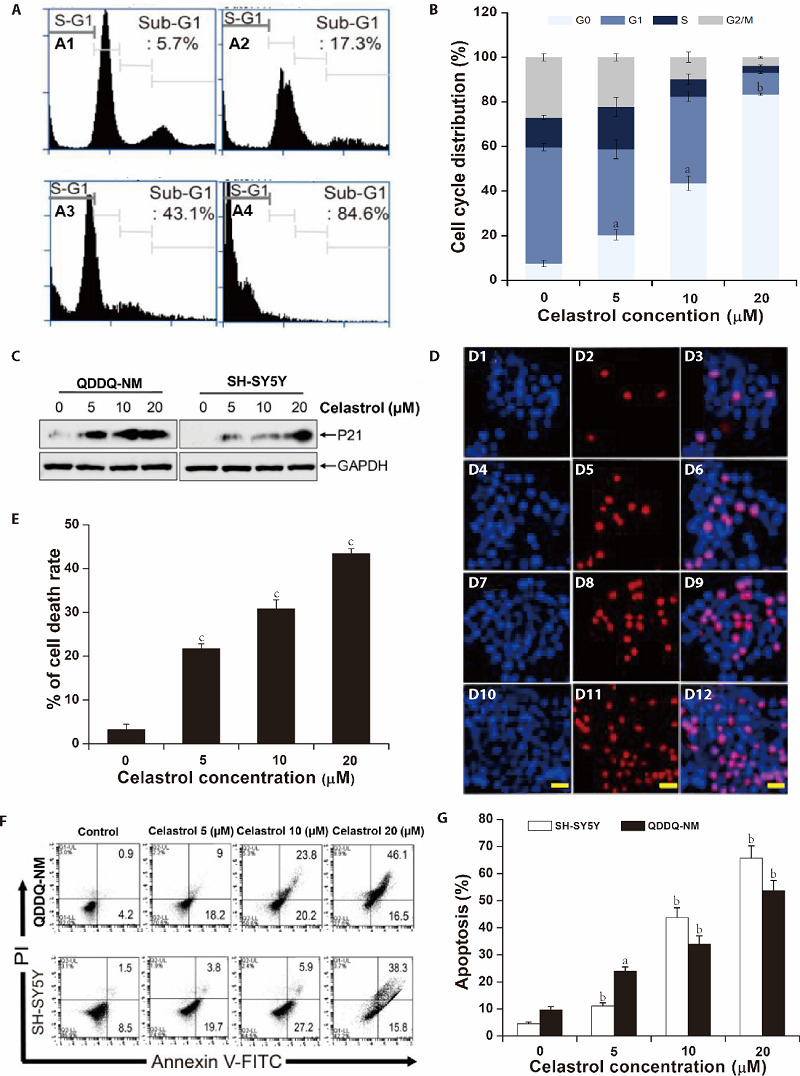
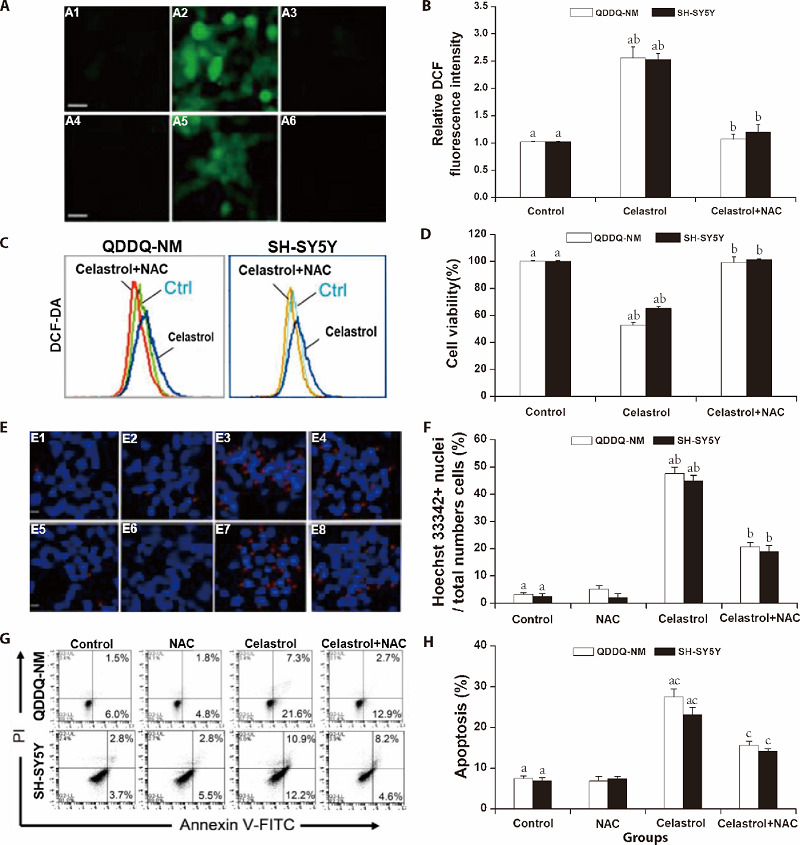
Methods: In the current study, we examined the effects of celastrol on children neuroblastoma cells viability and proliferation by cell counting kit-8 assay and colony formation assay. Annexin V-FTIC and PI staining were applied to determine cell apoptosis after celastrol treatment. ROS generation levels were examined by 2', 7'-dichloroflfluorescin diacetate.
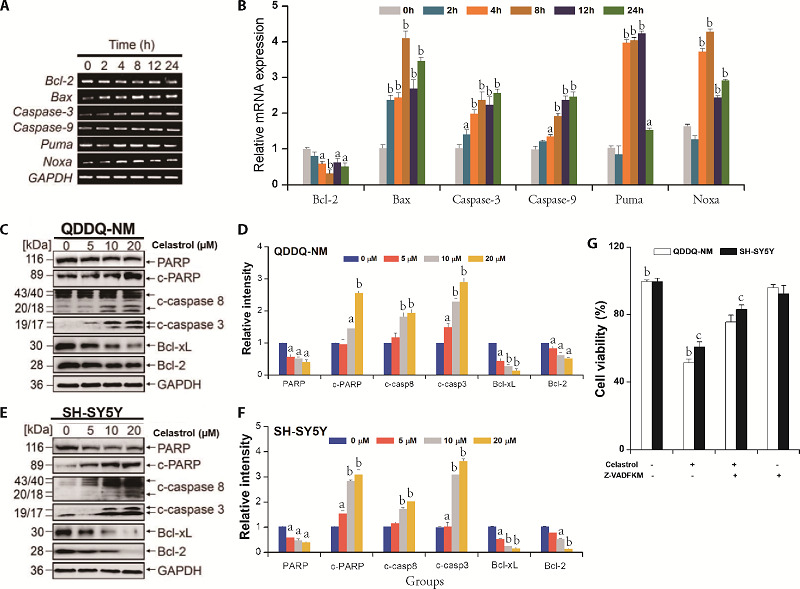
Results: We found that celastrol could suppress the proliferation of children neuroblastoma cells with few effects on normal cell lines . Further mechanisms studies have shown that celastrol inhibited cell cycle progression and induced cell apoptosis in QDDQ-NM and SH-SY5Y cells. In addition, ROS production might involve in celastrol-mediated apoptotic cell death in children neuroblastoma cells by activating caspase death pathway.
Conclusions: Our findings demonstrated that celastrol could promote ROS generation-induced apoptosis in neuroblastoma cell by activating caspase death pathway. These findings suggested that celastrol might be a potential novel anti-neuroblastoma agent with minor cytotoxicity.
Keywords: apoptosis; celastrol; child; neuroblastoma; poly (ADP-ribose) polymerases.
Figures
Similar articles
-
Celastrol inhibits growth and induces apoptotic cell death in melanoma cells via the activation ROS-dependent mitochondrial pathway and the suppression of PI3K/AKT signaling.Apoptosis. 2012 Dec;17(12):1275-86. doi: 10.1007/s10495-012-0767-5. Apoptosis. 2012. PMID: 23065091
-
Celastrol targets mitochondrial respiratory chain complex I to induce reactive oxygen species-dependent cytotoxicity in tumor cells.BMC Cancer. 2011 May 14;11:170. doi: 10.1186/1471-2407-11-170. BMC Cancer. 2011. PMID: 21569548 Free PMC article.
-
Celastrol protects human neuroblastoma SH-SY5Y cells from rotenone-induced injury through induction of autophagy.Neurochem Int. 2013 Jul;63(1):1-9. doi: 10.1016/j.neuint.2013.04.005. Epub 2013 Apr 23. Neurochem Int. 2013. PMID: 23619395
-
Celastrol induces apoptosis and autophagy via the ROS/JNK signaling pathway in human osteosarcoma cells: an in vitro and in vivo study.Cell Death Dis. 2015 Jan 22;6(1):e1604. doi: 10.1038/cddis.2014.543. Cell Death Dis. 2015. PMID: 25611379 Free PMC article.
-
Tolfenamic acid inhibits neuroblastoma cell proliferation and induces apoptosis: a novel therapeutic agent for neuroblastoma.Mol Carcinog. 2013 May;52(5):377-86. doi: 10.1002/mc.21866. Epub 2011 Dec 28. Mol Carcinog. 2013. PMID: 22213339
Cited by
-
Recent Trends in anti-tumor mechanisms and molecular targets of celastrol.Int J Biol Sci. 2024 Oct 7;20(14):5510-5530. doi: 10.7150/ijbs.99592. eCollection 2024. Int J Biol Sci. 2024. PMID: 39494324 Free PMC article. Review.
References
-
- Polito L, Bortolotti M, Pedrazzi M, Mercatelli D, Battelli MG, Bolognesi A. . Apoptosis and necroptosis induced by stenodactylin in neuroblastoma cells can be completely prevented through caspase inhibition plus catalase or necrostatin-1. Phytomedicine 2016; 23: 32-41. - PubMed
-
- Naveen CR, Gaikwad S, Agrawal-Rajput R.. Berberine induces neuronal differentiation through inhibition of cancer stemness and epithelial-mesenchymal transition in neuroblastoma cells. Phytomedicine 2016; 23: 736-44. - PubMed
-
- Fukuyama K, Kakio S, Nakazawa Y, et al. . Roasted coffee reduces beta-amyloid production by increasing proteasomal beta-secretase degradation in human neuroblastoma SH-SY5Y cells. Mol Nutr Food Res 2018; 62: e1800238. - PubMed
-
- Unno K, Pervin M, Nakagawa A, et al. . Blood-brain barrier permeability of green tea catechin metabolites and their neuritogenic activity in human neuroblastoma SH-SY5Y cells. Mol Nutr Food Res 2017; 61. - PubMed
Publication types
MeSH terms
Substances
LinkOut - more resources
Full Text Sources
Medical
Research Materials
Miscellaneous