. 2022 Nov;611(7935):380-386.
doi: 10.1038/s41586-022-05366-w. Epub 2022 Oct 26.

Bending forces and nucleotide state jointly regulate F-actin structure

Affiliations

Bending forces and nucleotide state jointly regulate F-actin structure

Matthew J Reynolds et al. Nature. 2022 Nov.

Abstract

ATP-hydrolysis-coupled actin polymerization is a fundamental mechanism of cellular force generation1-3. In turn, force4,5 and actin filament (F-actin) nucleotide state6 regulate actin dynamics by tuning F-actin's engagement of actin-binding proteins through mechanisms that are unclear. Here we show that the nucleotide state of actin modulates F-actin structural transitions evoked by bending forces. Cryo-electron microscopy structures of ADP-F-actin and ADP-Pi-F-actin with sufficient resolution to visualize bound solvent reveal intersubunit interfaces bridged by water molecules that could mediate filament lattice flexibility. Despite extensive ordered solvent differences in the nucleotide cleft, these structures feature nearly identical lattices and essentially indistinguishable protein backbone conformations that are unlikely to be discriminable by actin-binding proteins. We next introduce a machine-learning-enabled pipeline for reconstructing bent filaments, enabling us to visualize both continuous structural variability and side-chain-level detail. Bent F-actin structures reveal rearrangements at intersubunit interfaces characterized by substantial alterations of helical twist and deformations in individual protomers, transitions that are distinct in ADP-F-actin and ADP-Pi-F-actin. This suggests that phosphate rigidifies actin subunits to alter the bending structural landscape of F-actin. As bending forces evoke nucleotide-state dependent conformational transitions of sufficient magnitude to be detected by actin-binding proteins, we propose that actin nucleotide state can serve as a co-regulator of F-actin mechanical regulation.


Conflict of interest statement

The authors declare no competing interests.

Figures
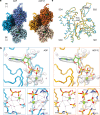
Fig. 1
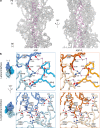
Fig. 1. Nucleotide cleft water networks are remodelled upon phosphate release by F-actin.
a, Cryo-EM maps of ADP–F-actin (left, shades of blue) and ADP-Pi–F-actin (right, shades of orange). ADP (green) and water (magenta) densities are shown. BE, barbed end; PE, pointed end. b, Atomic models of the ADP–F-actin (blue) and ADP-Pi–F-actin nucleotide (nuc.) clefts (orange) are shown in Cα representation. Top, carved transparent grey density is displayed for ADP (green), PO43− (yellow), Mg2+ (light green) and water molecules (violet). In ADP/PO43−, nitrogen atoms are blue, oxygen atoms are red and phosphorous atoms are yellow. Bottom, the backbone and side chain residues involved in putative hydrogen-bonding networks (dashed lines) are displayed and coloured by heteroatom. c, Superposition of individual ADP–F-actin (blue) and ADP-Pi–F-actin (orange) protomers, displayed in Cα representation.
Fig. 2
Fig. 2. Water molecules mediate key longitudinal and lateral contacts in F-actin.
a, Water molecules (violet) contained within the filament core of ADP–F-actin. Actin subunits are shown in transparent grey main-chain representation. b, Solvent-mediated contacts at lateral (top) and longitudinal (bottom) interfaces in ADP–F-actin (shades of blue) and ADP-Pi–F-actin (shades of orange). Key side chains and backbone atoms are displayed and coloured by heteroatom. Water molecules are shown in violet, and putative hydrogen bonds are indicated by dashed lines. Protomer indices are indicated.
Fig. 3
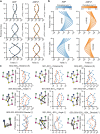
Fig. 3. Cryo-EM reconstructions of mechanically deformed F-actin reveal bend–twist coupling.
a, Representative cryo-EM micrograph of ADP–F-actin filaments featuring high-curvature regions, low-pass filtered to 30 Å. Picked segments are coloured by estimated curvature as indicated. Scale bar, 100 nm. b, Normalized curvature histograms of ADP–F-actin (blue, n = 374,942) and ADP-Pi–F-actin (orange, n = 470,625) filament segments, compared using a two-tailed Mann–Whitney U-test. The dashed lines indicate curvature thresholds for straight (≤2.0 μm−1) and bent (≥2.5 μm−1) segments. The colour bars correspond to the curvature key in a. c, Helically symmetric ADP–F-actin (left map) and cryoDRGN reconstructions sampling continuous bending of ADP–F-actin (right three maps), low-pass filtered to 8 Å. Strands are coloured in shades of blue. Scale bar, 10 nm. d, Stitched volumes of straight and bent maps from c, aligned to the bottom 16 protomers. Scale bar, 100 nm. e, Schematic of twist and rise measurements along a bent filament axis. Protomer numbering is indicated. f, Twist and rise measurements of cryoDRGN reconstructions sampled along the major variability component. The solid and dashed curves correspond to measurements from even-to-odd and odd-to-even protomer indices, respectively. Source data
Fig. 4
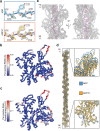
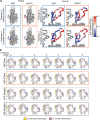
Fig. 4. Actin nucleotide state modulates subunit shearing during filament bending.
a, Cryo-EM maps of bent ADP–F-actin (blue) and ADP-Pi–F-actin (orange), coloured by strand. Protomer numbering is indicated. The dashed and solid lines represent the convex and concave sides of the bent filament, respectively. b, Ribbon representation of an individual actin protomer coloured by subdomain (left). The spheres connected by bars indicate subdomain centroids. Right, protomer subdomain centroid diagrams with vectors (scaled 100×), indicating subdomain-averaged displacements from the corresponding helically symmetric model. c, Plots of subdomain shear indices (representing coordinated rearrangements) of subdomains 1 and 4 (top) and subdomains 2 and 3 (bottom). Blue lines, ADP; orange lines, ADP-Pi. The solid and dashed lines represent even (concave side) and odd (convex side) protomers, respectively. AU, arbitrary units. d, Cα representation of the indicated protomers’ nucleotide clefts from bent ADP–F-actin and ADP-Pi–F-actin, coloured by per-residue strain pseudoenergy. ADP (dark green), magnesium (light green) and phosphate (orange) are shown in stick representation. e, Quantification of each protomer’s nucleotide cleft strain pseudoenergy, compared between nucleotide states and bending conditions (top). Bottom, equivalent quantification of solvent-accessible volume of nucleotide clefts. Data are mean ± 95% confidence interval. n = 7 (bent) and n = 14 (straight). Statistical comparison was performed using one-way analysis of variance with Tukey post hoc analysis; P values were corrected for multiple comparisons. f, Cartoon model of the steric boundary mechanism for joint regulation of F-actin by bending forces and nucleotide state. Source data
Extended Data Fig. 1
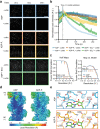
Extended Data Fig. 1. Validation of ADP–Pi-F-actin preparation and helically symmetric reconstructions.
a, Representative TIRF-microscopy video frames from cofilin severing assays. Cofilin-free controls are shown in the top row of each condition, indicated by a darker border. Scale bar, 40 μm. b, Quantification of TIRF videos showing the average normalized actin channel intensity. Error margin in graph indicates +/− 95% CI. Half-lives represent exponential decay at time 0 s, with 95% CI, and n values represent independent experiments: ADP–F-actin - cofilin (778 ± 24 s, n = 3); ADP-Pi–F-actin - cofilin (454 ± 14 s, n = 3); ADP-sulfate–F-actin - cofilin (348 ± 16 s, n = 3); ADP–F-actin + cofilin (50.4 ± 2.1 s, n = 4); ADP-Pi–F-actin + cofilin (177.5 ± 10.3 s, n = 3); ADP-sulfate–F-actin + cofilin (86.8 ± 2.5 s, n = 3). c, Half-map (left) and map-to-model (right) Fourier Shell Correlation (FSC) curves for helically symmetric reconstructions of ADP- and ADP-Pi-F-actin. d, Local resolution assessment of helically symmetric ADP–F-actin and ADP-Pi–F-actin. PE: pointed end; BE: barbed end. e, Potential hydrogen-bonding networks adjacent to the nucleosidyl region of ADP. Key side chains and back bone atoms participating in hydrogen-bonding networks are displayed and coloured by heteroatom. Source data
Extended Data Fig. 2
Extended Data Fig. 2. Additional analysis of helically symmetric ADP–F-actin and ADP-Pi–F-actin models.
a, Example cryo-EM map density superimposed with atomic model residues A131–A135 from ADP–F-actin (top) and ADP–Pi-F-actin (bottom). b, Individual ADP–F-actin protomer shown in Cα representation, coloured by per-residue RMSD between ADP–F-actin and ADP-Pi–F-actin. c, Same as b, but coloured by per-residue strain pseudo-energy. d, Superposition of extended 31-protomer ADP- (blue) and ADP-Pi-F-actin (orange) models, aligned at the terminal barbed end protomer. e, Water molecules (violet) contained within the ADP-Pi–F-actin filament’s core. Actin subunits are shown in transparent grey backbone representation. PE: pointed end; BE: barbed end.
Extended Data Fig. 3
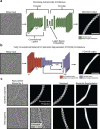
Extended Data Fig. 3. Neural network architecture and example performance.
a, Neural network architecture diagram for denoising auto-encoder. Example network input and output is displayed for a representative extracted segment. b, Network architecture diagram for semantic segmentation fully convolutional network. Example input and output for a representative extracted segment is shown. c, Representative network performance on filament segments from synthetic projections (top) and experimental cryo-EM micrographs (bottom). Scale bars, 20 nm.
Extended Data Fig. 4
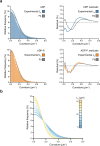
Extended Data Fig. 4. Boltzmann modelling of filament segment curvature distributions.
a, Curvature distributions (left column) of ADP–F-actin (top) and ADP–Pi-F-actin (bottom) with modelled thermal bending probability distributions. Residual plots (right column) between the measured and theoretical distributions. Grey curves correspond to adjusted bending models fit with a multiplicative parameter in the energy term. b, Theoretical probability distributions of 500 Å elastic rods bending due to thermal fluctuations, modelled as Boltzmann distributions. Varying the persistence length between 5 μm and 15 μm demonstrates the effect of filament bending stiffness. Source data
Extended Data Fig. 5
Extended Data Fig. 5. Additional analysis of filament bending deformations.
a, Helically symmetric ADP-Pi–F-actin (left map) and cryoDRGN reconstructions sampling ADP-Pi–F-actin bending (right three maps). Maps are lowpass filtered to 8 Å, and strands are coloured in shades of orange. PE: pointed end; BE: barbed end. Scale bar, 10 nm. b, Stitched volumes of straight and bent maps from a, aligned on the bottom 16 protomers. Scale bar, 100 nm. c, Projections of zeroth (cyan) and ninth (magenta) cryoDRGN reconstructions from ADP–F-actin (left) and ADP-Pi–F-actin (right) aligned on the bottom protomer and oriented to display maximum displacement. d, Asymmetric reconstructions of ADP–F-actin from indicated curvature bins. Scale bar, 10 nm. e, Plots of central axis deviations from straight lines in ADP–F-actin and ADP-Pi–F-actin cryoDRGN reconstructions. First and second columns show principal component analysis of the cryoDRGN reconstructions’ central axes. Third column shows displacement of the cryoDRGN reconstructions’ central axes from straight lines which were aligned to the barbed-end terminal 56 Å of the central axes. f, Half-map Fourier Shell Correlation (FSC) curves for control asymmetric 16-protomer reconstructions. g, Twist and rise measurements of control asymmetric 16-protomer reconstructions. Source data
Extended Data Fig. 6
Extended Data Fig. 6. Quantitation of lattice architectural remodelling during filament bending.
a, Plots of travelling wave equation fits (black lines) with measured twist values (coloured points) from cryoDRGN reconstructions of different curvatures. b, Plots of twist travelling wave function at various curvatures, separated by strand. c, Plots of intra-strand, inter-strand, and intra-protomer subdomain distances and angles from ISOLDE models of the most curved cryoDRGN reconstructions of ADP–F-actin (blue) and ADP-Pi–F-actin (orange). Solid and dashed lines represent even (concave side) and odd (convex side) protomers, respectively. Source data
Extended Data Fig. 7
Extended Data Fig. 7. Resolution assessment and validation of high-resolution bent F-actin asymmetric reconstructions.
a, Local resolution assessment of bent ADP–F-actin and ADP-Pi–F-actin reconstructions, as well as two independent straight ADP–F-actin controls. PE: pointed end; BE: barbed end. b, Half-map (left) and map-to-model (right) Fourier Shell Correlation (FSC) curves for asymmetric bent ADP–F-actin, ADP-Pi–F-actin, and straight ADP–F-actin controls. c, 3D-FSC curves for asymmetric reconstructions, which indicate equivalently isotropic resolution between bent and straight reconstructions. Dotted green lines indicate +/− 1 s.d. from average FSC. d, Vector plots (coloured by direction and scaled 6X) representing Cα displacements between helically symmetric models and those built into indicated asymmetric reconstructions, aligned on the central protomer. Source data
Extended Data Fig. 8
Extended Data Fig. 8. Strain and flexibility of inter-protomer contact sites in bent F-actin.
a, Grey Cα representations of indicated protomers from bent F-actin, locally coloured by computed per-residue strain pseudo-energy relative to helically symmetric models on their H-plugs (left) and D-loops (right). b, D-loop heterogeneity in asymmetric F-actin maps. Local density around each of the unique D-loops from the asymmetric reconstructions are shown with a docked PDB model of ADP–F-actin (7R8V) featuring both “in” and “out” D-loop conformations. Source data
Extended Data Fig. 9
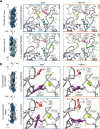
Extended Data Fig. 9. Steric encounters at inter-subunit interfaces transduce filament bending strain to protomers.
a, Longitudinal interfaces and b, lateral interfaces of bent ADP–F-actin (left) and ADP-Pi–F-actin (right). Solid and dashed borders represent inside (concave) and outside (convex) of curve, respectively. Transparent arrows represent individual Cα displacements from helically symmetric models scaled 6X, and solid arrows show averaged displacements of indicated regions scaled 20X. PE: pointed end; BE: barbed end.
Extended Data Fig. 10
Extended Data Fig. 10. F-actin bending remodels inter-subunit interfaces engaged by ABPs.
a, Cα representations of inner strand protomer 6-protomer 8 (concave, cornflower blue) and outer strand protomer 7-protomer 9 (convex, light blue) longitudinal interfaces extracted from the most curved ADP–F-actin cryoDRGN 16-protomter atomic model, superimposed on the barbed end subunit of 2 protomers extracted from the ADP–F-actin helical model (grey). Box encloses a region featuring major contacts by ABPs. BE: barbed end; PE: pointed end. Actin subdomains are indicated. b, Binding interfaces of indicated ABPs (pink space filling model) are displayed superimposed on the bent interfaces from a. Cofilin, PDB 5YU8; coronin, EMDB 6100 / PDB 2AQ5; ARP2/3, PDB 7TPT; α-catenin, PDB 6UPV; myosin-5, PDB 7PLT.

Comment in

  • Catching actin proteins in action.
    Cossio P, Hocky GM. Cossio P, et al. Nature. 2022 Nov;611(7935):241-243. doi: 10.1038/d41586-022-03343-x. Nature. 2022. PMID: 36289412 No abstract available.

Similar articles

Cited by

References

    1. Pollard TD, Borisy GG. Cellular motility driven by assembly and disassembly of actin filaments. Cell. 2003;112:453–465. - PubMed
    1. Mogilner A, Oster G. Cell motility driven by actin polymerization. Biophys. J. 1996;71:3030–3045. - PMC - PubMed
    1. Mogilner A, Oster G. Force generation by actin polymerization II: the elastic ratchet and tethered filaments. Biophys. J. 2003;84:1591–1605. - PMC - PubMed
    1. Jégou A, Romet-Lemonne G. Mechanically tuning actin filaments to modulate the action of actin-binding proteins. Curr. Opin. Cell Biol. 2021;68:72–80. - PubMed
    1. Sun, X. & Alushin, G. M. Cellular force-sensing through actin filaments. FEBS J.10.1111/febs.16568 (2022). - PMC - PubMed

Publication types

LinkOut - more resources