

Does normalization of SARS-CoV-2 concentrations by Pepper Mild Mottle Virus improve correlations and lead time between wastewater surveillance and clinical data in Alberta (Canada): comparing twelve SARS-CoV-2 normalization approaches
- PMID: 36167131
- PMCID: PMC9508694
- DOI: 10.1016/j.scitotenv.2022.158964
Does normalization of SARS-CoV-2 concentrations by Pepper Mild Mottle Virus improve correlations and lead time between wastewater surveillance and clinical data in Alberta (Canada): comparing twelve SARS-CoV-2 normalization approaches
Abstract
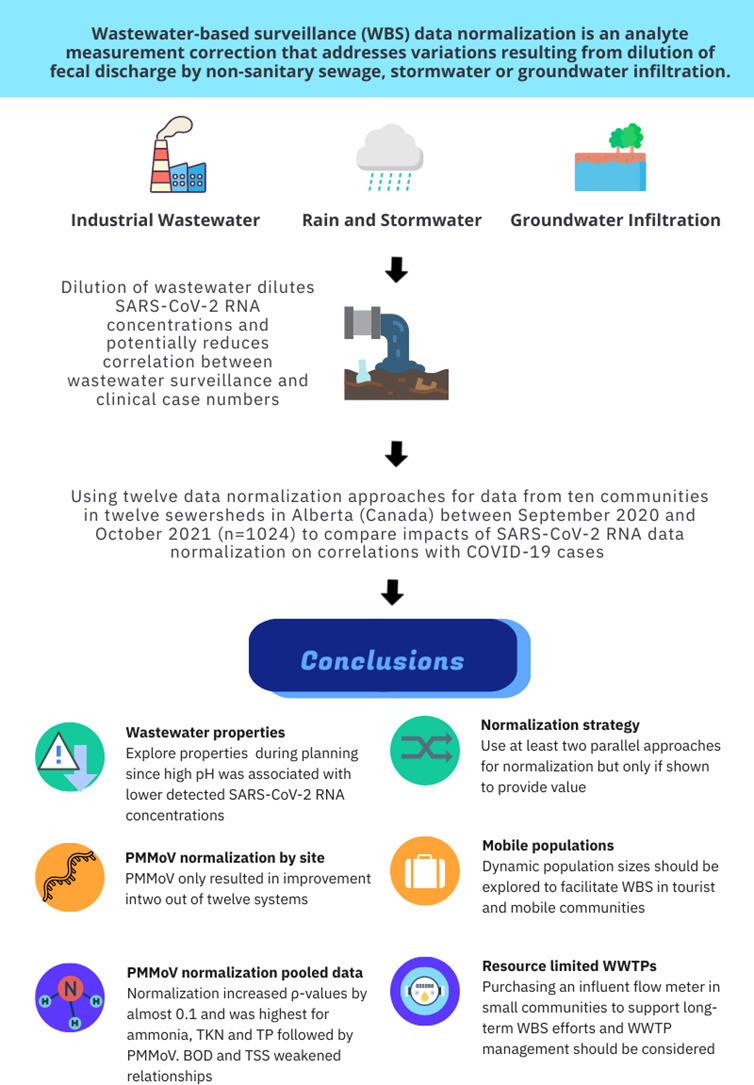
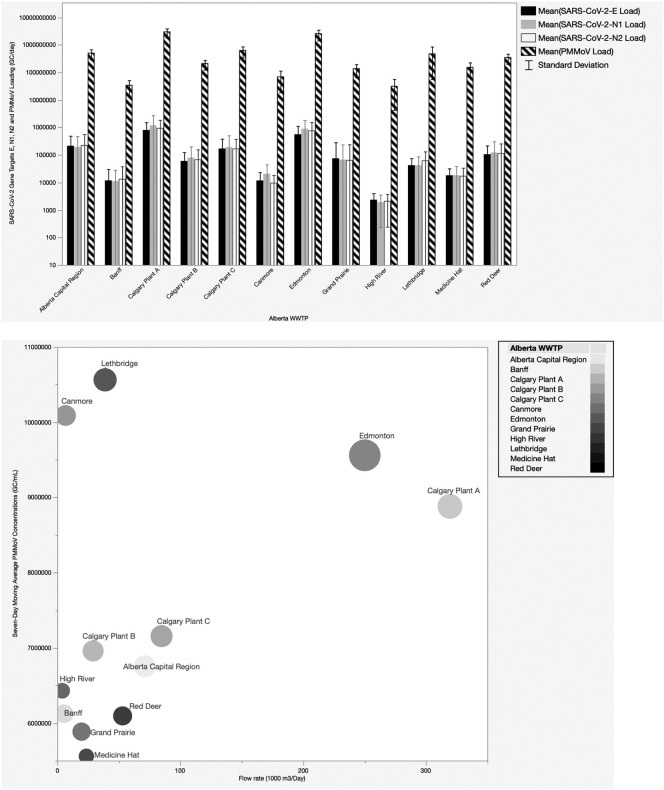
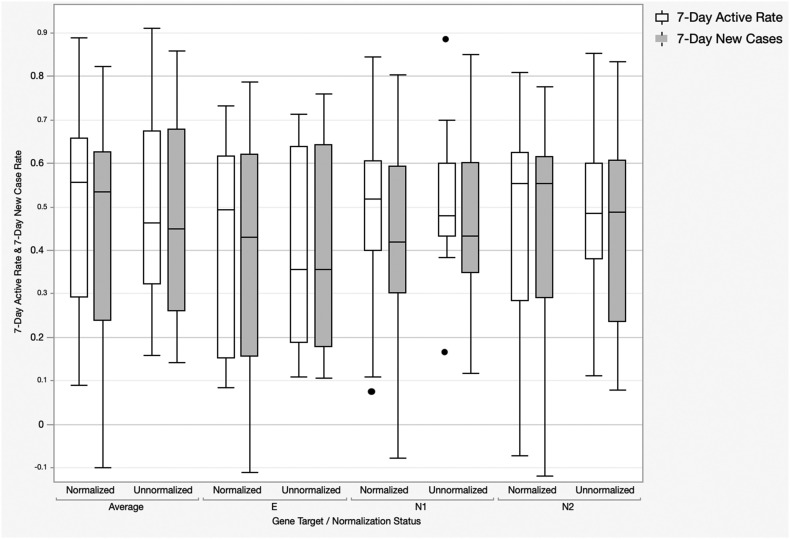
Wastewater-based surveillance (WBS) data normalization is an analyte measurement correction that addresses variations resulting from dilution of fecal discharge by non-sanitary sewage, stormwater or groundwater infiltration. No consensus exists on what WBS normalization parameters result in the strongest correlations and lead time between SARS-CoV-2 WBS data and COVID-19 cases. This study compared flow, population size and biomarker normalization impacts on the correlations and lead times for ten communities in twelve sewersheds in Alberta (Canada) between September 2020 and October 2021 (n = 1024) to determine if normalization by Pepper Mild Mottle Virus (PMMoV) provides any advantages compared to other normalization parameters (e.g., flow, reported and dynamic population sizes, BOD, TSS, NH3, TP). PMMoV concentrations (GC/mL) corresponded with plant influent flows and were highest in the urban centres. SARS-CoV-2 target genes E, N1 and N2 were all negatively associated with wastewater influent pH, while PMMoV was positively associated with temperature. Pooled data analysis showed that normalization increased ρ-values by almost 0.1 and was highest for ammonia, TKN and TP followed by PMMoV. Normalization by other parameters weakened associations. None of the differences were statistically significant. Site-specific correlations showed that normalization of SARS-CoV-2 data by PMMoV only improved correlations significantly in two of the twelve systems; neither were large sewersheds or combined sewer systems. In five systems, normalization by traditional wastewater strength parameters and dynamic population estimates improved correlations. Lead time ranged between 1 and 4 days in both pooled and site-specific comparisons. We recommend that WBS researchers and health departments: a) Investigate WWTP influent properties (e.g., pH) in the WBS planning phase and use at least two parallel approaches for normalization only if shown to provide value; b) Explore normalization by wastewater strength parameters and dynamic population size estimates further; and c) Evaluate purchasing an influent flow meter in small communities to support long-term WBS efforts and WWTP management.
Keywords: COVID-19; Combined sewers; Industrial wastewater; Mobile populations; Normalization; Wastewater-based epidemiology (WBE).
Copyright © 2022. Published by Elsevier B.V.
Conflict of interest statement
Declaration of competing interest The authors declare that they have no known competing financial interests or personal relationships that could have appeared to influence the work reported in this paper.
Figures
Similar articles
-
Assessment of seasonality and normalization techniques for wastewater-based surveillance in Ontario, Canada.Front Public Health. 2023 Aug 30;11:1186525. doi: 10.3389/fpubh.2023.1186525. eCollection 2023. Front Public Health. 2023. PMID: 37711234 Free PMC article.
-
Effective method to mitigate impact of rain or snowmelt sewer flushing events on wastewater-based surveillance measurements.Sci Total Environ. 2024 Dec 15;956:177351. doi: 10.1016/j.scitotenv.2024.177351. Epub 2024 Nov 5. Sci Total Environ. 2024. PMID: 39489448
-
Biomarkers selection for population normalization in SARS-CoV-2 wastewater-based epidemiology.Water Res. 2022 Sep 1;223:118985. doi: 10.1016/j.watres.2022.118985. Epub 2022 Aug 15. Water Res. 2022. PMID: 36030667 Free PMC article.
-
Role of pepper mild mottle virus as a tracking tool for fecal pollution in aquatic environments.Arch Microbiol. 2022 Jul 22;204(8):513. doi: 10.1007/s00203-022-03121-3. Arch Microbiol. 2022. PMID: 35864362 Free PMC article. Review.
-
Contextualizing Wastewater-Based surveillance in the COVID-19 vaccination era.Environ Int. 2023 Jan;171:107718. doi: 10.1016/j.envint.2022.107718. Epub 2022 Dec 23. Environ Int. 2023. PMID: 36584425 Free PMC article. Review.
Cited by
-
Predictive power of wastewater for nowcasting infectious disease transmission: A retrospective case study of five sewershed areas in Louisville, Kentucky.Environ Res. 2024 Jan 1;240(Pt 2):117395. doi: 10.1016/j.envres.2023.117395. Epub 2023 Oct 12. Environ Res. 2024. PMID: 37838198 Free PMC article.
-
Simultaneous detection and quantification of multiple pathogen targets in wastewater.medRxiv [Preprint]. 2023 Dec 5:2023.06.23.23291792. doi: 10.1101/2023.06.23.23291792. medRxiv. 2023. PMID: 37425908 Free PMC article. Preprint.
-
Wastewater-based surveillance as a tool for public health action: SARS-CoV-2 and beyond.Clin Microbiol Rev. 2024 Mar 14;37(1):e0010322. doi: 10.1128/cmr.00103-22. Epub 2023 Dec 14. Clin Microbiol Rev. 2024. PMID: 38095438 Free PMC article. Review.
-
Wastewater surveillance of SARS-CoV-2 at intra-city level demonstrated high resolution in tracking COVID-19 and calibration using chemical indicators.Sci Total Environ. 2023 Mar 25;866:161467. doi: 10.1016/j.scitotenv.2023.161467. Epub 2023 Jan 7. Sci Total Environ. 2023. PMID: 36626989 Free PMC article.
-
Dynamic SARS-CoV-2 surveillance model combining seroprevalence and wastewater concentrations for post-vaccine disease burden estimates.Commun Med (Lond). 2024 Apr 9;4(1):70. doi: 10.1038/s43856-024-00494-y. Commun Med (Lond). 2024. PMID: 38594350 Free PMC article.
References
-
- Acosta N., Bautista M.A., Hollman J., McCalder J., Beaudet A.B., Man L., et al. A multicenter study investigating SARS-CoV-2 in tertiary-care hospital wastewater. Viral burden correlates with increasing hospitalized cases as well as hospital-associated transmissions and outbreaks. Water Res. 2021;201:1–10. doi: 10.1016/j.watres.2021.117369. - DOI - PMC - PubMed
-
- Ahmed W., Angel N., Edson J., Bibby K., Bivins A., O'Brien J.W.…Mueller J.F. First confirmed detection of SARS-CoV-2 in untreated wastewater in Australia: a proof of concept for the wastewater surveillance of COVID-19 in the community. Sci. Total Environ. 2020;728:138764. doi: 10.1016/j.scitotenv.2020.138764. - DOI - PMC - PubMed
MeSH terms
Substances
Supplementary concepts
LinkOut - more resources
Full Text Sources
Medical
Miscellaneous
