. 2022 Sep 9;7(75):eadd4906.
doi: 10.1126/sciimmunol.add4906. Epub 2022 Sep 9.

Sensing of SARS-CoV-2 by pDCs and their subsequent production of IFN-I contribute to macrophage-induced cytokine storm during COVID-19

Affiliations

Sensing of SARS-CoV-2 by pDCs and their subsequent production of IFN-I contribute to macrophage-induced cytokine storm during COVID-19

Paôline Laurent et al. Sci Immunol. .

Abstract

Lung-infiltrating macrophages create a marked inflammatory milieu in a subset of patients with COVID-19 by producing a cytokine storm, which correlates with increased lethality. However, these macrophages are largely not infected by SARS-CoV-2, so the mechanism underlying their activation in the lung is unclear. Type I interferons (IFN-I) contribute to protecting the host against SARS-CoV-2 but may also have some deleterious effect, and the source of IFN-I in the lungs of infected patients is not well defined. Plasmacytoid dendritic cells (pDCs), a key cell type involved in antiviral responses, can produce IFN-I in response to SARS-CoV-2. We observed the infiltration of pDCs in the lungs of SARS-CoV-2-infected patients, which correlated with strong IFN-I signaling in lung macrophages. In patients with severe COVID-19, lung macrophages expressed a robust inflammatory signature, which correlated with persistent IFN-I signaling at the single-cell level. Hence, we observed the uncoupling in the kinetics of the infiltration of pDCs in the lungs and the associated IFN-I signature, with the cytokine storm in macrophages. We observed that pDCs were the dominant IFN-α-producing cells in response to the virus in the blood, whereas macrophages produced IFN-α only when in physical contact with infected epithelial cells. We also showed that IFN-α produced by pDCs, after the sensing of SARS-CoV-2 by TLR7, mediated changes in macrophages at both transcriptional and epigenetic levels, which favored their hyperactivation by environmental stimuli. Together, these data indicate that the priming of macrophages can result from the response by pDCs to SARS-CoV-2, leading to macrophage activation in patients with severe COVID-19.


Conflict of interest statement

Competing interests: The authors declare no other competing interests.

Figures

Fig. 1.
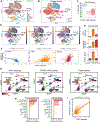
Fig. 1.. Dynamics of IFN-α and inflammatory responses in macrophages from BAL fluid and lungs of patients with COVID-19.
(A and B) UMAP representation of an scRNA-seq dataset from the BAL of patients with COVID-19 (n = 3 mild and n = 6 severe) and non–COVID-19 controls (n = 4), reanalyzed from DOI:10.1038/s41591-020-0901-9 (4), showing the inferred cell type identities (A) and the disease state of the donor (B). (C) Abundance of macrophages depending on disease state in BAL of control patients or patients with mild or severe disease. (D) UMAP plot as in (A) in each cell of the BAL showing the intensity of signatures related with IFN-I response, COVID-19 inflammation, and fibrosis. (E) Abundance of signatures from (C) for macrophages aggregated by disease state in the BAL from control patients and patients with mild and severe disease. (F) Correlation between the signatures of IFN-I response and COVID-19 inflammation across macrophage cells depending on disease state in BAL from control patients (left) and patients with mild (orange) or severe disease (red). The dashed lines mark the mean value of the signatures across all cells. (G) UMAP representation of all cells in the snRNA-seq dataset, reanalyzed from DOI:10.1038/s41586-021-03569-1, colored by the inferred activity of signatures related to IFN-I response, COVID-19 inflammation, or fibrosis from lung biopsies. (H) Correlation between signature values across single cells of the same cell type in lung biopsy from patients with COVID-19. Significance of Pearson correlation is indicated by asterisks (**) when P < 0.01, with P values adjusted with the Benjamini-Hochberg FDR method. (I) Scatterplot of the inferred activity of IFN-α and inflammatory signatures in macrophages from lung biopsies of patients with COVID-19. Statistics indicate the effect size and significance of Pearson correlation. The line indicates the trend and 95th confidence interval of the data. Note the logarithmic scale of both axes. Tregs, regulatory T cells; NK, natural killer.
Fig. 2.
Fig. 2.. IFN-I response associated with pDCs precedes inflammatory response in macrophages from BAL fluids and lungs of patients with COVID-19.
(A) Abundance of pDCs depending on disease state in BAL from DOI:10.1038/s41591-020-0901-9. (B) Abundance of IFN-I response for pDCs aggregated by disease state in BAL. (C) Inference of a pseudotime axis using diffusion maps for macrophage cells only from the BAL of healthy donors (HDs) and patients with mild or severe COVID-19. (D) Distribution of macrophage cells (top), IFN-I response signature (middle), and COVID-19 inflammatory signature (bottom) across the pseudotime axis (C) in BAL from HDs and patients with mild or severe COVID-19. (E) Heatmap of mean inferred signature activity for pDCs and macrophages from lung biopsies reanalyzed from DOI:10.1038/s41586-021-03569-1, dependent on disease status. Values were min-max scaled per signature to enable comparison. For the signatures, only windows with at least 100 cells are displayed. (F and G) IFN-I response, COVID-19 inflammatory genes, and fibrotic genes in both alveolar (F) and monocyte-derived macrophages (G) from control and COVID-19 patient lungs. Statistical significance was evaluated with a Mann-Whitney U test and P values adjusted with the Benjamini-Hochberg FDR method. *P < 0.05 and **P < 0.01. ns, not significant.
Fig. 3.
Fig. 3.. pDCs sense SARS-CoV-2 and are the main producers of IFN-I among PBMCs.
(A) pDCs purified from PBMCs of HDs were cultured for 24 hours alone [unstimulated (Unst)] or with either live SARS-CoV-2 (n = 6) or inactivated (Inact) SARS-CoV-2 (n = 29) at an MOI of 0.25. Production of IFN-α was quantified by ELISA. (B and C) pDCs purified from PBMCs of HDs (n = 6) were cultured for 24 hours with live SARS-CoV-2 at an MOI of 0.25, 0.1, or 0.01. Gene expression of SARS-CoV-2 protein E (B) and N (C) was quantified by qPCR (D and E) or inactivated influenza virus (VR-95, Flu) at an MOI of 2. Production of IFN-α was quantified by ELISA. (F and G) Total PBMCs or pDC-depleted PBMCs from HDs (n = 6) were cultured for 24 hours alone (Unst) or with live SARS-CoV-2 at an MOI of 0.25. Gene expression of SARS-CoV-2 protein E (F) and N (G) was quantified by qPCR. All results are represented as means ± SEM. Statistical significance was evaluated using a Friedman test with Dunn’s multiple comparisons posttest or a Mann-Whitney test. *P < 0.05, **P < 0.01, and ****P < 0.0001.
Fig. 4.
Fig. 4.. SARS-CoV-2–activated pDCs produce IFN-I and IFN-III via a TLR7-dependent pathway.
(A) pDCs purified from PBMCs of HDs were cultured in medium alone [unstimulated (Unst)] or with either the TLR9 ligand CpG C274 (0.5 μM) or the inactivated (Inact) SARS-CoV-2 (MOI of 0.25) for 3, 6, 10, and 18 hours (n = 4). IFN-α2 expression levels were quantified by qPCR. (B to D) pDCs purified from PBMCs of HDs (n = 4) were incubated for 6 and 18 hours either alone, with SARS-CoV-2 (MOI of 0.25), or with CpG C274 (0.5 μM). Expression of IL-6 and TNF (B) and IFN-I and IFN-III (C) was quantified by qPCR (rel Ct). (D) Heatmap was generated with the log of the mean of each gene. (E and F) Purified pDCs (E) and PBMCs (F) from HDs (n = 6) were cultured for 24 hours with medium only or with live SARS-CoV-2 at an MOI of 0.25 alone or with the TLR7 inhibitor IRS661 (2 μM). Production and gene expression of IFN-α were quantified by ELISA and qPCR, respectively. (G and H) pDCs purified from PBMCs of HDs (n = 4 to 8) were cultured for 24 hours with inactivated SARS-CoV-2 either alone or in the presence of clathrin inhibitor CPZ (30 μM) or dynamin inhibitor DH (100 μM). Production of IFN-α was quantified by ELISA (G), and SARS-CoV-2 ribonucleoprotein was quantified by qPCR (H). All results are represented as means ± SEM. Statistical significance was evaluated using a Friedman test with Dunn’s multiple comparisons posttest or a Mann-Whitney test. *P < 0.05 and **P < 0.01.
Fig. 5.
Fig. 5.. Lung macrophages are indirectly infected by SARS-CoV-2 via the phagocytosis of infected epithelial cells.
(A to E) Alveolar macrophages isolated from human primary lung tissue (Alveo-Macs) were infected or not [unstimulated (Unst)] by live SARS-CoV-2 (MOI = 0.01) for 24 hours in the upper chamber of a transwell. Gene expression of SARS-CoV-2 E (B) and N (C) and ISGs (D) was quantified by qPCR. (F to J) Alveo-Macs and live SARS-CoV-2–infected lung epithelial cells (MOI = 0.01) were cultured in the upper and lower chambers of the transwell, respectively. After 24 hours, CD68 beads were used to isolate macrophages (Mac; CD68+) and epithelial cells (EC; CD68), and gene expression of SARS-CoV-2 E (G) and subgenomic N (H) and the percentage of SARS-CoV-2 N (I)–positive cells were quantified. (G to L) Expression of ISGs was quantified in macrophages (CD68+ cells) by qPCR (J). (K to O) Alveo-Macs and live SARS-CoV-2–infected lung epithelial cells (MOI = 0.01) were cultured together for 24 hours. After the use of CD68 beads, gene expression of SARS-CoV-2 E (L) and subgenomic N (N) and the percentage of SARS-CoV-2 N–positive cells were detected in both macrophages (CD68+) and epithelial cells (EC; CD68). Expression of ISGs was quantified in macrophages (CD68+ cells) by qPCR (O). All results are represented as means ± SEM. Statistical significance was evaluated using a Friedman test with Dunn’s multiple comparisons posttest or a Mann-Whitney test. *P < 0.05 and **P < 0.01. ND, not determined.
Fig. 6.
Fig. 6.. SARS-CoV-2–activated pDCs exacerbate TLR signaling in macrophages.
(A) Macrophages purified from PBMCs of HDs were cultured for 24 hours with the supernatant from either unstimulated pDCs (Unst-pDC SN) or inactivated SARS-CoV-2–stimulated pDCs (SARS-pDC SN), followed by the addition of TLR agonists for 6 hours. (B to E) Macrophages purified from PBMCs of HDs (n = 5 to 20) were preincubated for 24 hours with the supernatant of Unst-pDC SN or SARS-pDC SN alone or followed by the addition of (B) LPS (10 ng/ml), (C) Pam3Cys (20 ng/ml), (D) poly I:C (10 μg/ml), or (E) ORN8L (60 μM) for 6 hours. Expression levels of TNF and IL-6 were quantified by qPCR. All results are represented as means ± SEM. Statistical significance was evaluated using a Friedman test with Dunn’s multiple comparisons posttest or a Mann-Whitney test. *P < 0.05, **P < 0.01, and ***P < 0.001.
Fig. 7.
Fig. 7.. SARS-CoV-2–activated pDCs exacerbate TLR signaling in macrophages via the IFN-I pathway.
(A) Macrophages purified from PBMCs of HDs (n = 4) were preincubated alone (Unst) or with either different concentrations of IFN-α as indicated (picograms per milliliter) or the supernatant of inactivated SARS-CoV-2–stimulated pDC (SARS-pDC SN), followed by the addition of LPS for 6 hours. Expression levels of TNF and IL-6 were quantified by qPCR. (B and C) Macrophages purified from PBMCs of HDs (n = 3 to 10) were preincubated for 24 hours with the supernatant of SARS-pDCs in the presence of baricitinib (2 μM) and/or anti-IFNAR antibody (2 μg/ml), followed by the addition of LPS for 6 hours. Expression levels of TNF and IL-6 were quantified by qPCR. (D to F) Macrophages purified from PBMCs of HDs (n = 5) were preincubated for 24 hours with the supernatant of SARS-pDCs in the presence of baricitinib (2 μM), followed by the addition of (C) Pam3Cys, (D) poly I:C, or (E) ORN8L for 6 hours. Expression levels of TNF and IL-6 quantified by qPCR. (F) All results are represented as means ± SEM. Statistical significance was evaluated using a Friedman test with Dunn’s multiple comparisons posttest or a Mann-Whitney test. *P < 0.05 and **P < 0.01.
Fig. 8.
Fig. 8.. IFN-α increases inflammatory transcription and chromatin accessibility in macrophages.
(A) PCA of the differentiated genes in either unstimulated (Unst), IFN-α–stimulated macrophages, or SARS-pDC SN–stimulated macrophages, followed by the addition of LPS for 3 hours (2 ng/ml) when indicated. PC1 and PC2 capture percent variation associated with either individual or combination treatments. (B) K-means clustering (K = 7) of DEGs induced by a greater than twofold change with FDR < 0.05 under the conditions shown in (A). (C) Macrophages purified from PBMCs of HDs (n = 4) were incubated for 24 hours with either Unst-pDC SN, IFN-α, or SARS-pDC SN either alone or followed by the addition of LPS. The number of genes differentiated by IFN-α, SARS-pDC SN, or LPS was normalized to that of the unstimulated condition. (D) Heatmap showing the inflammatory genes related to COVID-19 in macrophages incubated under the same conditions as in (A). (E) Top activated pathways of the differentiated genes induced by more than twofold, with FDR < 0.05 in macrophages preincubated with SARS-pDC SN and then cultured for 3 hours with LPS versus LPS alone. (F) Macrophages purified from PBMCs of HDs (n = 6) were cultured for 24 hours with either SARS-pDC SN alone or SARS-pDC SN with the TLR7 inhibitor IRS661 followed by the addition of LPS for 6 hours. Gene expression levels and production of TNF and IL-6 were quantified by qPCR and ELISA, respectively. (G) Macrophages purified from PBMCs of HDs (n = 6) were incubated alone (Unst) or with IFN-α for 24 hours. LPS was then added (when indicated) for 3 hours, and the FAIRE assay was performed on the promoter regions of IL6, TNF, and IL12p40. Results are represented as means ± SEM. Statistical significance was evaluated using a Mann-Whitney test and one-way ANOVA. *P < 0.05, **P < 0.01, and ***P < 0.001.

Similar articles

Cited by

References

    1. Dong E, Du H, Gardner L, An interactive web-based dashboard to track COVID-19 in real time. Lancet Infect. Dis 20, 533–534 (2020). - PMC - PubMed
    1. Siddiqi HK, Mehra MR, COVID-19 illness in native and immunosuppressed states: A clinical-therapeutic staging proposal. J. Heart Lung Transplant 39, 405–407 (2020). - PMC - PubMed
    1. Dölken L, Stich A, Spinner CD, Remdesivir for early COVID-19 treatment of high-risk individuals prior to or at early disease onset-lessons learned. Viruses 13, 963 (2021). - PMC - PubMed
    1. Liao M, Liu Y, Yuan J, Wen Y, Xu G, Zhao J, Cheng L, Li J, Wang X, Wang F, Liu L, Amit I, Zhang S, Zhang Z, Single-cell landscape of bronchoalveolar immune cells in patients with COVID-19. Nat. Med 26, 842–844 (2020). - PubMed
    1. Shaath H, Vishnubalaji R, Elkord E, Alajez NM, Single-cell transcriptome analysis highlights a role for neutrophils and inflammatory macrophages in the pathogenesis of severe COVID-19. Cell 9, 2374 (2020). - PMC - PubMed

Publication types