. 2022 Sep 15;185(19):3617-3636.e19.
doi: 10.1016/j.cell.2022.08.003. Epub 2022 Sep 6.

Design, construction, and in vivo augmentation of a complex gut microbiome

Affiliations

Design, construction, and in vivo augmentation of a complex gut microbiome

Alice G Cheng et al. Cell. .

Abstract

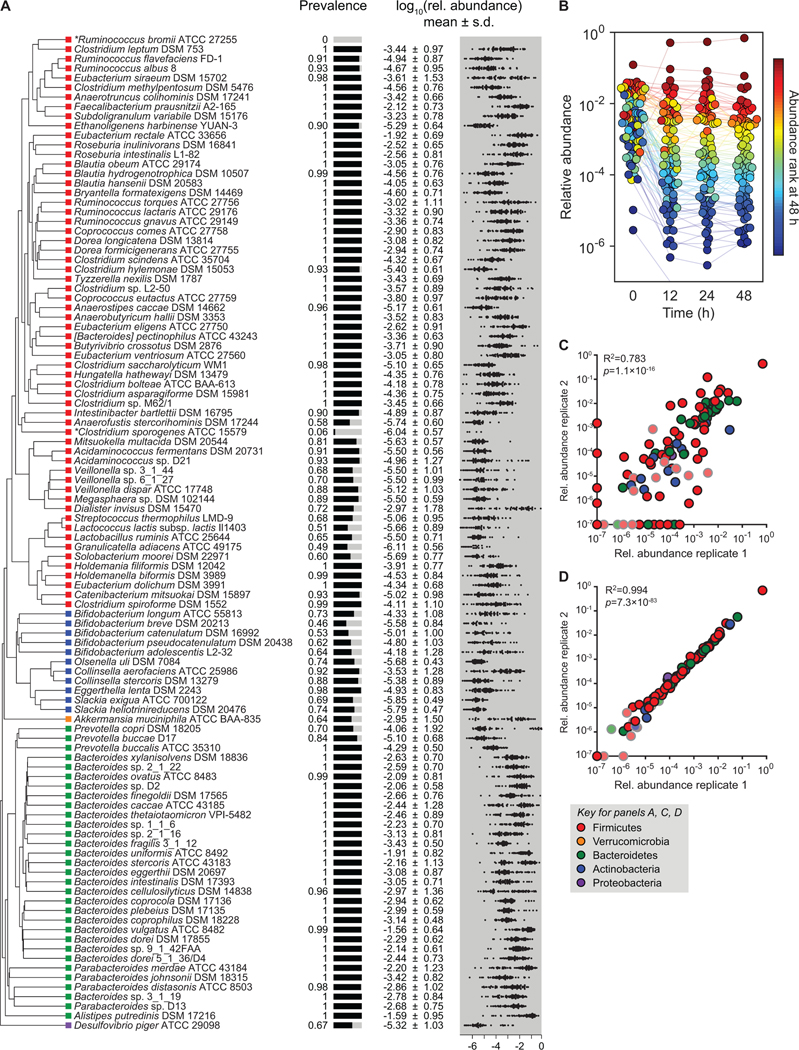
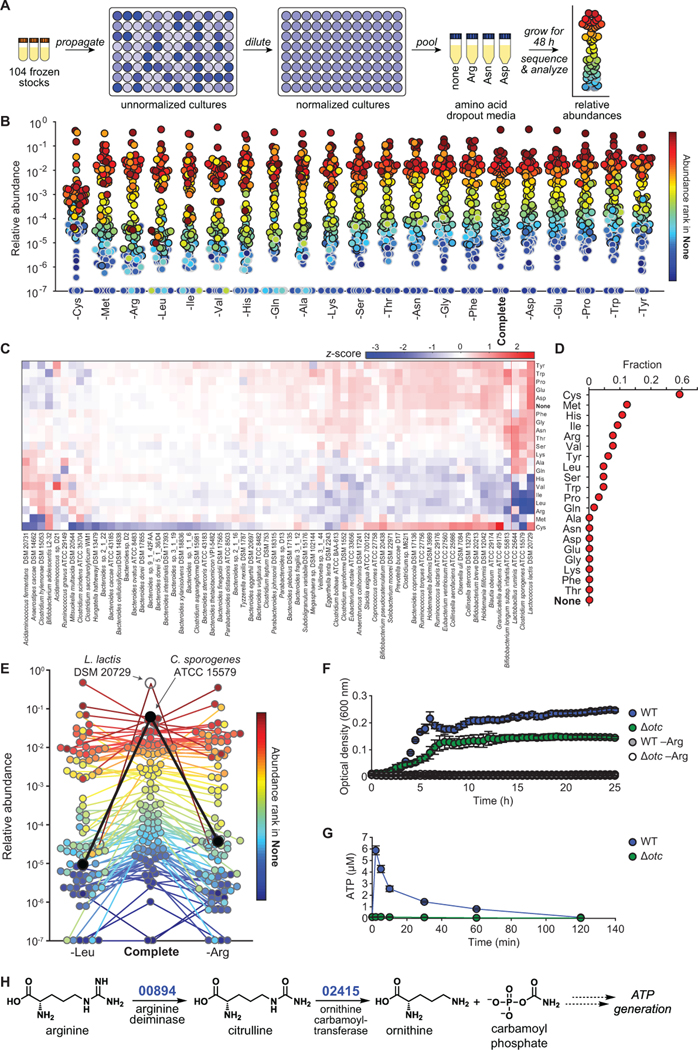
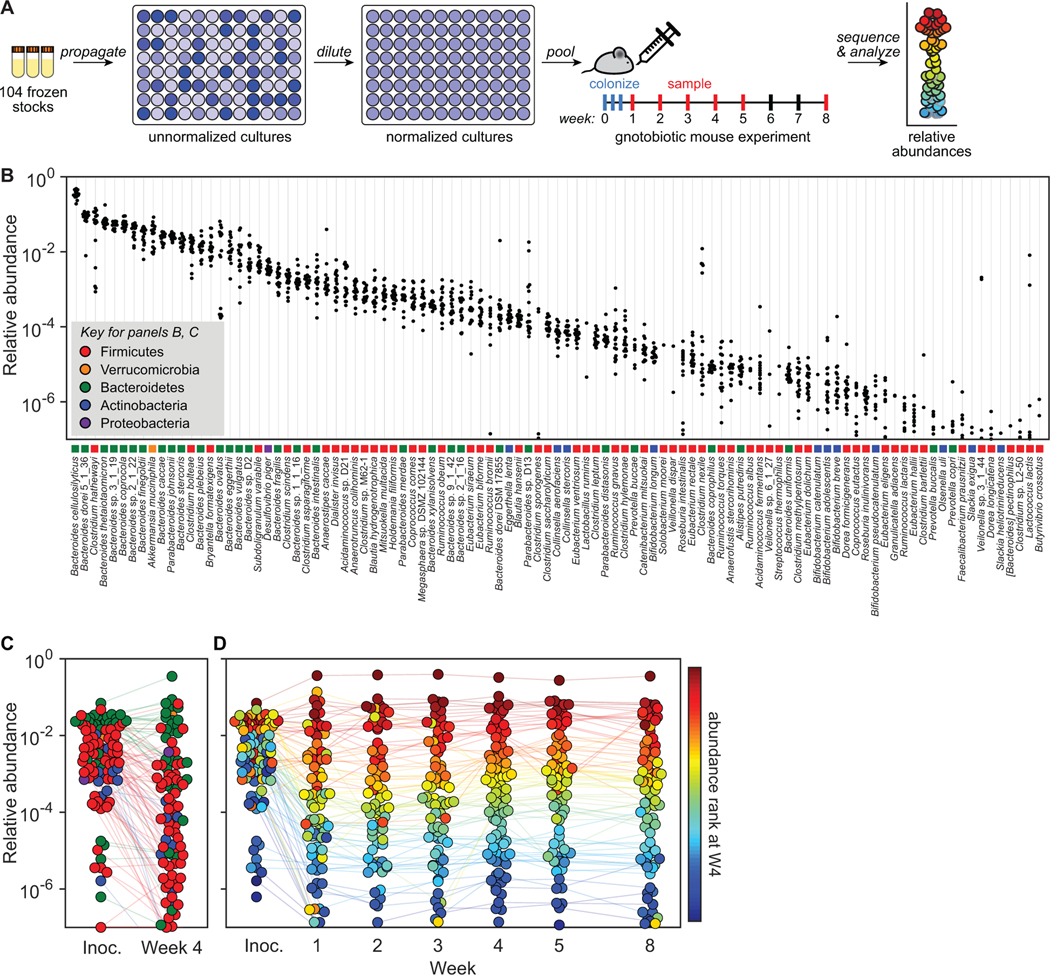
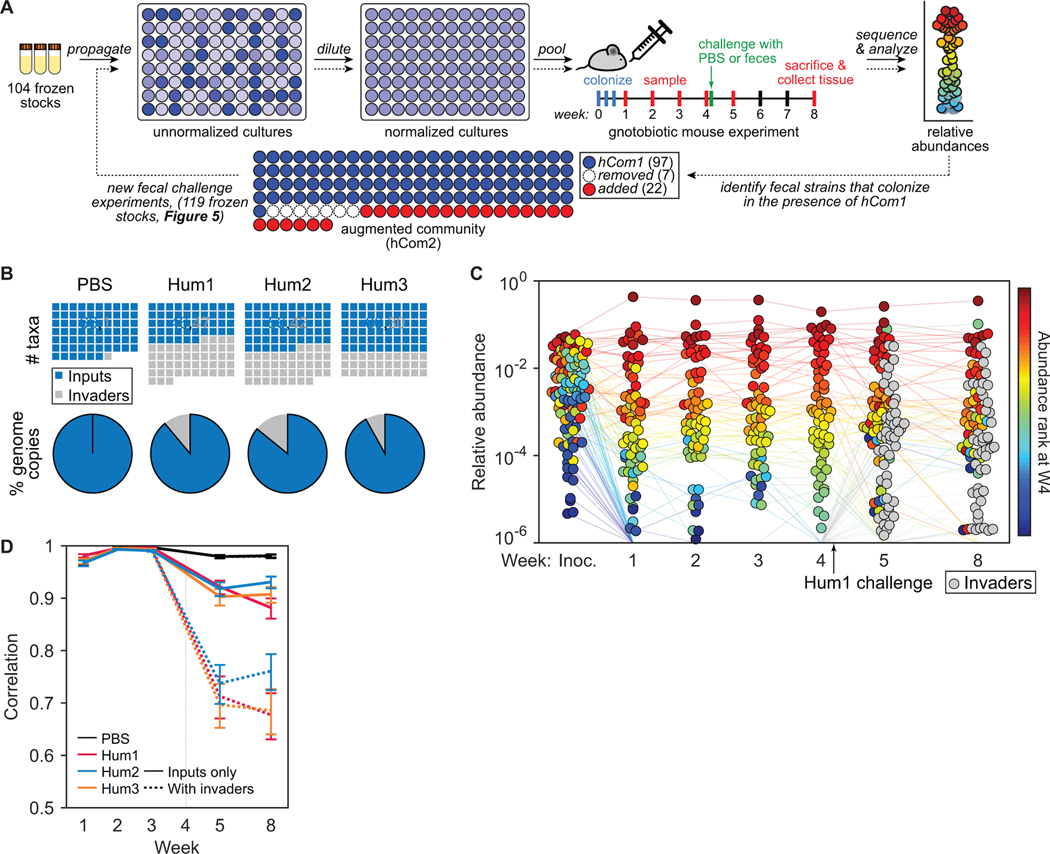
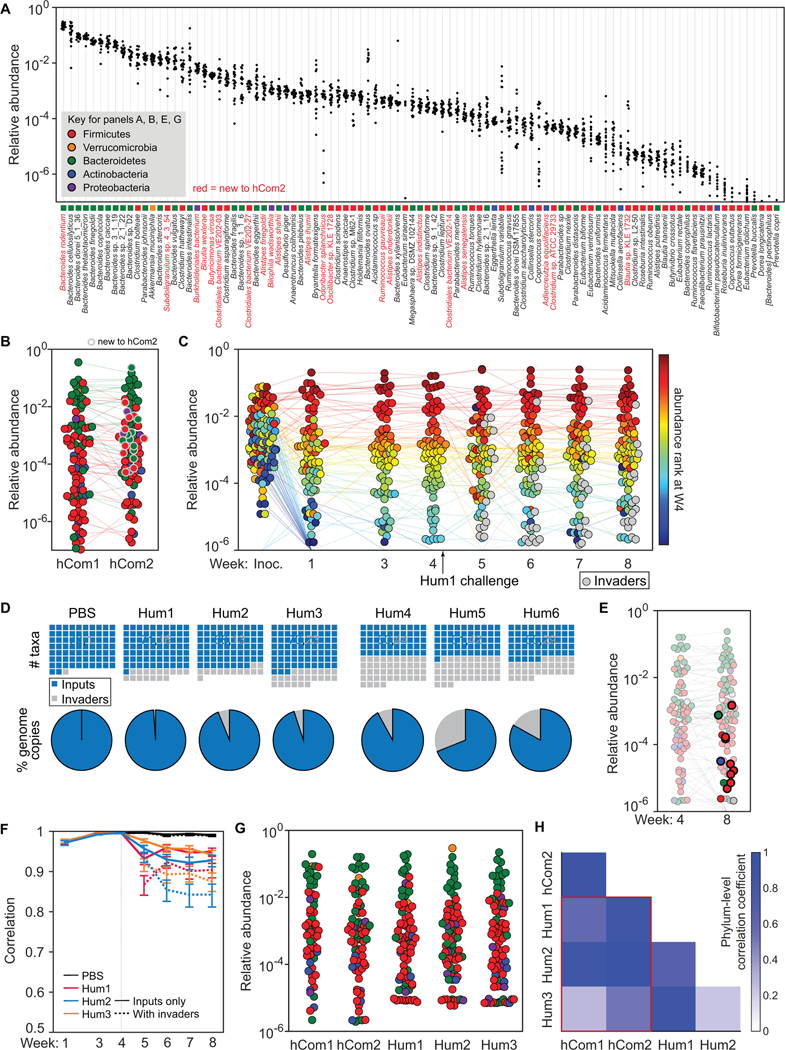
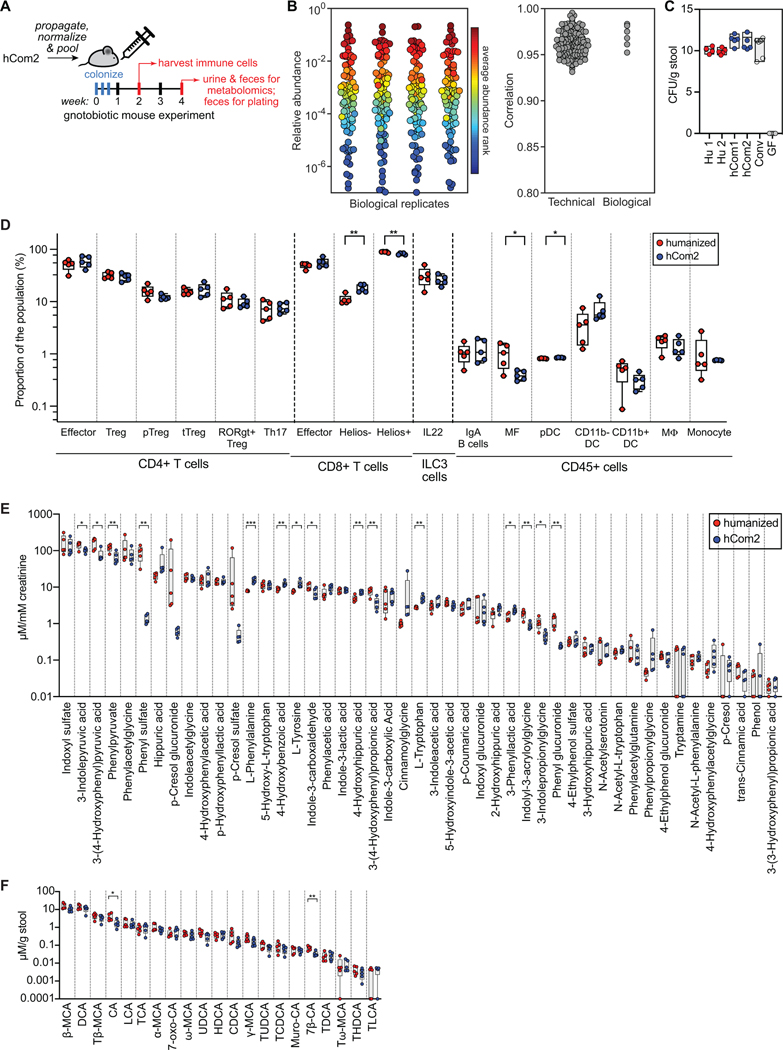
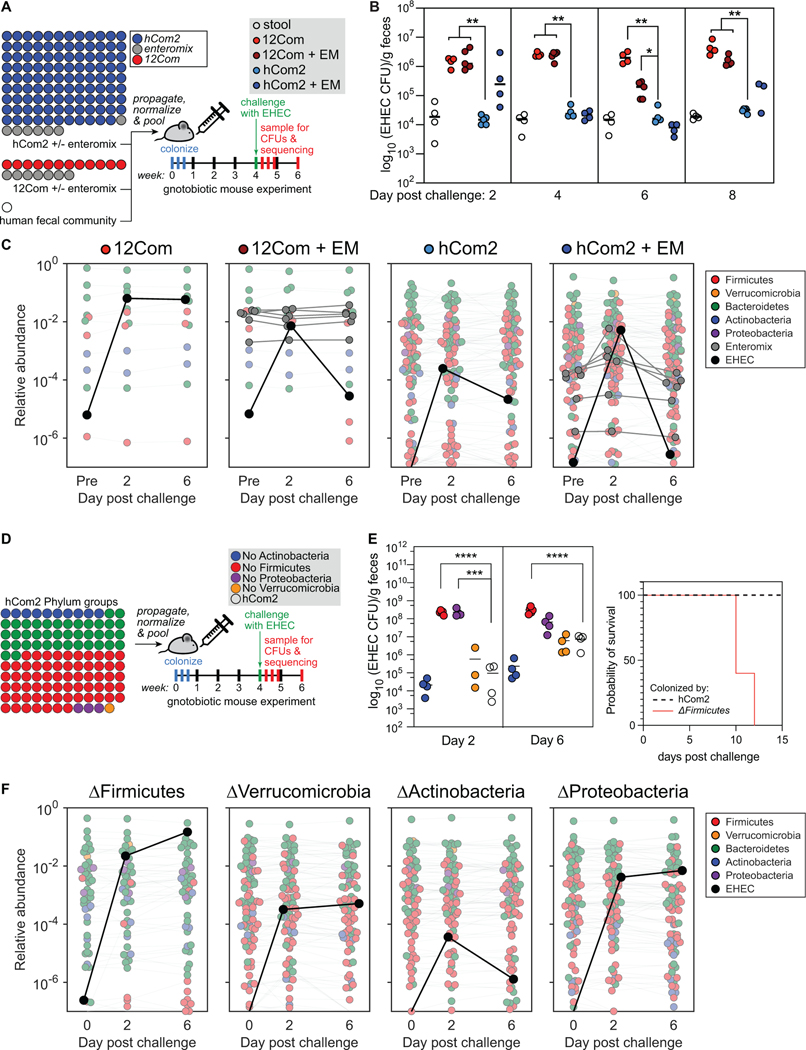
Efforts to model the human gut microbiome in mice have led to important insights into the mechanisms of host-microbe interactions. However, the model communities studied to date have been defined or complex, but not both, limiting their utility. Here, we construct and characterize in vitro a defined community of 104 bacterial species composed of the most common taxa from the human gut microbiota (hCom1). We then used an iterative experimental process to fill open niches: germ-free mice were colonized with hCom1 and then challenged with a human fecal sample. We identified new species that engrafted following fecal challenge and added them to hCom1, yielding hCom2. In gnotobiotic mice, hCom2 exhibited increased stability to fecal challenge and robust colonization resistance against pathogenic Escherichia coli. Mice colonized by either hCom2 or a human fecal community are phenotypically similar, suggesting that this consortium will enable a mechanistic interrogation of species and genes on microbiome-associated phenotypes.


Conflict of interest statement

Declaration of interests Stanford University and the Chan Zuckerberg Biohub have patents pending for microbiome technologies on which the authors are co-inventors. M.A.F. is a co-founder and director of Federation Bio and Kelonia, a co-founder of Revolution Medicines, and a member of the scientific advisory boards of NGM Bio and Zymergen. A.G.C. and K.N. have been paid consultants to Federation Bio. A.R.B. has been an employee of Federation Bio.

Figures

Figure 1:
Figure 1:. A complex gut bacterial community.
(A) A phylogenetic tree of the 104 strains in the community based on a multiple sequence alignment of conserved single-copy genes. The community was designed by identifying the most prevalent strains in sequencing data from the NIH Human Microbiome Project (HMP). Colored squares indicate the phylum of each strain: Firmicutes = red, Actinobacteria = blue, Verrucomicrobia = orange, Bacteroidetes = green, and Proteobacteria = purple. Also shown are the prevalence and relative abundances of each strain in the data set from the NIH HMP (n=81 subjects). The prevalence is the fraction of subjects in which the strain was detected. The distribution of log10(relative abundance) across subjects is shown with the mean denoted by a white line for each strain. Ruminococcus bromii ATCC 27255 and Clostridium sporogenes ATCC 15579 were added to the community despite low prevalence in the HMP samples. (B) The community reaches a stable configuration quickly. The community was propagated in vitro in SAAC medium to test the stability of its composition. Each dot is an individual strain; the collection of dots in a column represents the community at a single time point. Strains are colored according to their rank-order abundance in the community at 48 h. By 12 h, the relative abundances of strains in the community spanned six orders of magnitude and remained largely stable through 48 h. (C) Communities generated from two inocula prepared on different days (i.e., biological replicates) have a similar architecture at 48 h. (D) Communities generated from the same inoculum (i.e., technical replicates) have a nearly identical composition at 48 h. In (C) and (D), the color of each circle represents the phylum of the corresponding species, and circles with gray outlines and faint colors represent strains whose presence could be explained by read mis-mapping.
Figure 2:
Figure 2:. Systematic analysis of strain-amino acid interactions.
(A) Schematic of the amino acid dropout experiment. Frozen stocks of the 104 strains were used to inoculate cultures that were grown for 24 h, diluted to similar optical densities (to the extent possible), and pooled. The mixed culture was used to inoculate one of twenty defined media lacking one amino acid at a time. After 48 h, communities were sequenced and analyzed by NinjaMap to determine changes relative to growth in the complete defined medium. (B) Community composition is impacted by amino acid dropout. Each dot is an individual strain; the collection of dots in a column represents the community at a single time point. Strains are colored according to their rank-order abundance in the community grown in complete defined medium (SAAC). Strains whose relative abundance could be explained by read mis-mapping from a more abundant strain in the same sample are plotted with a gray outline. Undetected strains were set to 10−7 for visualization. (C) Heat map showing the hierarchically clustered z-scores for each strain (x-axis) across amino acid dropouts (y-axis). The z-score was calculated based on the standard deviation of strain abundance across all samples except the cysteine dropout (STAR Methods). The Firmicutes L. lactis, C. sporogenes, and L. ruminis grew less robustly in the absence of Leu and Ile. Strains whose abundances could be explained by mis-mapping from a higher-abundance strain were not shown. (D) The effect of amino acid removal varies widely across amino acids. The fraction of strains with |z|>2 is shown for each amino acid dropout (n=66). (E) The absence of leucine or arginine leads to a large decrease in C. sporogenes relative abundance. Strains are colored according to their rank-order abundance in the community grown in complete defined medium. Only strains that were detected in at least one of the three samples were included (n=92). C. sporogenes is highlighted in black. L. lactis is highlighted in white. Undetected strains were set to 10−7 for visualization. (F) C. sporogenes growth in complete defined medium is dependent on the presence of arginine (Arg), and ornithine transcarbamoylase (otc) is partially responsible for Arg metabolism. Wild type C. sporogenes and a Δotc mutant were grown in complete defined medium +/− Arg. Growth curves depict the mean of 3 replicates. Error bars represent 1 standard deviation. (G) C. sporogenes requires otc to produce ATP from arginine. Intracellular ATP levels in C. sporogenes incubated in PBS containing 2 mM Arg are shown. (H) A proposed pathway for Arg metabolism in C. sporogenes. Based on these data, we propose that Arg is converted to citrulline by the putative Arg deiminase CLOSPO_00894; citrulline is then hydrolyzed to ornithine and carbamoyl phosphate by the putative ornithine transcarbamoylase CLOSPO_02415, leading to the production of ATP.
Figure 3:
Figure 3:. Colonizing germ-free mice with a complex gut bacterial community.
(A) Schematic of the experiment. Frozen stocks of the 104 strains were used to inoculate cultures that were grown for 24 h, diluted to similar optical densities (to the extent possible, STAR Methods), and pooled. The mixed culture was used to colonize germ-free Swiss-Webster (SW) mice by oral gavage. Fecal samples were collected weekly at weeks 1–5 and week 8, subjected to metagenomic sequencing, and analyzed by NinjaMap to measure the composition of the community at each time point. (B) Relative abundances for most strains are tightly distributed. Each column depicts the relative abundance of an individual strain across all mice at week 4. (C) Average relative abundances of the inoculum versus the communities at week 4. Strains in the community spanned >6 orders of magnitude of relative abundance when colonizing the mouse gut. Dots are colored by phylum according to the legend in panel B. Data represent the average of all mice in the experiment. (D) hCom1 reaches a stable configuration by week 2. Each dot is an individual strain; the collection of dots in a column represents the community at a single time point averaged over 5 mice co-housed in a cage. Strains are colored according to their rank-order relative abundance at week 4.
Figure 4:
Figure 4:. Challenging hCom1 with human fecal communities to identify strains that fill open niches.
(A) Schematic of the experiment. Mice were colonized by freshly prepared hCom1 and housed for four weeks, presumably filling the metabolic and anatomical niches accessible to the strains in the community. At the beginning of week 5, the mice were challenged with one of three fecal communities from a healthy human donor or with PBS as a control; we reasoned that fecal strains that would otherwise occupy a niche already filled by hCom1 would be excluded, whereas fecal strains whose niche was unfilled would be able to cohabit with hCom1. After four additional weeks, we used metagenomic sequencing coupled with MIDAS to analyze community composition from fecal pellets collected at weeks 1–5 and 8. We then identified strains that colonized in the presence of hCom1 to augment the community to create hCom2, which were then used for another round of challenge experiments (Figure 5). (B) hCom1 is broadly but not completely resistant to fecal challenge. All plots represent MIDAS bins, a rough proxy for species-level taxa. Top row: blue squares in the waffle plots indicate species that derive from hCom1, and gray squares represent species from the fecal communities. Bottom row: pie charts representing the total relative abundance of MIDAS bins that derive from hCom1 versus the fecal communities. An average of 89% of the genome copies from week 8, comprising 58% of the MIDAS bins, derived from hCom1. The remaining 11% of the genome copies, and 42% of the MIDAS bins, represent new species that joined hCom1 from one of the fecal samples. (C) Despite the addition of new strains, the architecture of the community remains intact. Each dot is an individual strain; the collection of dots in a column represents the community at a single time point averaged over the 5 co-housed mice that were challenged with fecal community Hum1. Strains are colored according to their rank-order relative abundance at week 4. Gray circles represent invading species derived from fecal community Hum1, defined as any species not present in weeks 1–4 in the group of mice shown. (D) The relative abundances of the hCom1-derived species present post-challenge are highly correlated with their pre-challenge levels. Pearson’s correlation coefficient with respect to the average relative abundance in weeks 2 and 3 are shown for the PBS control and 3 fecal community challenges, averaged across mice that received the same challenge. Correlation coefficients are shown for the 104 hCom1 species (solid lines) and for all species including invaders (dashed lines).
Figure 5:
Figure 5:. An augmented community with improved resilience to fecal challenge.
(A) Comparing the architecture and strain-level relative abundances of hCom1 and hCom2. Each column depicts the relative abundance of an individual strain from hCom2 across all samples at week 4. 100 of the 119 strains were detected; those that are new to hCom2 are colored red. (B) Averaged relative abundances of the strains in hCom1 versus hCom2 at week 4. Strains that are new to hCom2 are indicated by a gray outline. Dots are colored by phylum according to the legend in panel B. (C) The architecture of hCom2 is largely unaffected by fecal challenge with Hum1–3. Each dot is an individual strain; the collection of dots in a column represents the community at a single time point averaged over the 5 co-housed mice that were challenged with fecal community Hum1. Strains are colored according to their rank-order relative abundance at week 4. Gray circles represent invading species, defined as any species not present in weeks 1–4 in the group of mice shown. (D) Left: hCom2 is more resilient to fecal challenge than hCom1. Top row: blue squares in the waffle plots indicate MIDAS bins that derive from hCom2; gray squares represent MIDAS bins from the fecal communities. Bottom row: pie charts representing the percentage of MIDAS bins that derive from hCom2 versus the fecal communities. An average of 96% of the genome copies (and 81% of the MIDAS bins) come from hCom2 in the Hum1–3 challenges, demonstrating that the resilience of the community was improved markedly by augmentation with strains identified from the initial challenge (Figure 4). Right: hCom2 is broadly resilient to challenge by unrelated fecal samples (Hum4–6). In these challenges, an average of 81% of the genome copies (and 58% of the MIDAS bins) come from hCom2. (E) Nearly all invading strains at week 8 were repeat invaders from the first fecal challenge (Table S4). The dots representing invading strains are shown in full color; dots representing hCom2-derived strains are partially transparent. Dots that represent repeat invaders from the first fecal challenge experiment have a thick black border. (F) The relative abundances of the hCom2-derived species present post-challenge are highly correlated with their pre-challenge levels. Pearson’s correlation coefficient with respect to the average relative abundance in weeks 3 and 4 are shown for the PBS control and 3 fecal community challenges, averaged across mice that received the same challenge. Correlation coefficients are shown for the 119 species in hCom2 (solid lines) and for all species including invaders (dashed lines). (G) hCom2 resembles a fecal consortium more closely than hCom1. Averaged relative abundances of MIDAS bins are shown for hCom1- and hCom2-colonized mice versus mice colonized by a fecal community from one of three healthy human donors (Hum1–3). The phylum-level architecture of hCom2 is more closely correlated to that of humanized mice than hCom1 (Figure S3). (H) Pairwise correlation coefficients of phylum-level relative abundance vectors were higher between hCom2-colonized and Hum1–3 humanized mice than between hCom1-colonized and Hum1–3 humanized mice.
Figure 6:
Figure 6:. hCom2-colonized mice are phenotypically similar to humanized mice.
(A) Schematic of the experiment. Germ-free SW mice were colonized with freshly prepared hCom2 or a fecal sample from a healthy human donor. One cohort of mice was sacrificed at two weeks for immune cell profiling; another was sacrificed at four weeks for targeted metabolite analysis. (B) The architecture of hCom2 in mice is highly reproducible. Left: community composition is highly similar across four biological replicates. Each dot is an individual strain; the collection of dots in a column represents the community at 4 weeks averaged over 5 mice co-housed in a cage. Strains are colored according to their average rank-order relative abundance across all samples. Right: Pearson’s pairwise correlation coefficients for technical and biological replicates. (C) hCom2-colonized, hCom1-colonized, and humanized mice have similar bacterial cell densities in vivo. Fecal samples from hCom2-colonized, hCom1-colonized, humanized, specific pathogen-free (SPF), or germ-free (GF) mice were homogenized and plated anaerobically on Columbia Blood Agar to enumerate colony forming units. (D) Immune cell types and numbers were broadly similar between hCom2-colonized and humanized mice. Colonic immune cells were extracted from hCom2-colonized, humanized, or germ-free mice (all C57BL/6), stained for cell surface markers, and assessed by flow cytometry. Statistical significance was assessed using a Student’s two tailed t-test (**: p<0.05). (E) hCom2-colonized mice and humanized mice have a similar profile of microbiome-derived metabolites. Urine samples from hCom2-colonized and humanized mice were analyzed by targeted metabolomics to measure a panel of aromatic amino acid metabolites by LC-MS. Statistical significance was assessed using a Student’s two tailed t-test (*: p<0.05; **: p<0.001). (F) Bile acids were extracted from fecal pellets collected from hCom2-colonized and humanized mice and were quantified by LC-MS. Statistical significance was assessed using a Student’s two tailed t-test (*: p<0.05; **: p<0.001).
Figure 7:
Figure 7:. hCom2 exhibits colonization resistance against enterohemorrhagic E. coli.
(A) Schematic of the experiment. We colonized germ-free SW mice with freshly prepared hCom2 or one of two other communities: a 12-member synthetic community (12Com) or a fecal community from a healthy human donor. hCom2 and 12Com do not contain any Enterobacteriaceae; to test whether non-pathogenic Enterobacteriaceae enhance colonization resistance to EHEC, we colonized two additional groups of mice with variants of hCom2 and 12Com to which a mixture of seven non-pathogenic Enterobacteriaceae strains were added (six E. coli and Enterobacter cloacae, Enteromix (EM)). After four weeks, we challenged with 109 colony forming units of EHEC and assessed the degree to which it colonized in two ways: by EHEC-selective plating under aerobic growth conditions, and by metagenomic sequencing with NinjaMap analysis. (B) hCom2 exhibits a similar degree of EHEC resistance to that of a fecal community in mice. Colony forming units of EHEC in mice colonized by the four different communities are shown. As expected, the fecal community conferred robust colonization resistance while 12Com did not. The addition of EM moderately improved the EHEC resistance of 12Com. Despite lacking Enterobacteriaceae, hCom2 exhibited a similar level of EHEC resistance to that of an undefined fecal community. (C) The architecture of hCom2 is stable following EHEC challenge. Each dot is an individual strain; the collection of dots in a column represents the community at a single time point averaged over four co-housed mice. Strains are colored according to their phylum; EHEC is shown in black and members of the Enteromix community are shown in gray. (D) Schematic of the phylum dropout experiment. We colonized germ-free SW mice with four variants of hCom2, each one missing all species from the phyla Actinobacteria, Firmicutes, Proteobacteria, or Verrucomicrobia. After four weeks, we challenged with 109 colony forming units of EHEC and assessed the degree to which it colonized by EHEC-selective plating under aerobic growth conditions, and by metagenomic sequencing with NinjaMap analysis. (E) The ΔActinobacteria and ΔVerrucomicrobia communities retain the ability to resist EHEC invasion, while the ΔFirmicutes and ΔProteobacteria communities are sensitive to EHEC invasion. Right: a large survival difference in ΔFirmicutes-colonized mice compared with hCom2-colonized. (F) The architecture of the phylum dropout communities remains stable following EHEC challenge. Each dot is an individual strain; the collection of dots in a column represents the community at a single time point averaged over four co-housed mice. Strains are colored according to their phylum; EHEC is shown in black.

Similar articles

Cited by

References

    1. Angly FE, Willner D, Rohwer F, Hugenholtz P, and Tyson GW (2012). Grinder: a versatile amplicon and shotgun sequence simulator. Nucleic Acids Res. 40, e94. - PMC - PubMed
    1. Aranda-Díaz A, Ng KM, Thomsen T, Real-Ramírez I, Dahan D, Dittmar S, Gonzalez CG, Chavez T, Vasquez KS, Nguyen TH, et al. (2020). High-throughput cultivation of stable, diverse, fecal-derived microbial communities to model the intestinal microbiota. BioRxiv. - PMC - PubMed
    1. Bankevich A, Nurk S, Antipov D, Gurevich AA, Dvorkin M, Kulikov AS, Lesin VM, Nikolenko SI, Pham S, Prjibelski AD, et al. (2012). SPAdes: a new genome assembly algorithm and its applications to single-cell sequencing. J. Comput. Biol. 19, 455–477. - PMC - PubMed
    1. Blasche S, Kim Y, Oliveira AP, and Patil KR (2017). Model microbial communities for ecosystems biology. Current Opinion in Systems Biology 6, 51–57.
    1. Buffie CG, and Pamer EG (2013). Microbiota-mediated colonization resistance against intestinal pathogens. Nat. Rev. Immunol. 13, 790–801. - PMC - PubMed

Publication types

LinkOut - more resources