. 2022 Sep 1;82(17):3255-3269.e8.
doi: 10.1016/j.molcel.2022.07.017. Epub 2022 Aug 19.

Increasing cell size remodels the proteome and promotes senescence

Affiliations

Increasing cell size remodels the proteome and promotes senescence

Michael C Lanz et al. Mol Cell. .

Abstract

Cell size is tightly controlled in healthy tissues, but it is unclear how deviations in cell size affect cell physiology. To address this, we measured how the cell's proteome changes with increasing cell size. Size-dependent protein concentration changes are widespread and predicted by subcellular localization, size-dependent mRNA concentrations, and protein turnover. As proliferating cells grow larger, concentration changes typically associated with cellular senescence are increasingly pronounced, suggesting that large size may be a cause rather than just a consequence of cell senescence. Consistent with this hypothesis, larger cells are prone to replicative, DNA-damage-induced, and CDK4/6i-induced senescence. Size-dependent changes to the proteome, including those associated with senescence, are not observed when an increase in cell size is accompanied by an increase in ploidy. Together, our findings show how cell size could impact many aspects of cell physiology by remodeling the proteome and provide a rationale for cell size control and polyploidization.

Keywords: DNA damage; SA-beta-Gal; cell cycle; cell size; p16(INK4); palbociclib; polyploidy; proteomics; senescence; size-scaling.


Conflict of interest statement

Declaration of interests The authors declare no competing interests.

Figures
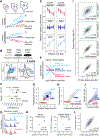
Figure 1.
Figure 1.. Cell size shapes the human proteome.
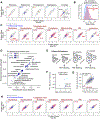
(A) Schematic illustration of the potential scaling relationships between protein amount, concentration, and cell size. (B) Metabolically labeled HLFs cells were gated by G1 DNA content and sorted into three size bins based on the side scatter parameter (SSC) as a proxy for cell size using FACS. (C) The attainment of differentially sized G1 cells was confirmed using a Coulter counter. Central dots represent the mean volume for each size bin and error bars represent the standard deviation. SILAC labeling orientation was swapped for replicate experiments. (D) Ion intensities within SILAC “triplets” represent relative peptide concentrations. (E) SILAC channel intensities are plotted for three proteins that exemplify different size scaling behaviors. Each dotted line represents an independent peptide measurement. (F) Derivation of a slope value that describes the scaling behavior of each peptide triplet. Proteins with a slope of 0 maintain a constant cellular concentration regardless of cell volume. A slope value of 1 corresponds to an increase in concentration that is proportional to the increase in volume and a slope of −1 corresponds to dilution (1/volume). (G) Peptide and (H) Protein slope values from two replicate experiments. Only proteins with at least 4 independent peptide measurements in both experiments are shown. (I) Correlation of protein slope values from two replicate experiments. A threshold for the minimum number of peptide measurements per protein is indicated in each panel. (J) Immunofluorescence intensity measured as a function of SSC (cell size) using flow cytometry. Total protein amount is inferred from the measurement of carboxyfluorescein succinimidyl ester (CFSE) dye. The data were binned by cell size and plotted as mean protein amounts per cell for each size bin (solid lines). Dark shaded area shows standard error of the mean for each bin, and light shaded area shows the standard deviation. A representative plot is shown for n=3 biological replicates for each experiment. 100,000 cells were analyzed for each sample. (K) Principal component analysis of the relative concentration of each protein in small-, medium-, and large-sized cells. The 1st principal component is plotted against cell volume for two cell lines, HLFs (fibroblast) and hTERT RPE-1 (epithelial). Dot size represents mean cell volume. (L) Similarity of the cell size-dependent concentration changes between primary HLF and immortalized hTERT RPE-1 cells. Protein Slope values for each cell type are the mean of two biological replicate experiments. Only proteins with at least 3 independent peptide measurements in each biological replicate are depicted (Table S1).
Figure 2.
Figure 2.. Differential size scaling of organelle protein content.
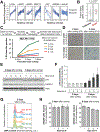
(A) Scaling behavior of protein groups. Significance is determined by t-test between adjacent protein groups. (B) Variance of subunit Protein Slope values for 212 annotated protein complexes (Table S4). Only proteins with cytoplasmic annotation are considered. Significance is determined by t-test between the proteins grouped by complex and a randomized control set. (C) Scaling behavior of proteins based on subcellular localization (see methods). The number of highlighted proteins and their average slope are indicated for each panel. Ribosomal proteins are plotted in dark blue. (D) 2D annotation enrichment analysis using the Protein Slope values calculated in HLF cells. Table S5 contains a complete list of enrichment scores for significantly super- or sub-scaling GO terms. (E) Asynchronous RPE-1 cells were arrested in G1 with 1μM Palbociclib and (F) the relative change in the concentrations of individual proteins determined using TMT quantitation (Table S6). Dot size represents mean cell size. (G) Correlation of slope values derived from size-sorted (asynchronous) and G1-arrested (Palbociclib treated) RPE-1 cells. For G1 arrested cells, slope values for individual proteins were determined using the TMT reporter ions (MS3-level) and calculated as described in Figure 1. X-axis bins are shown in dark blue. Error bars represent the 95% confidence interval and r denotes the Pearson correlation coefficient. (H) Size-scaling of organelle protein content in cells arrested in G1 with 1μM Palbociclib, as plotted in (C).
Figure 3.
Figure 3.. Diverse mechanisms control proteome size-dependency.
(A) Principal component analysis of the relative concentration of each protein and its corresponding transcript in small-, medium-, and large-sized cells. The 1st principal component is plotted against cell volume. Size dependency of the transcriptome was determined by sequencing the mRNA of size-sorted G1 cells. Dot size represents mean cell volume. (B) Size-dependent concentration changes for a representative set of proteins and their corresponding mRNA transcripts. For proteins, each connected line represents a unique peptide measurement from two biological replicate experiments (light and dark blue). For RNA, technical replicates are denoted in the same color, while biological replicates are denoted in different colors (4 replicates in total). (C) Correlation of size-dependent proteome and transcriptome changes. Examples in (B) are highlighted are in red. RNA Slope is calculated in a manner analogous to the Protein Slope using RPKM values (Table S7). (D) Ordinary least squares regression model predicts the size scaling behavior of 1,700 individual proteins based on their subcellular localization and additional features. Prediction % denotes the amount of the variance predicted by the model divided by the variance of a replicate experiment (r2model/r2replicates), the benchmark for how much a model could predict. See Figure S10 for a full description of the model.
Figure 4.
Figure 4.. Senescence-associated changes to the proteome are increasingly pronounced in large proliferating cells.
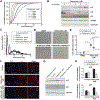
(A, B) Examples of protein concentration changes typically associated with senescence that we observe in proliferating cells. This includes size-dependent intracellular proteins (A) and SASP (senescence-associated secretory phenotype) proteins (B). (C-F) Replicative senescence of different-sized primary HLF cells. Asynchronous HLFs were gated for G1 DNA content and sorted into four bins by size using FACS, then replated and stained for the senescence marker SA-beta-Gal at the indicated time points (D). Percentage of blue-stained SA-beta-Gal positive cells (C) was calculated for each time point and plotted for each sorted size bin as mean ± standard error. Cell sizes for each bin are shown as mean ± SD in (C). P denotes the cell passage number. (E) A representative immunoblot showing the dynamics of the senescence marker p16 in different-sized HLF cells at the indicated time after size sorting. (F) Quantification of the immunoblots measuring p16 in different-sized HLF cells. Data are shown as mean ± standard error, n=3. The antibodies against senescence markers were validated using immunoblotting and immunofluorescent staining of early- and late-passage primary HLFs (Figure S13). (G) Cell cycle distributions of HLF cells 2 days after sorting by G1 cell size and re-plating. Size bins correspond to the bins in panel (C). (H) Percentage of cells in S/G2/M phases of the cell cycle for each of the four sorted cell size bins, 2 and 9 days after sorting.
Figure 5.
Figure 5.. Large cell size promotes senescence.
(A) Cumulative cell size distributions of HLF cells arrested in G1 phase for 0 to 9 days with 1μM of the CDK4/6 inhibitor Palbociclib. (B) A representative immunoblot showing the accumulation of senescence markers p16 and p21 in the HLF cells that increase in size upon Palbociclib arrest. (C, D) Cell size distributions (C) and SA-beta-Gal staining images (D) of the RPE-1 cells treated for 8 days with DMSO or Palbociclib, in the presence or absence of Rapamycin to determine the effect of cell size reduction on senescence dynamics. (E) Effect of Rapamycin, which reduces cell growth, on the percentage (±standard error) of SA-beta-Gal positive cells in RPE-1 cultures treated with Palbociclib for 8 days. Values shown next to each condition indicate the mean cell sizes after 8 days of treatment. SA-beta-Gal quantification for every data point in included 700–1200 cells quantified from 9 different fields of view. Values shown next to each condition indicate the mean cell sizes after 8 days of treatment. (F-H) Effects of Rapamycin on the expression of senescence markers p21 and p16 in HLF cells that were treated with Palbociclib for 8 days to increase cell size. (F) Immunofluorescent staining against p21 in HLF cells. Scale bar = 10μm. (G) A representative immunoblot against p21 and p16. (H) Quantification of p21 and p16 immunoblots. Data are shown as mean ± standard error, n = 4 biological replicates.
Figure 6.
Figure 6.. Larger cells are more prone to DNA damage-induced senescence.
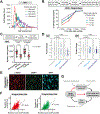
(A) Asynchronous RPE-1 cells were gated for G1 DNA content and sorted into four bins by size using FACS. (B) Sorted cells were replated, cultured in the presence of the DNA damaging agent Doxorubicin (10 ng/ml), and then stained for SA-beta-Gal at the indicated time points to determine the DNA damage-induced senescence dynamics. (C) Large cell size inhibits cell cycle re-entry after G1 arrest or DNA damage to promote senescence. RPE-1 cells were treated with Palbociclib or a low dose of Doxorubicin for 4 days. Then, the drugs were washed out, and the cells were imaged for 4 days to identify cells that re-enter the cell cycle, and cells that remain arrested in a senescent state. Nuclear area was used as a proxy for cell size and cell cycle re-entry was determined using the fluorescent cell cycle phase reporters Cdt1-mKO2 (G1 reporter) and Geminin-mAG (S/G2/M reporter) (Sakaue-Sawano et al., 2008). N = 33 cells for each data point. (D) Protein slope values for all proteins annotated as DNA repair (GO:0006281) and DNA replication (GO:0006260) that were present in our dataset. (E) Immunofluorescence staining of RPE-1 cells treated with 10 ng/ml Doxorubicin for 24 hours against γ-H2AX (red) and 53BP1 (green), with DAPI staining shown in cyan. Scale bar = 10μm. (F) Number of γ-H2AX and 53BP1 loci in RPE-1 cells treated with 10 ng/ml Doxorubicin plotted against the nucleus area, which serves as a proxy for cell size. N = 1265 cells. All the experiments were performed in n = 3 biological replicates. (G) Model of relationships between DNA-related stress, large cell size, and senescence.
Figure 7.
Figure 7.. Cell volume-to-ploidy ratio drives size-dependent proteome changes.
(A) hTERT RPE-1 cells expressing fluorescent cell cycle reporters (Cdt1-mKO2, Geminin-mAG) were treated with an Aurora kinase inhibitor barasertib (75nM, 48 hours) to partially inhibit cytokinesis. Cells were then sorted based on ploidy and G1 cell cycle phase. The attainment of differentially sized G1 cells was confirmed using a Coulter counter. The histogram shows a representative example of size distributions for sorted cells, and the numbers next to it represent mean cell size ± standard error for n=3 biological replicates. (B) Ploidy-sorted and Size-sorted G1 cells were isolated by FACS and their proteomes measured using TMTsixplex. Ploidy-sorted Protein Slope values were calculated by plotting the relative protein concentration against the mean cell size in the 2N, 4N, and 8N bins to obtain a slope value (Table S9). (C) Distributions of ploidy-sorted and size-sorted Protein Slope values. Despite large increases in cell size from 2N to 8N, concentration changes were minimal. (D) Slightly negative correlation between ploidy-sorted and size-sorted Protein Slope values are consistent with a small increase in DNA-to-cell volume ratio in polyploid G1 cells. (E) DNA-to-cell volume-dependent concentration changes for a representative set of proteins. For each protein panel, dotted lines represent unique peptide measurements.

Similar articles

Cited by

References

    1. Berenson DF, Zatulovskiy E, Xie S, and Skotheim JM (2019). Constitutive expression of a fluorescent protein reports the size of live human cells. Mol Biol Cell 30, 2985–2995. - PMC - PubMed
    1. Berry S, Muller M, Rai A, and Pelkmans L (2022). Feedback from nuclear RNA on transcription promotes robust RNA concentration homeostasis in human cells. Cell Syst. - PubMed
    1. Cantwell H, and Nurse P (2019). Unravelling nuclear size control. Curr Genet 65, 1281–1285. - PMC - PubMed
    1. Chan YH, and Marshall WF (2010). Scaling properties of cell and organelle size. Organogenesis 6, 88–96. - PMC - PubMed
    1. Chen Y, Zhao G, Zahumensky J, Honey S, and Futcher B (2020). Differential Scaling of Gene Expression with Cell Size May Explain Size Control in Budding Yeast. Mol Cell 78, 359–370 e356. - PMC - PubMed

Publication types