. 2022 Aug 10;5(12):e202201376.
doi: 10.26508/lsa.202201376.

Islet Gene View-a tool to facilitate islet research

Affiliations

Islet Gene View-a tool to facilitate islet research

Olof Asplund et al. Life Sci Alliance. .

Abstract

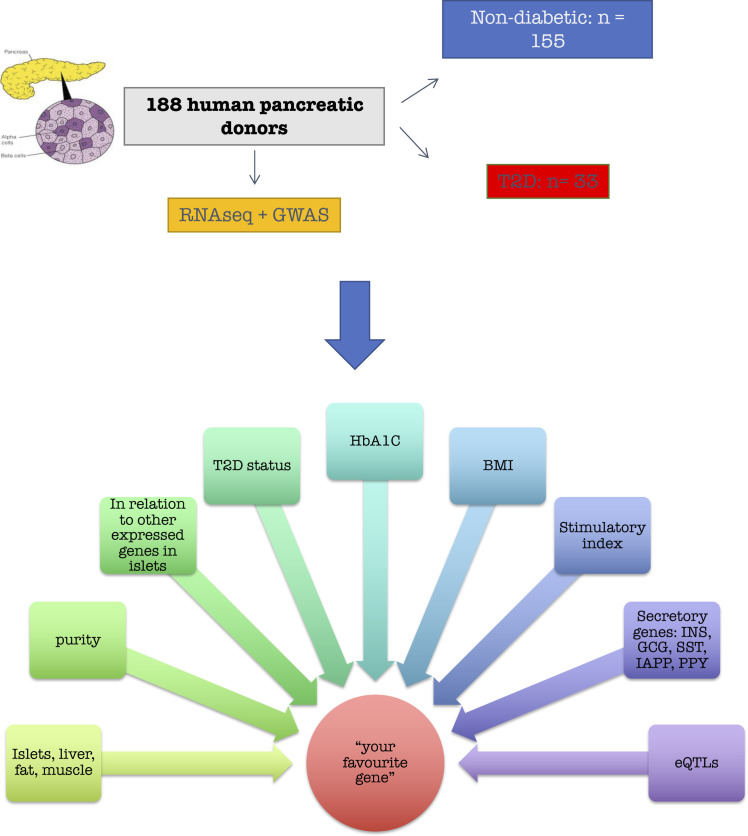
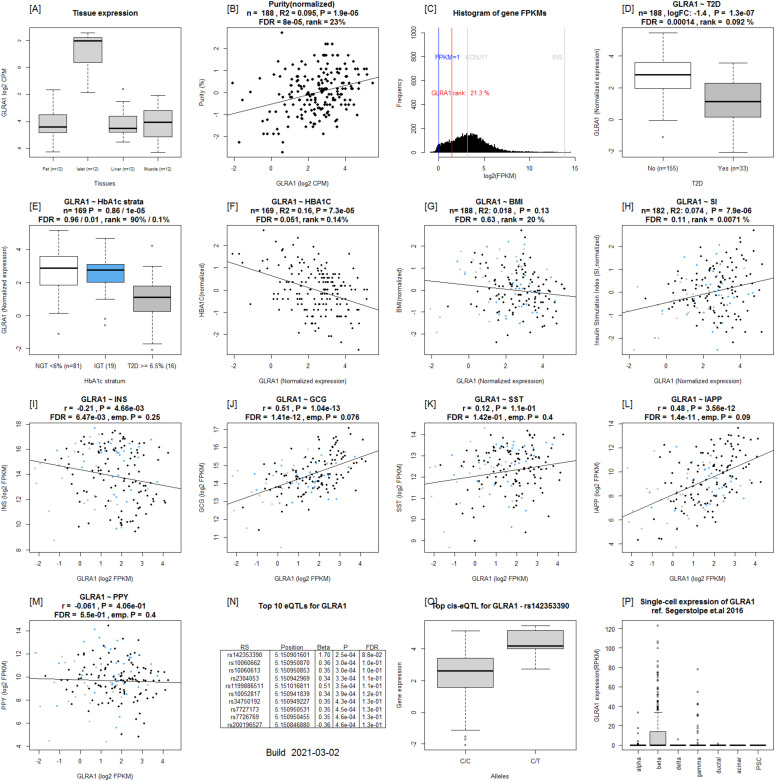
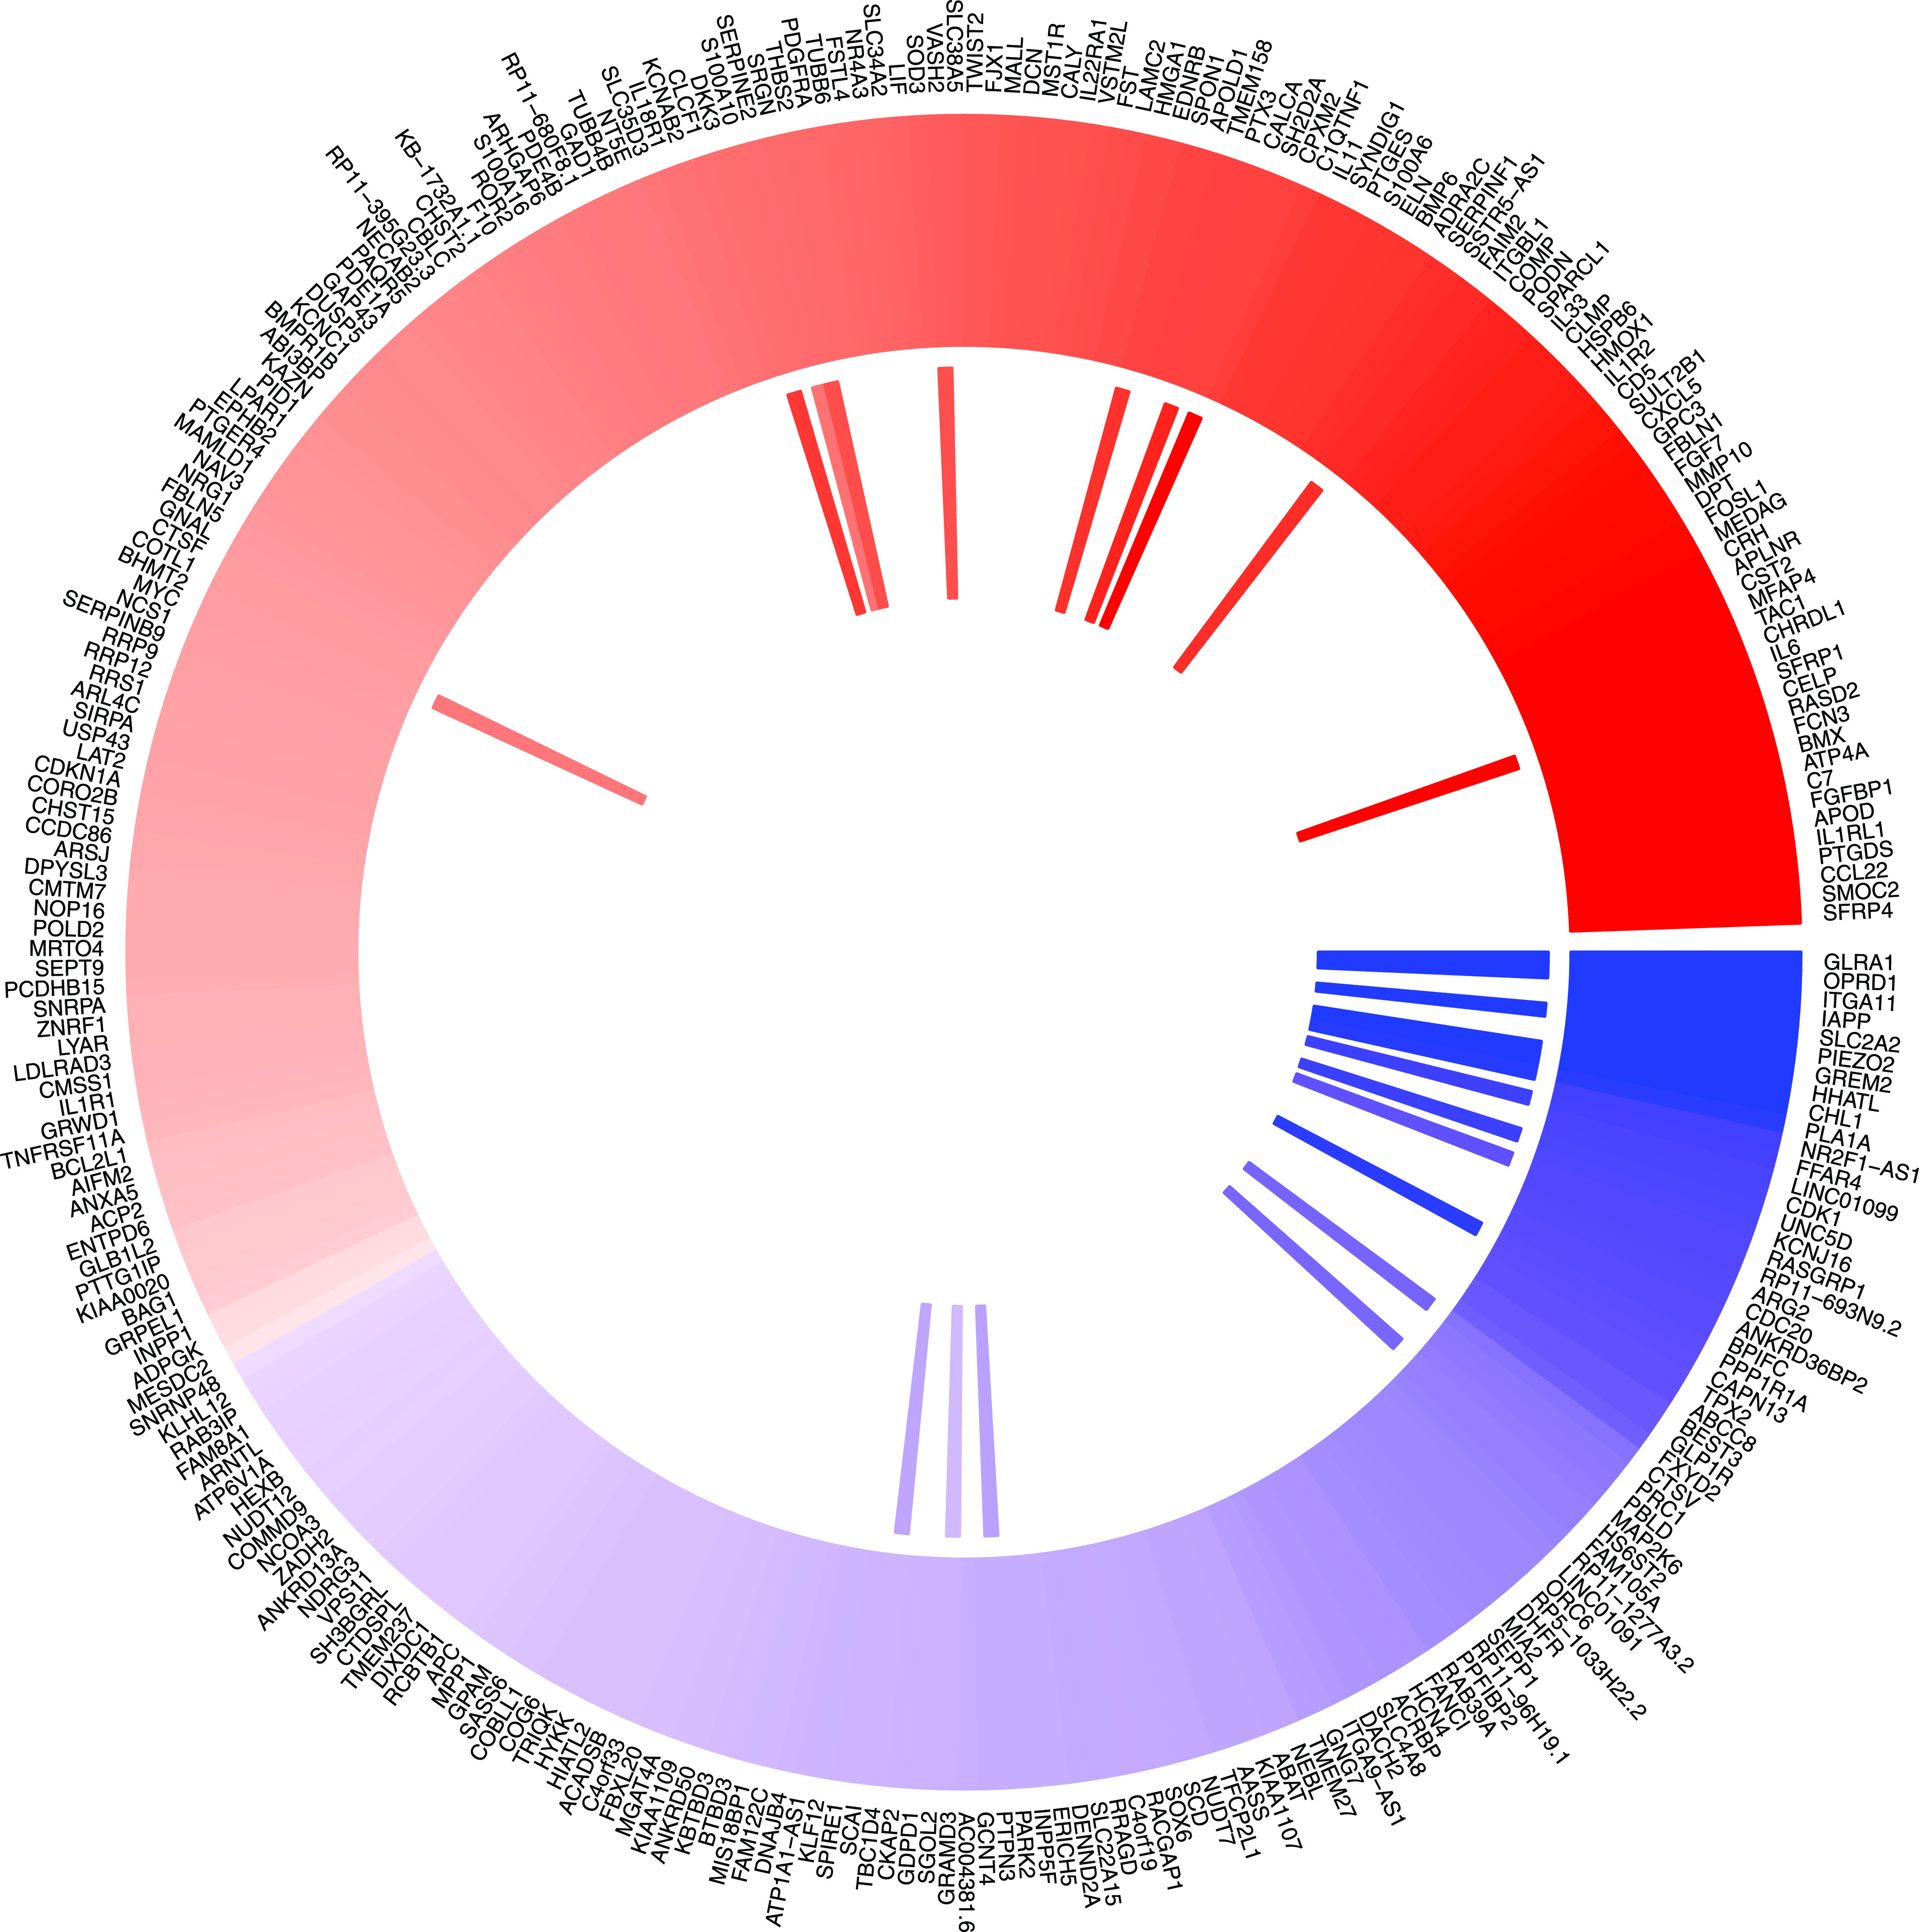
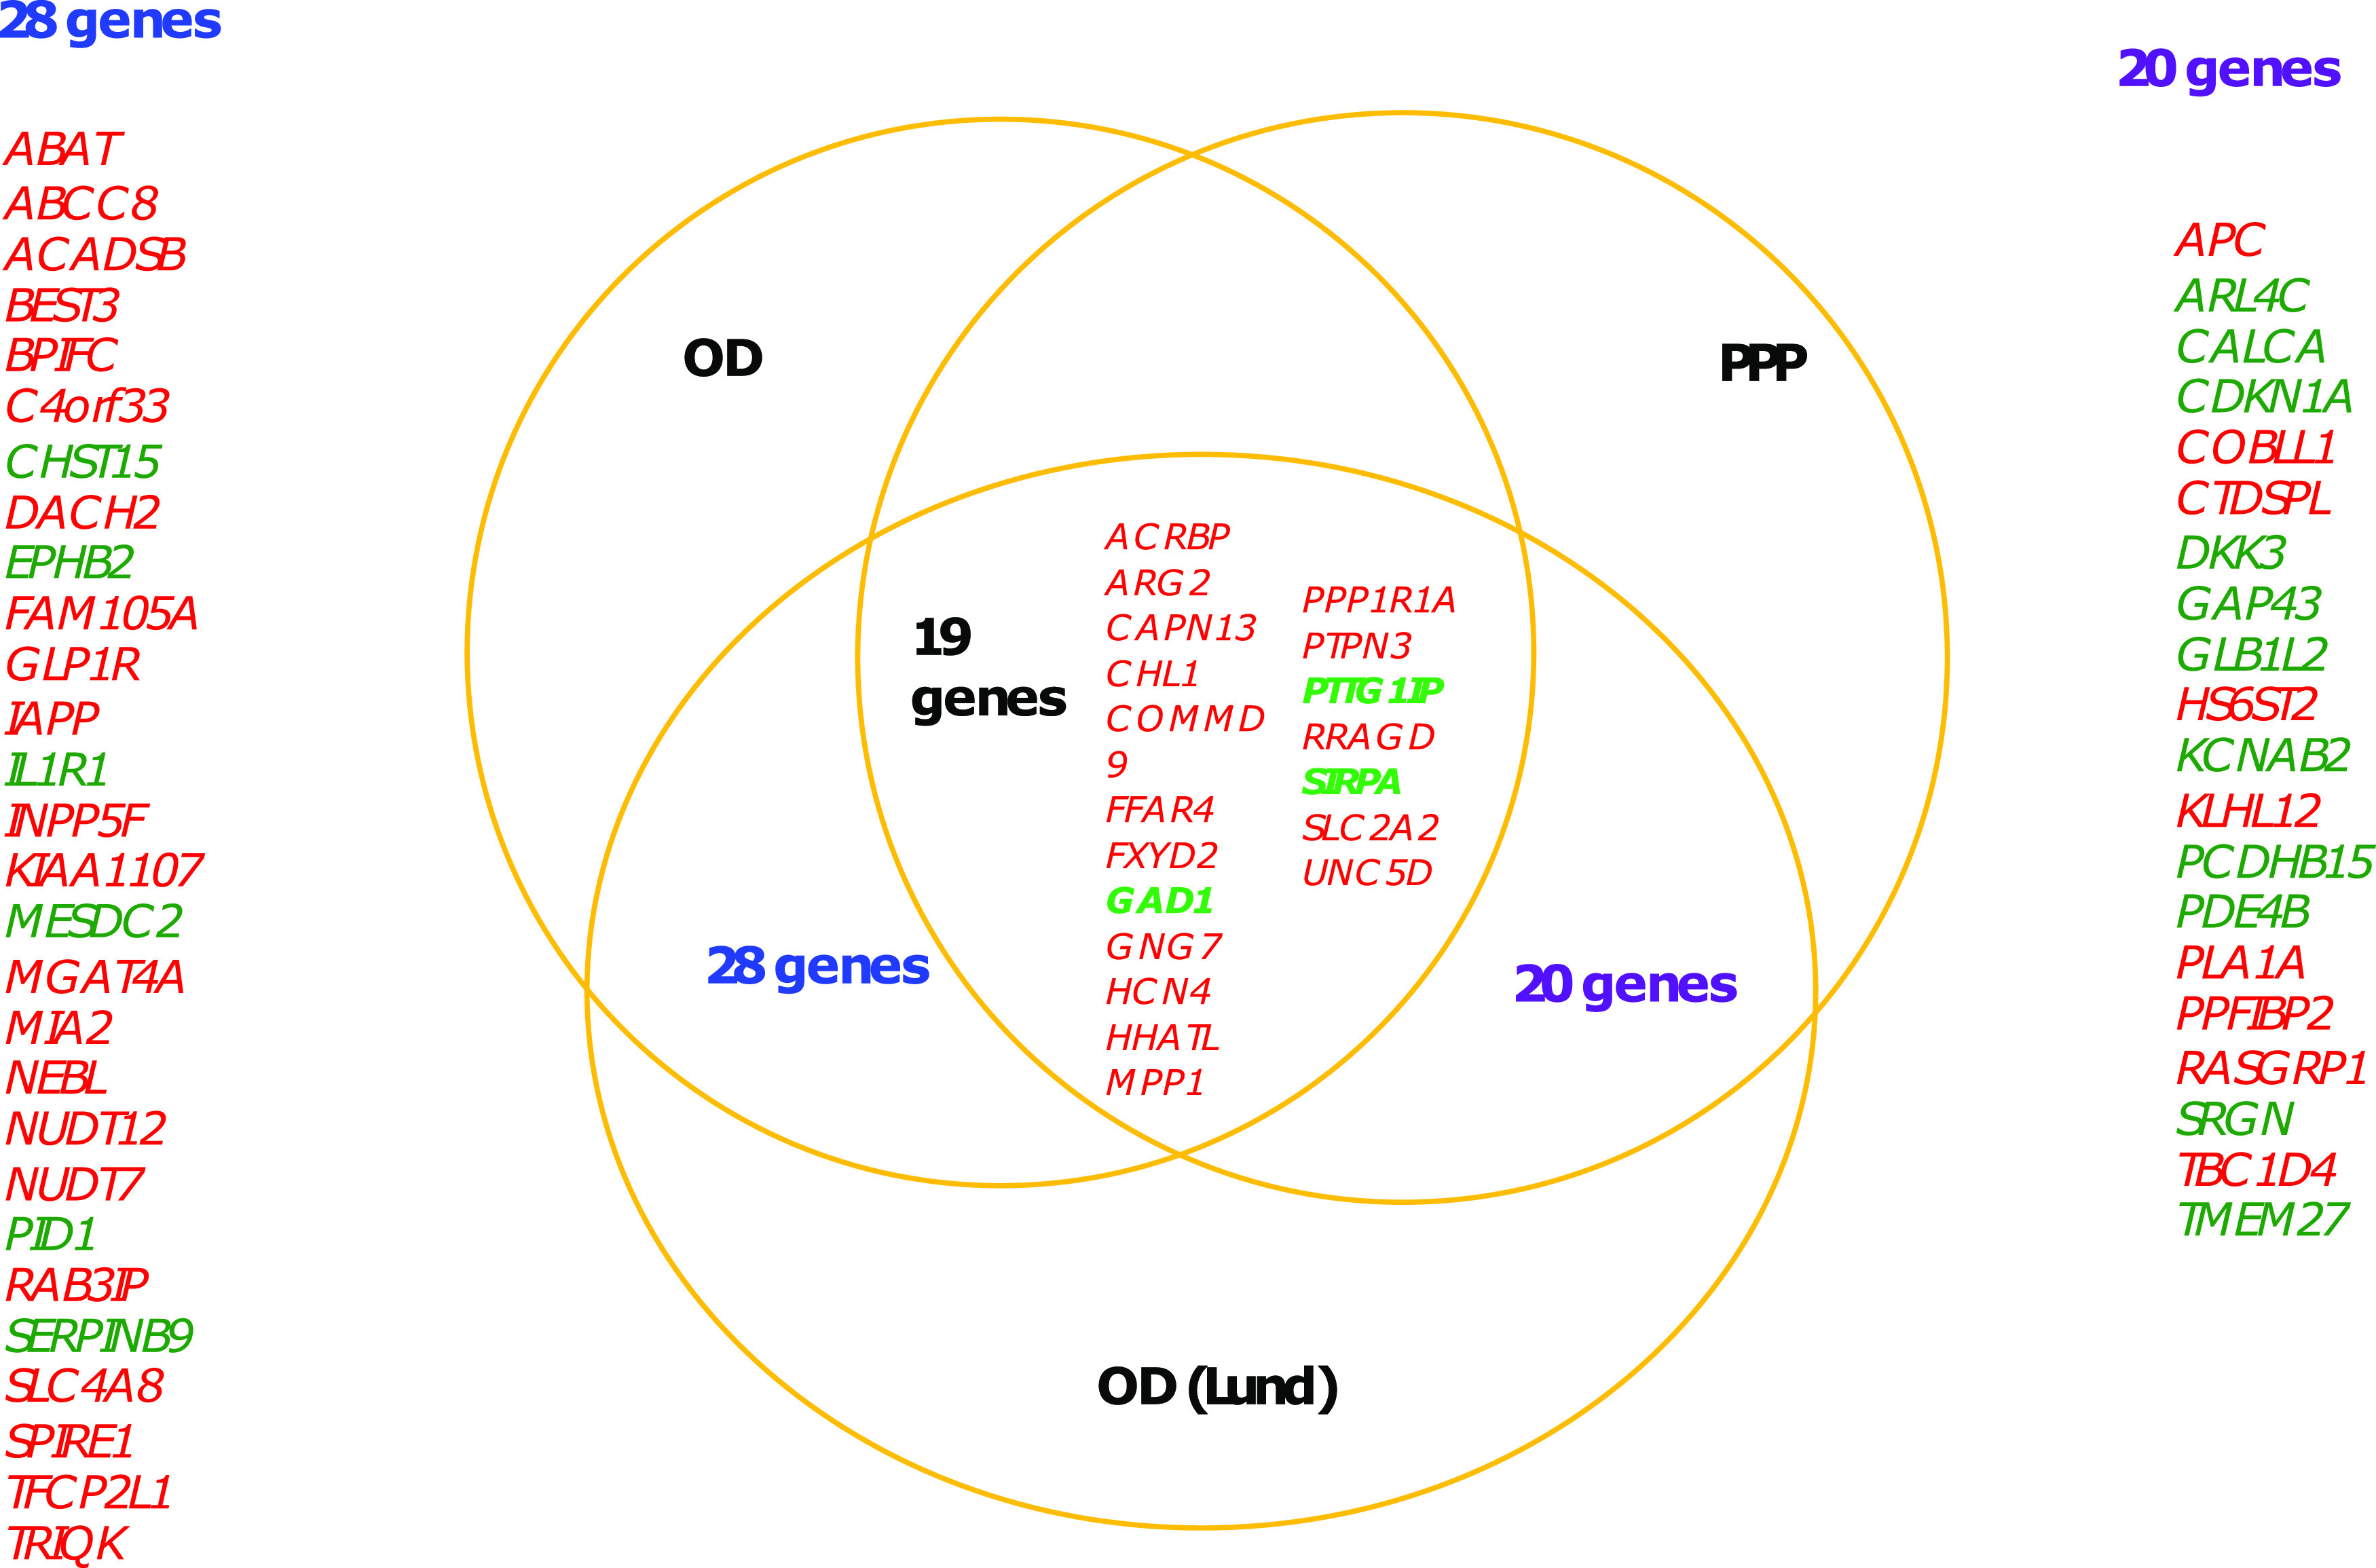
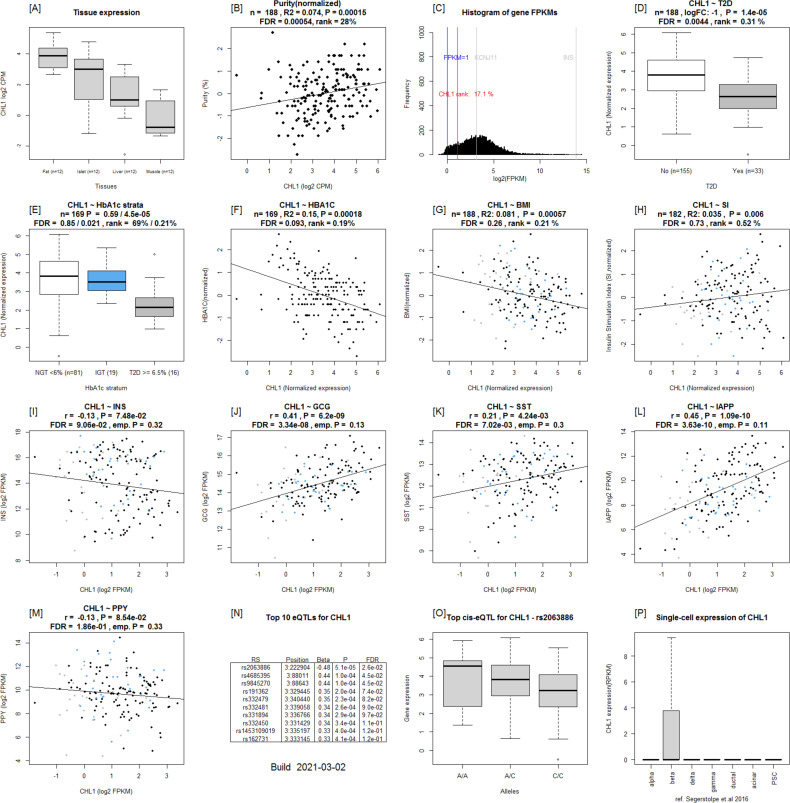
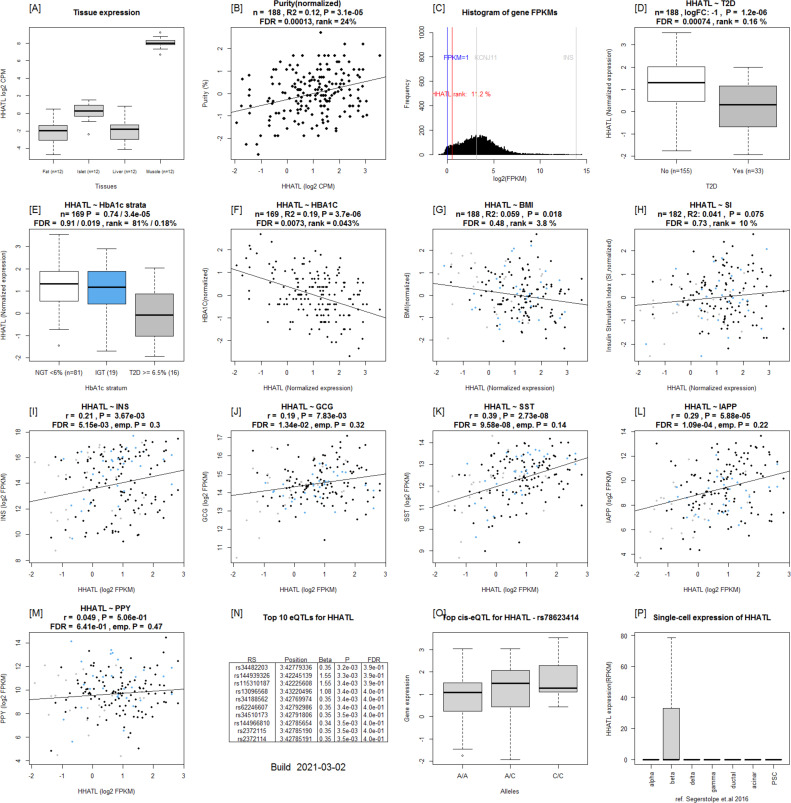
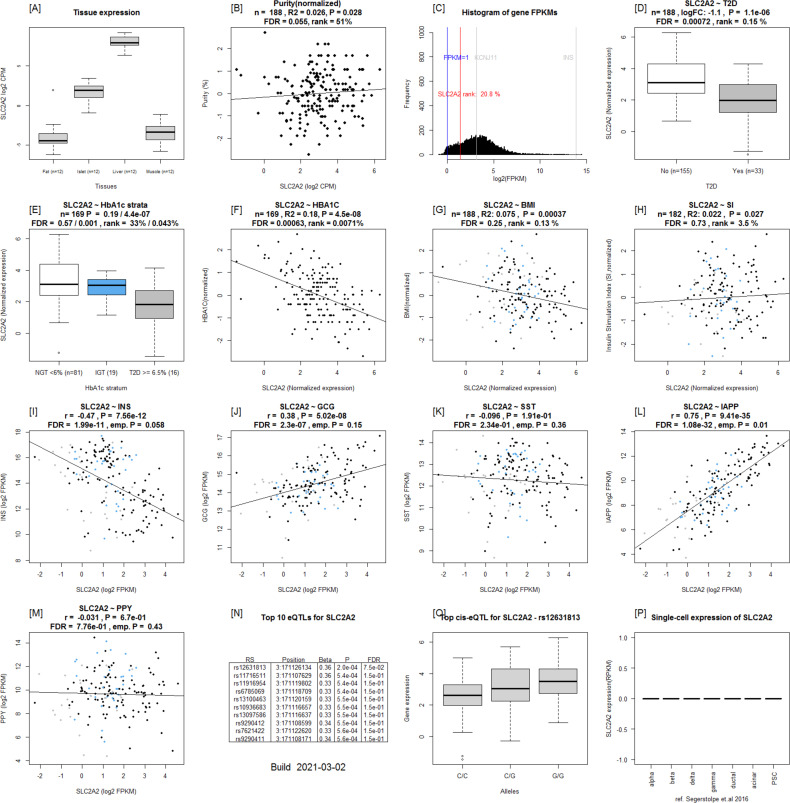
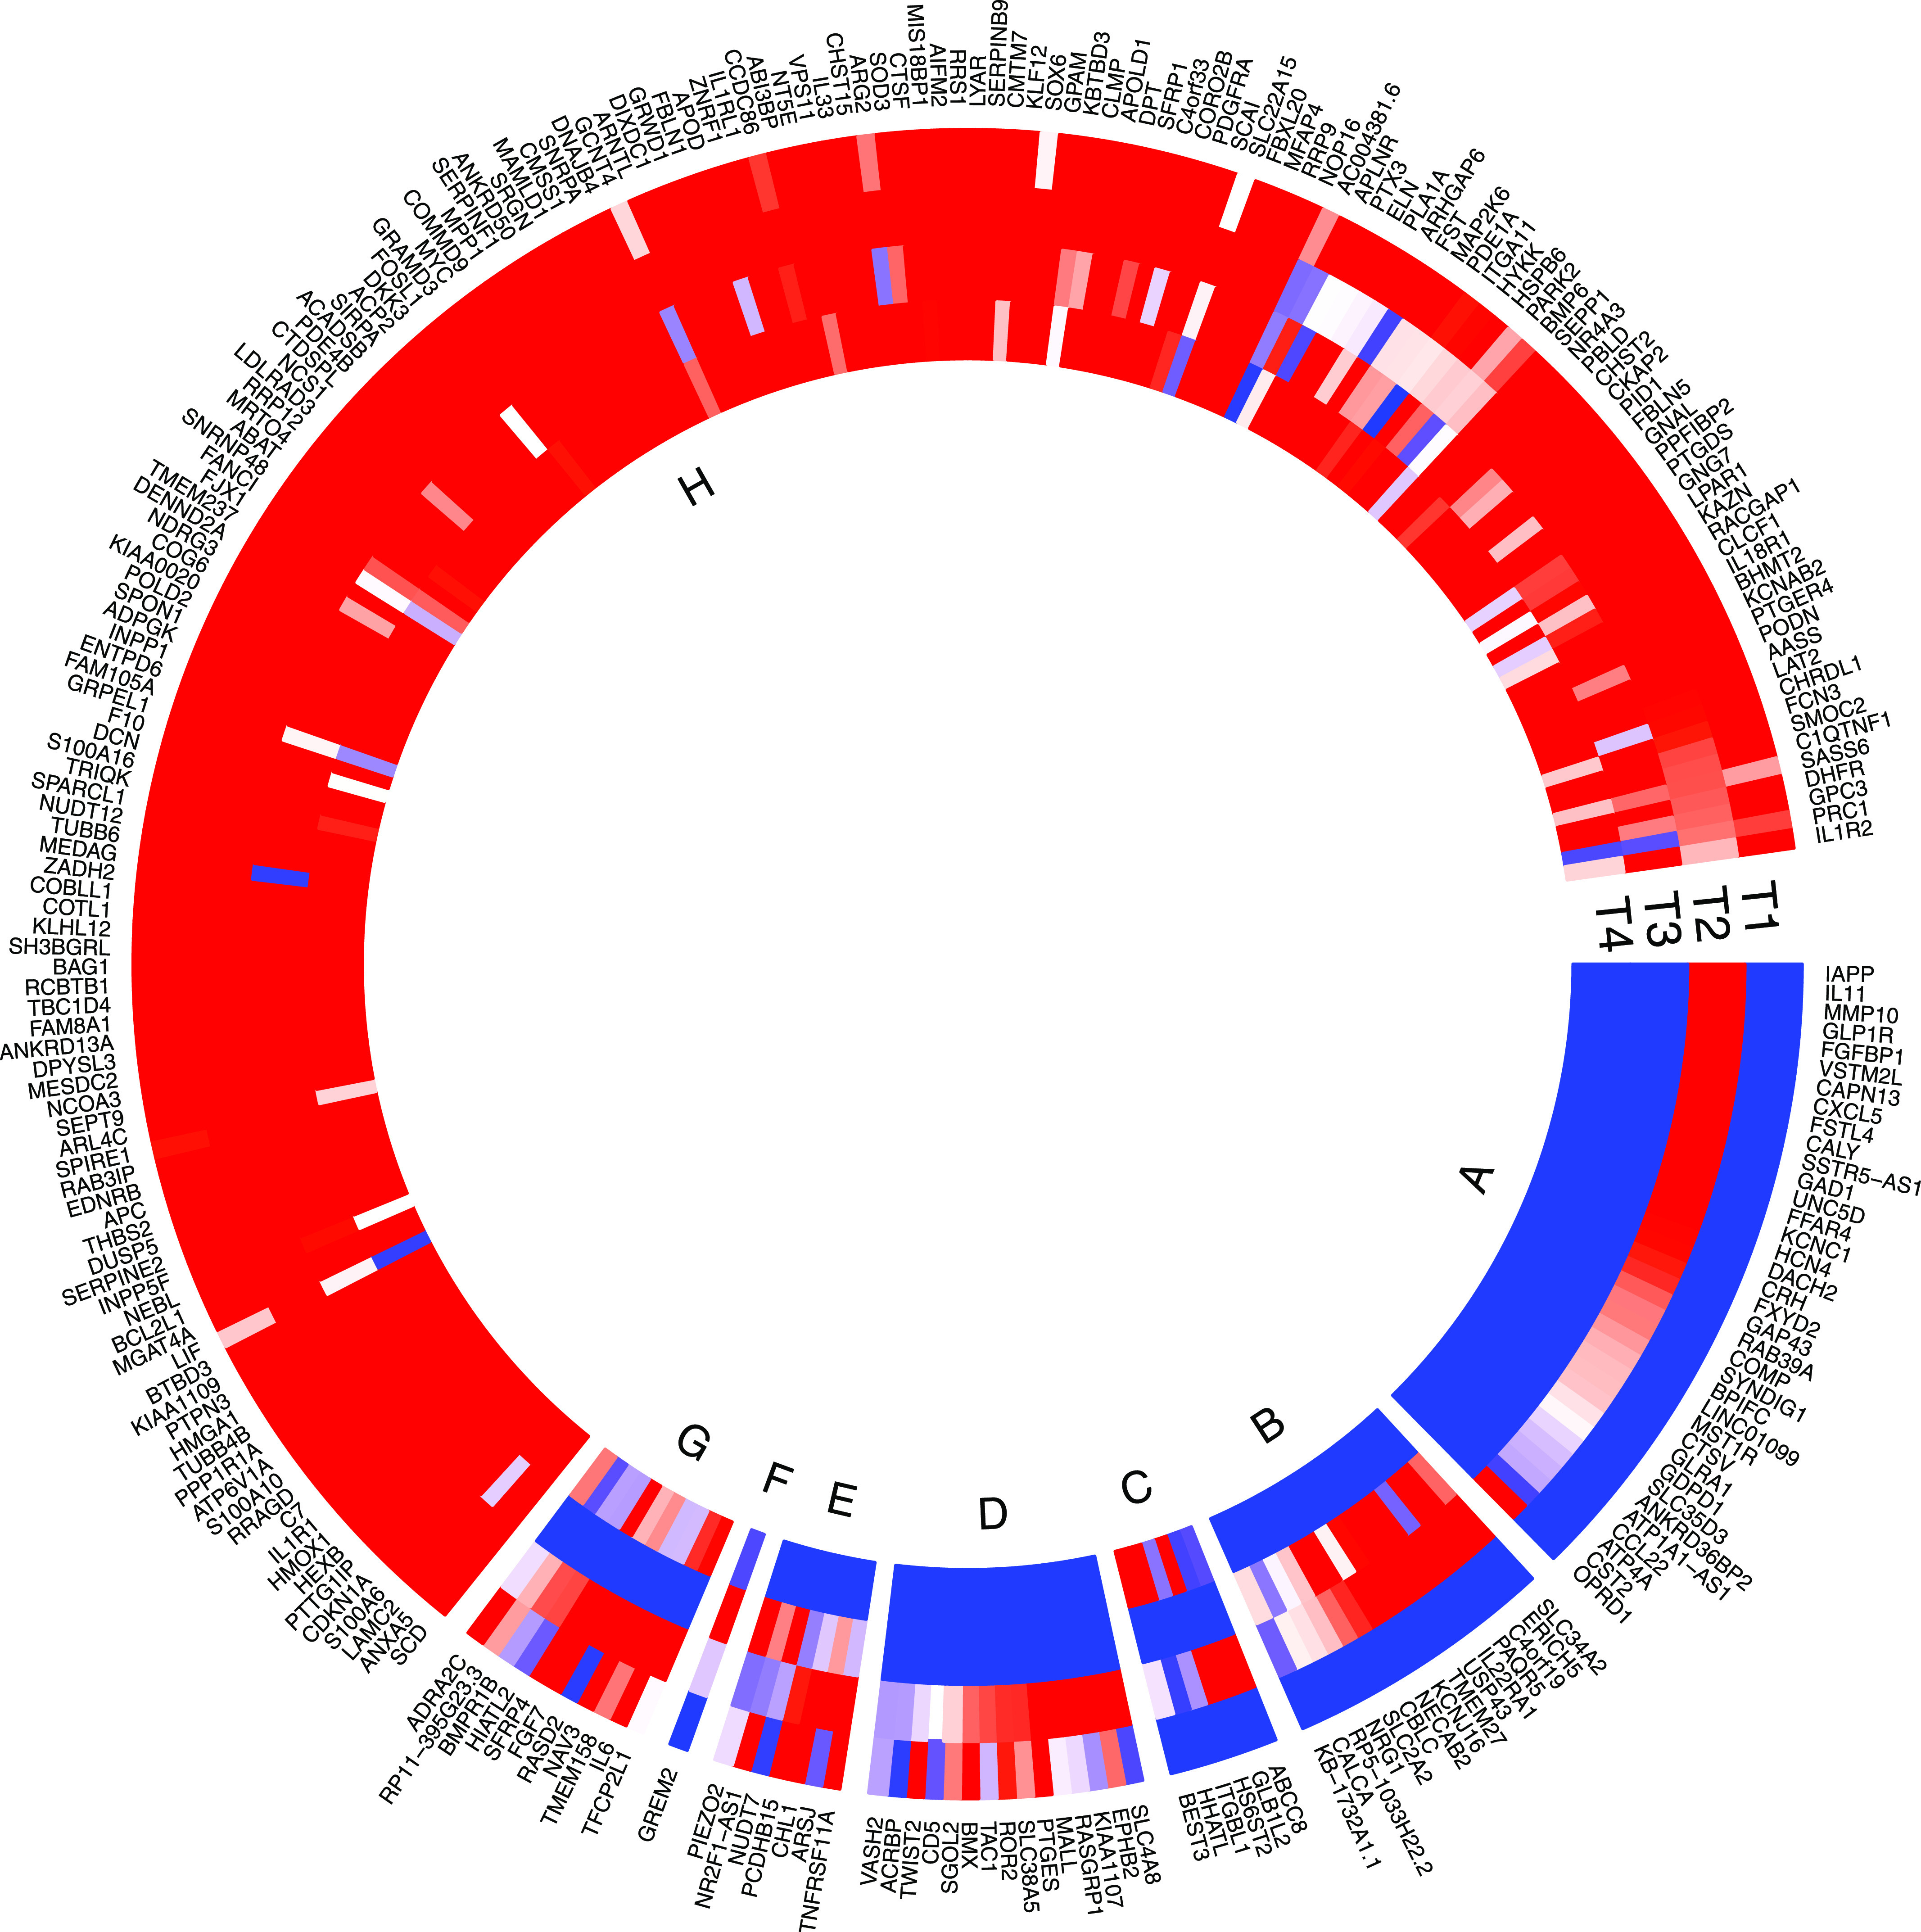
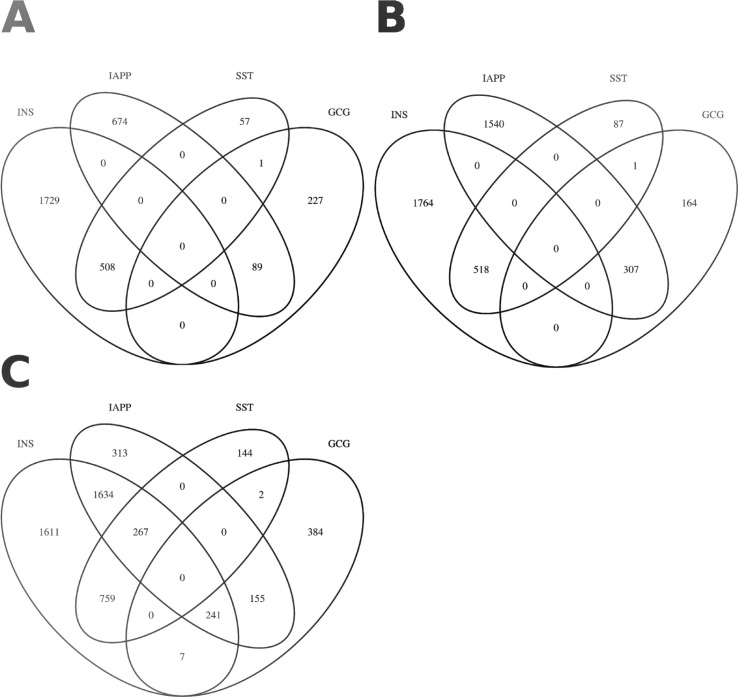
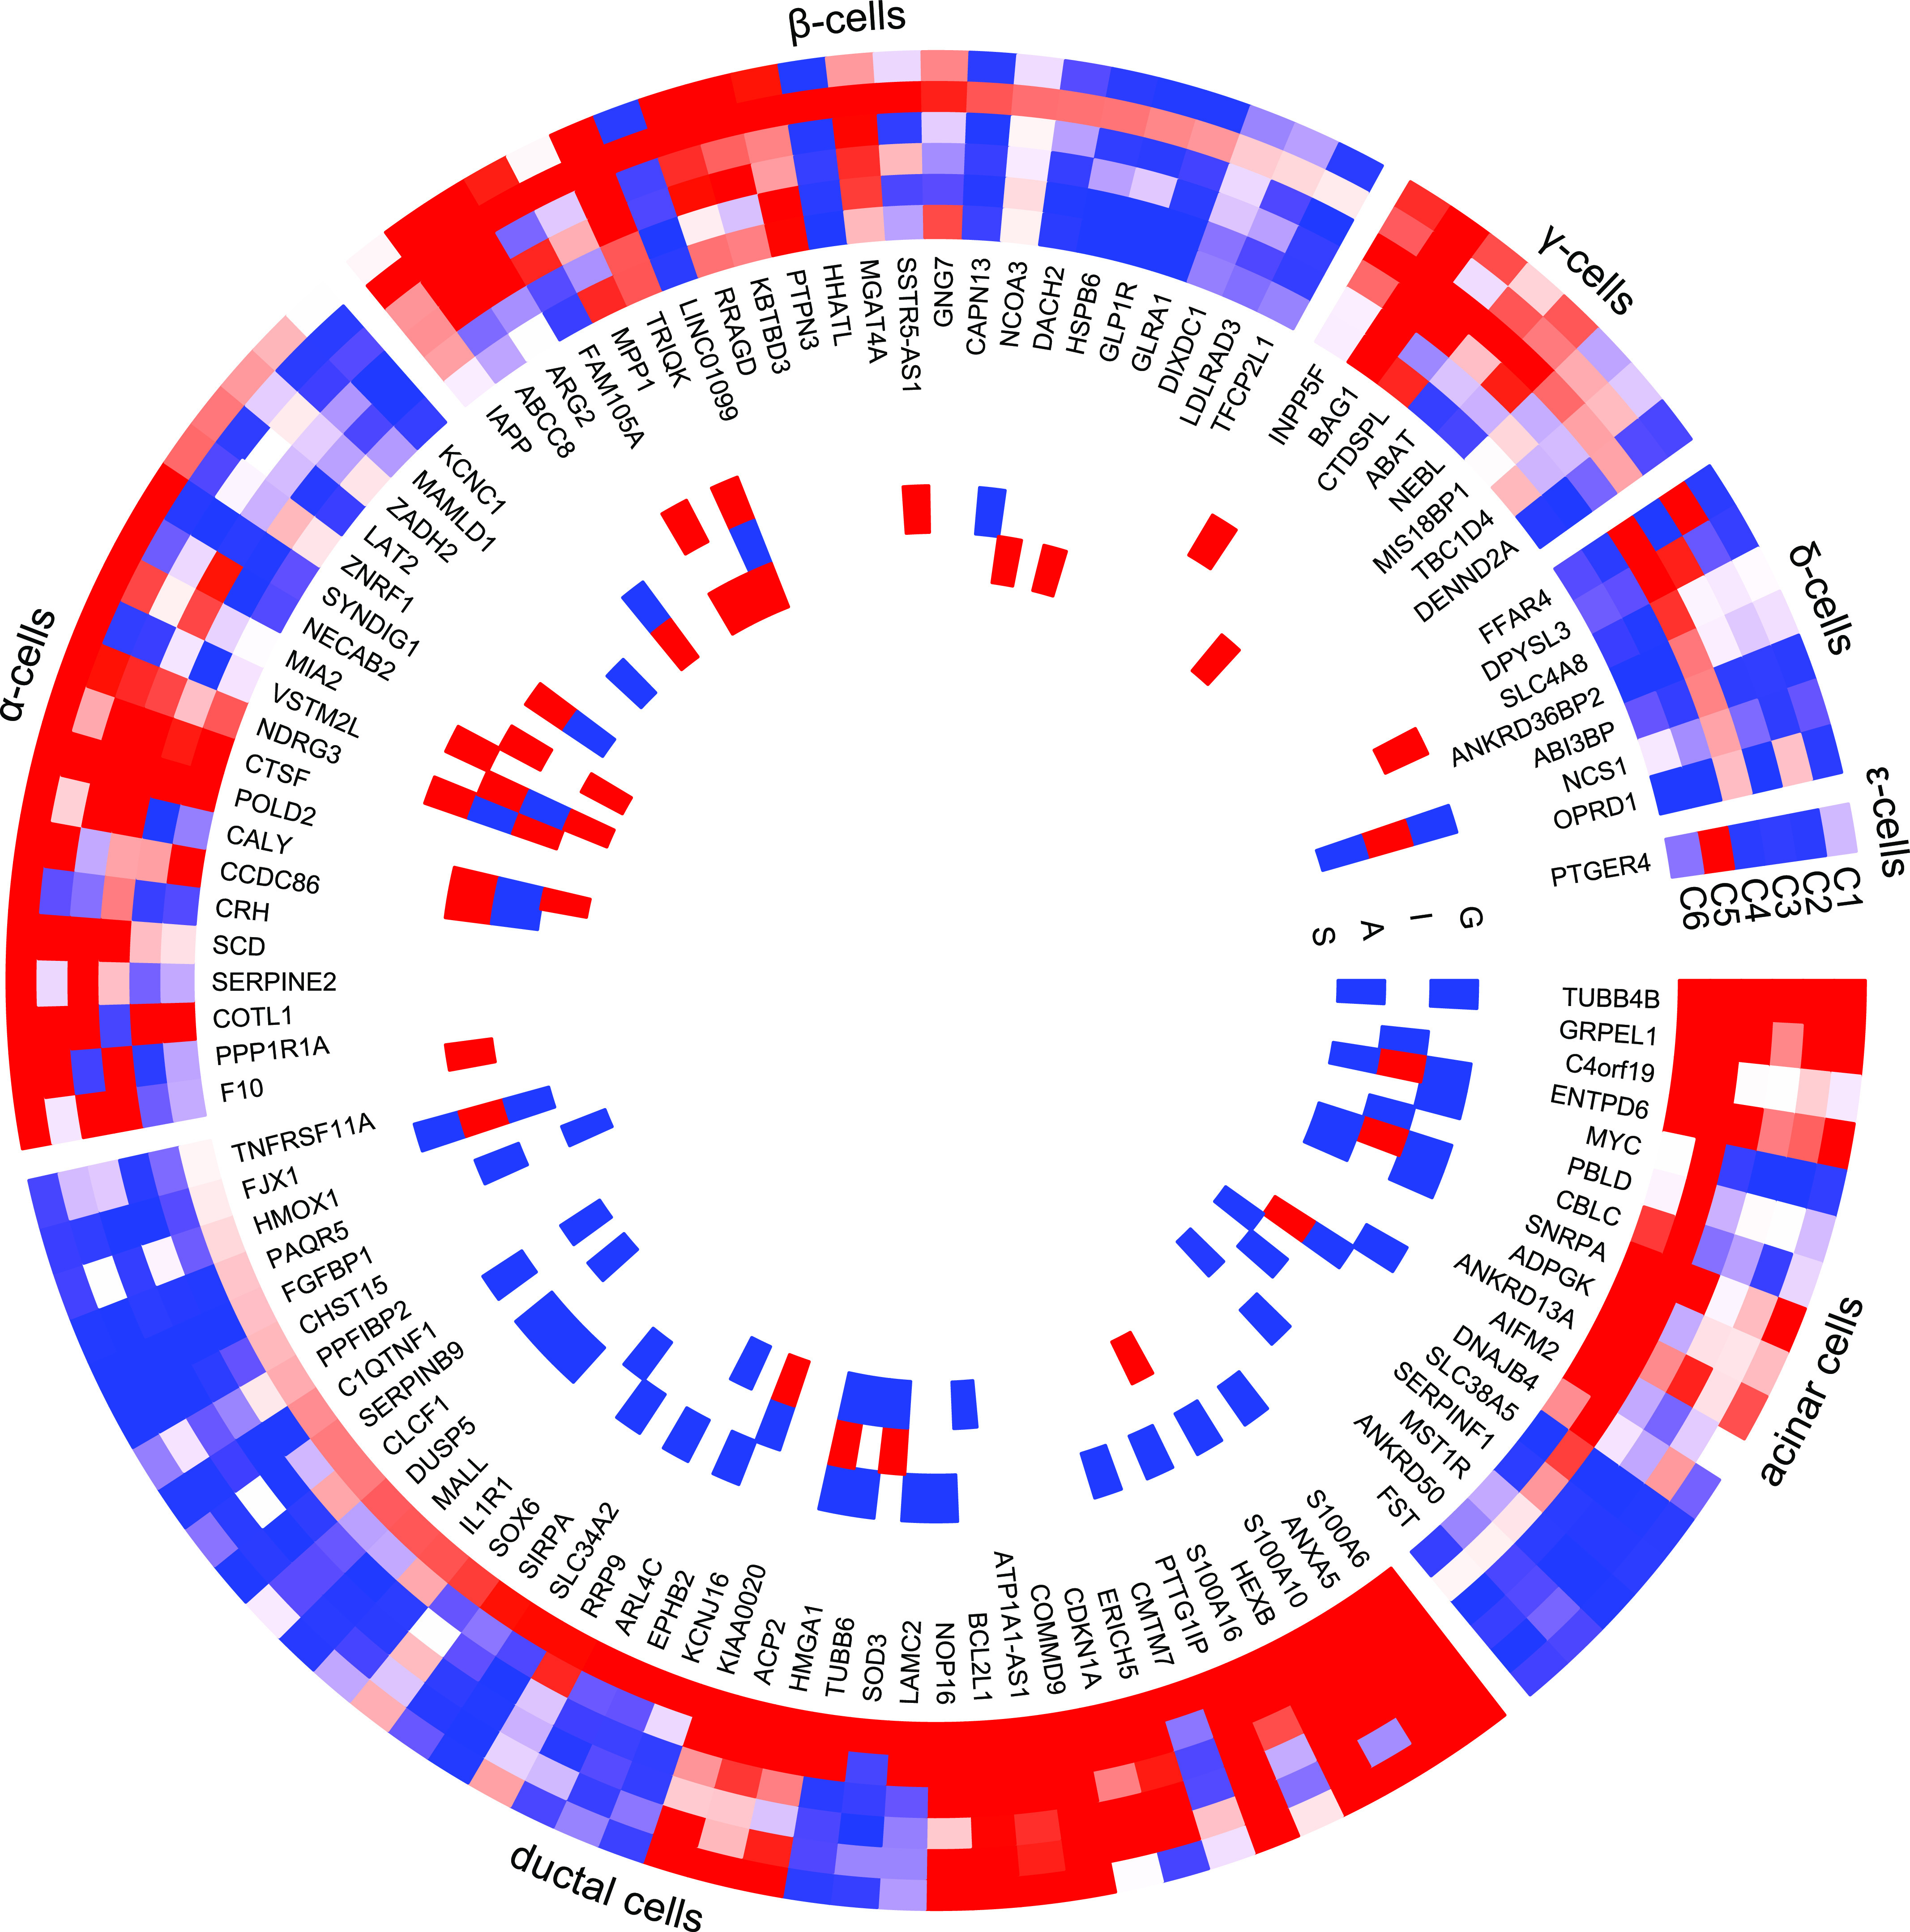
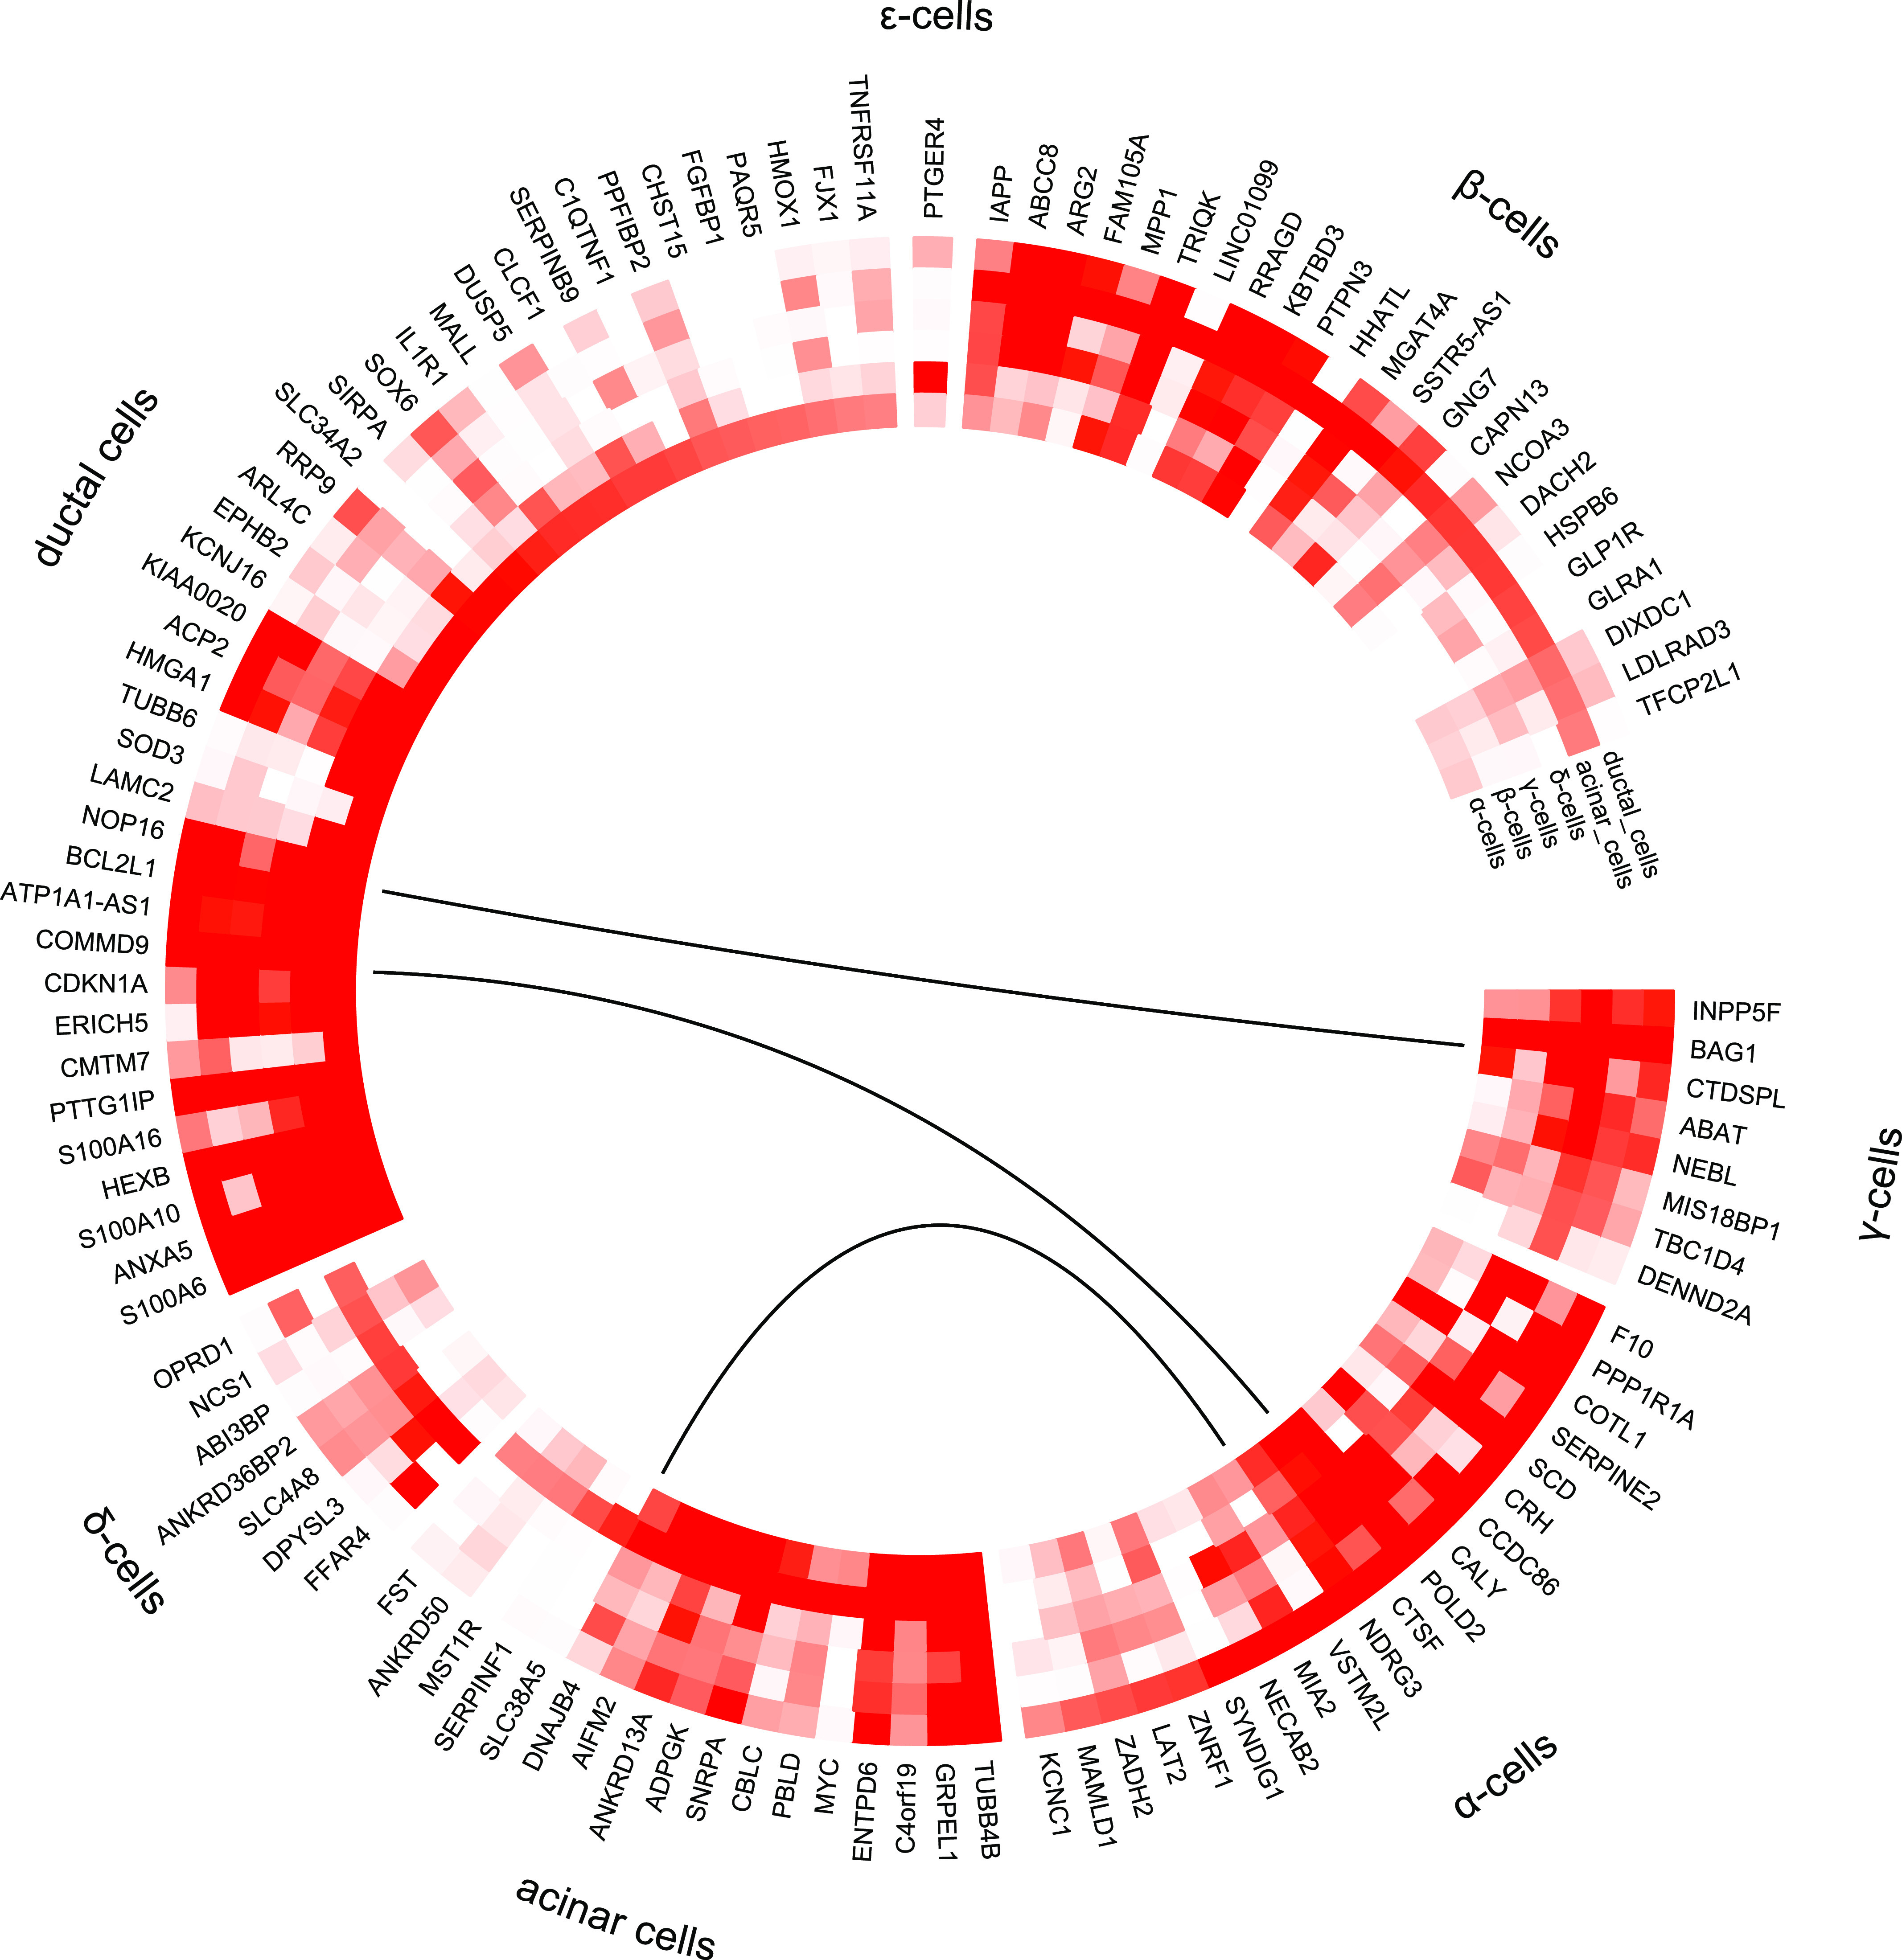
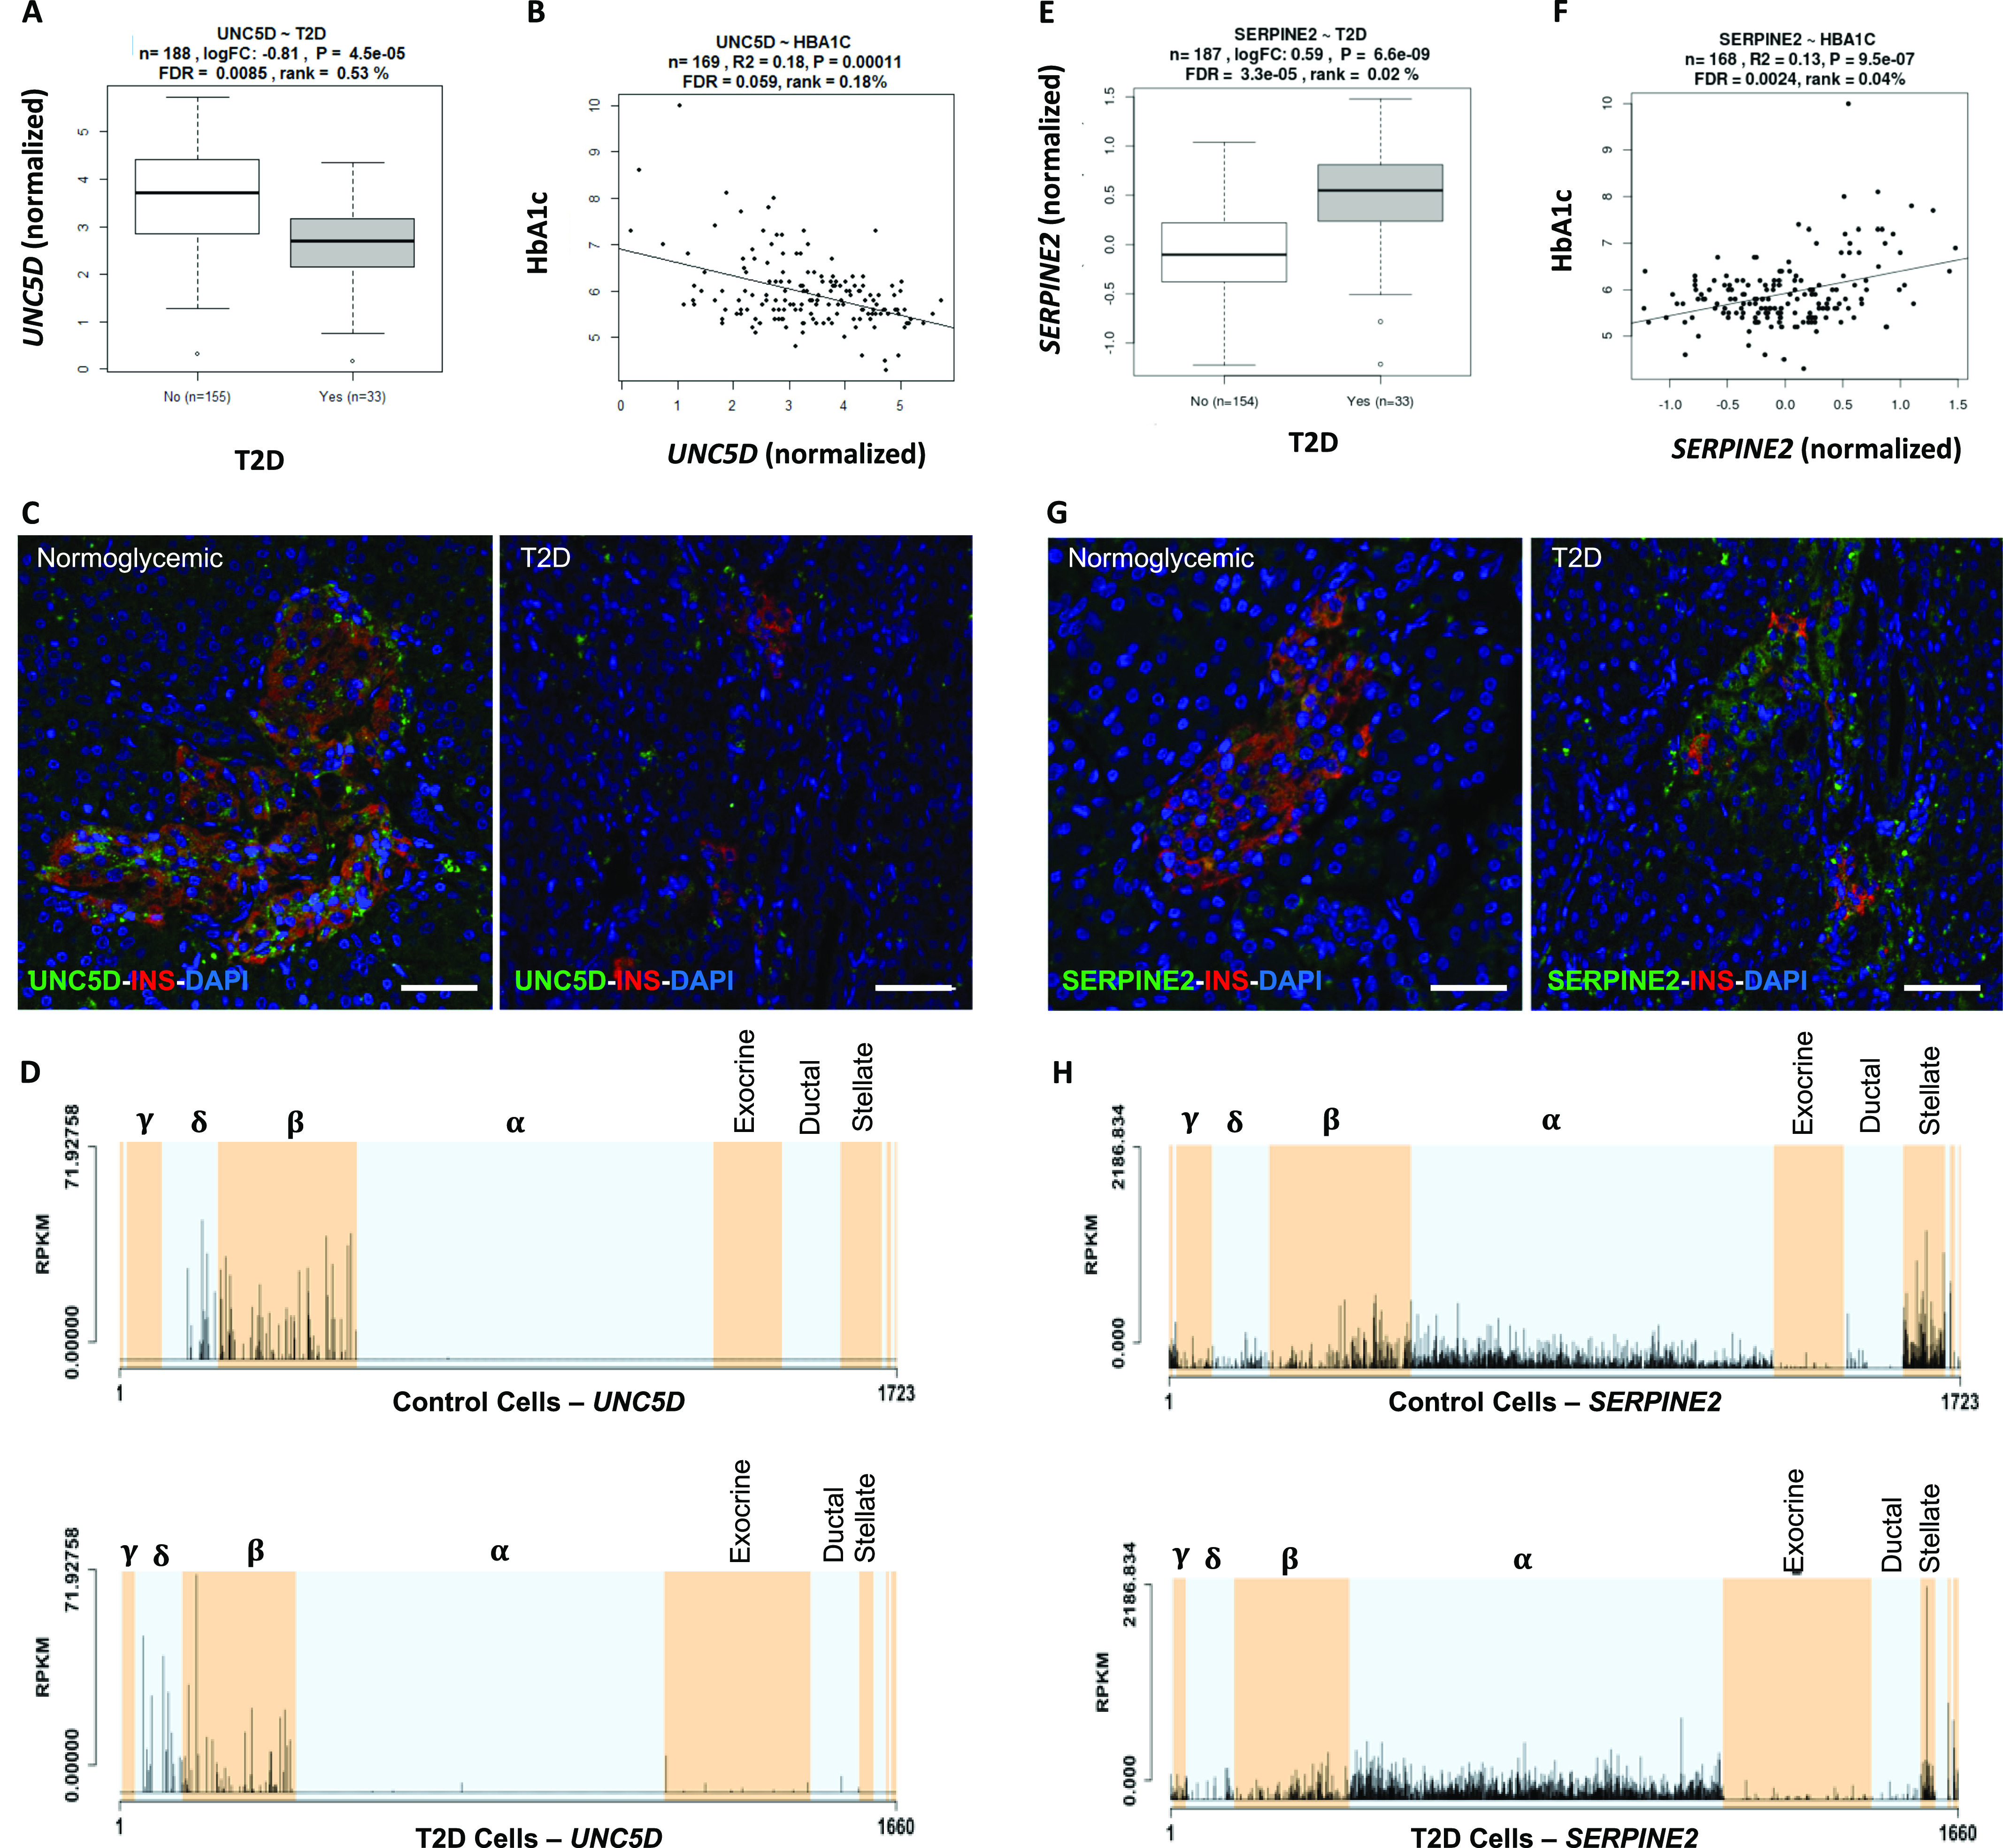
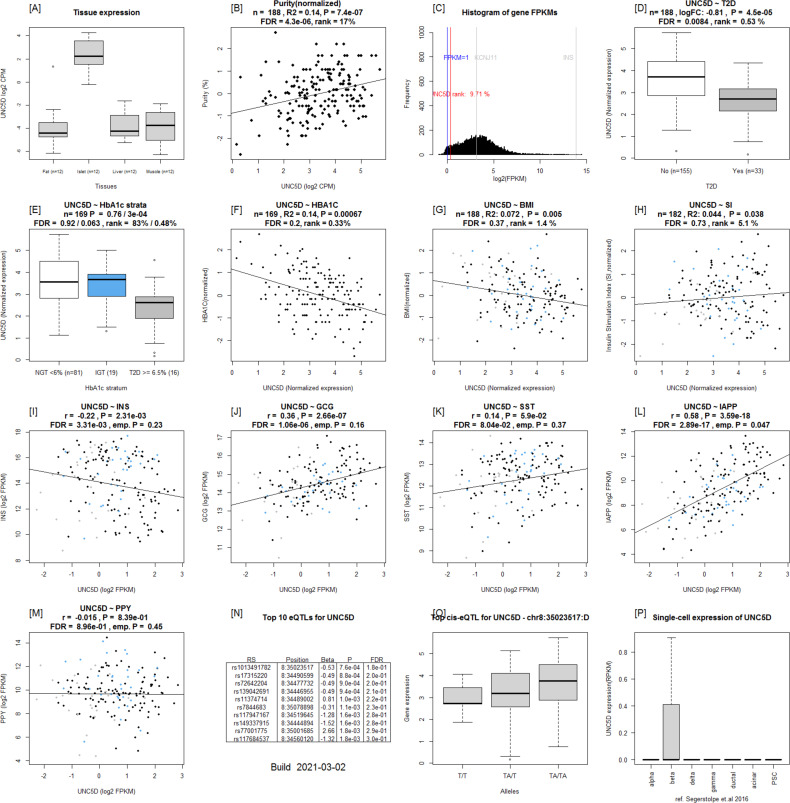
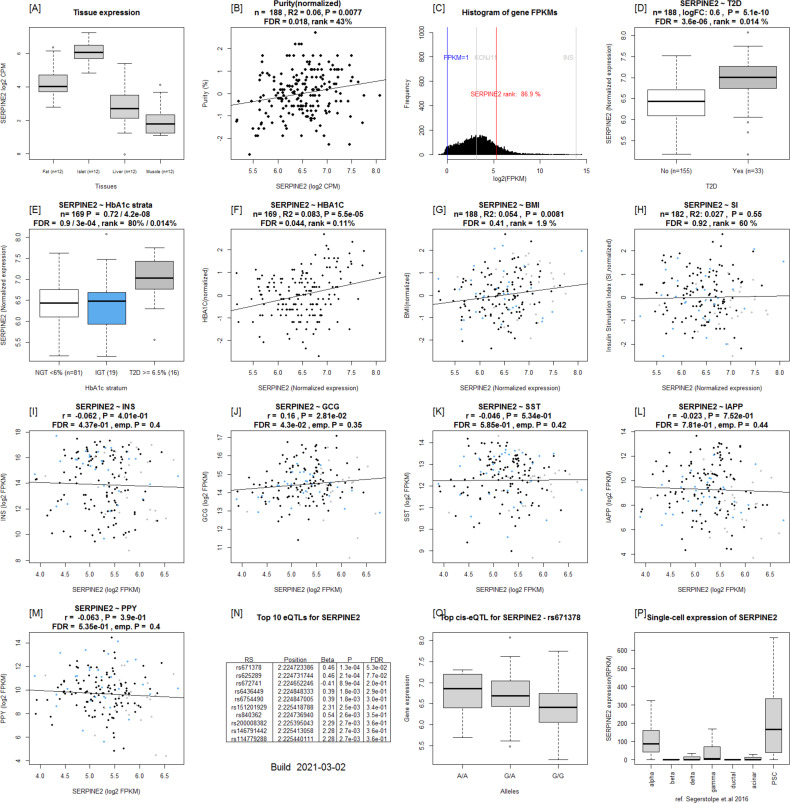
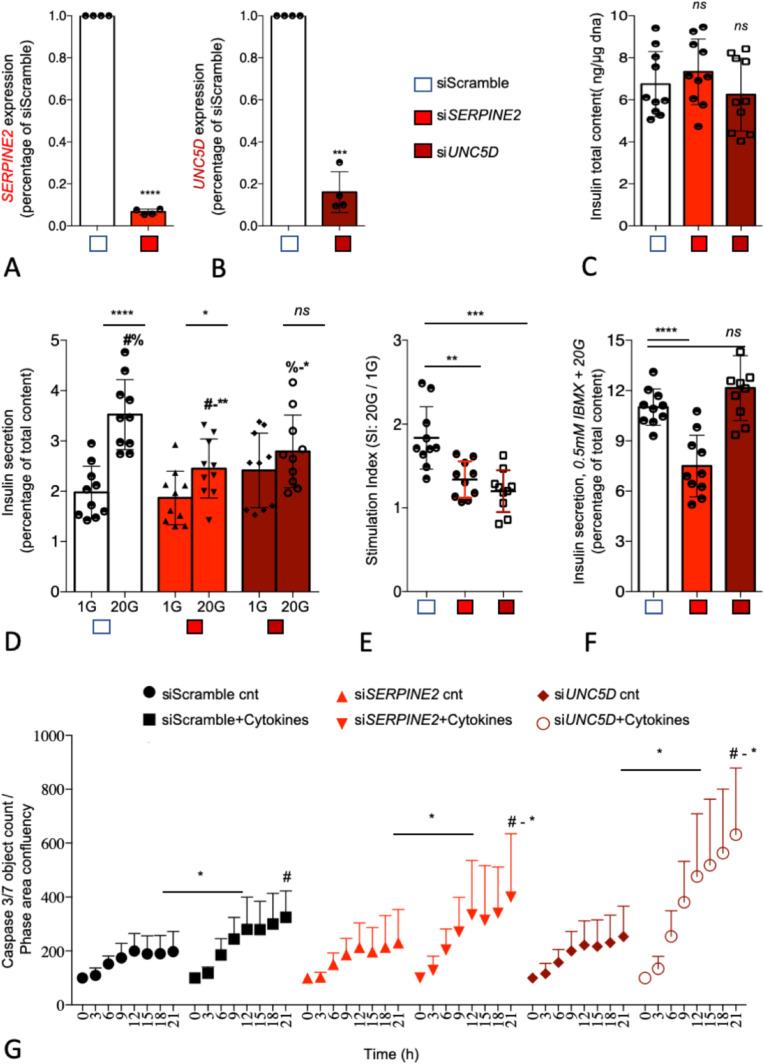
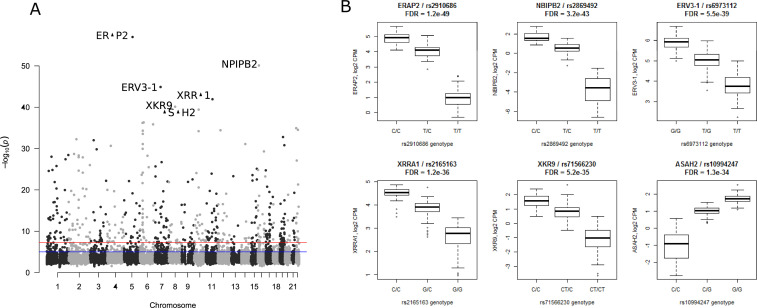
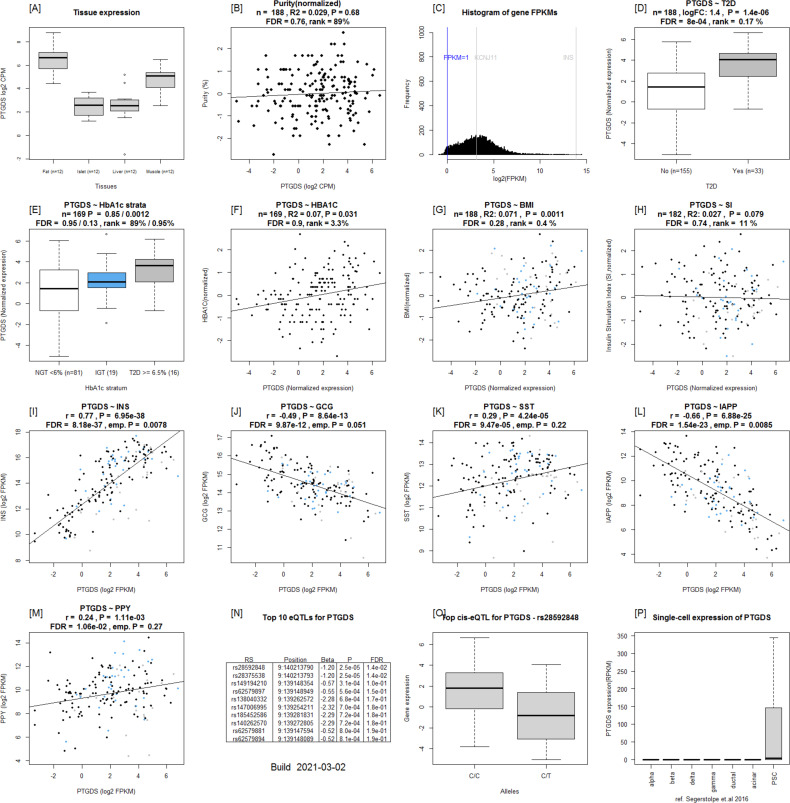
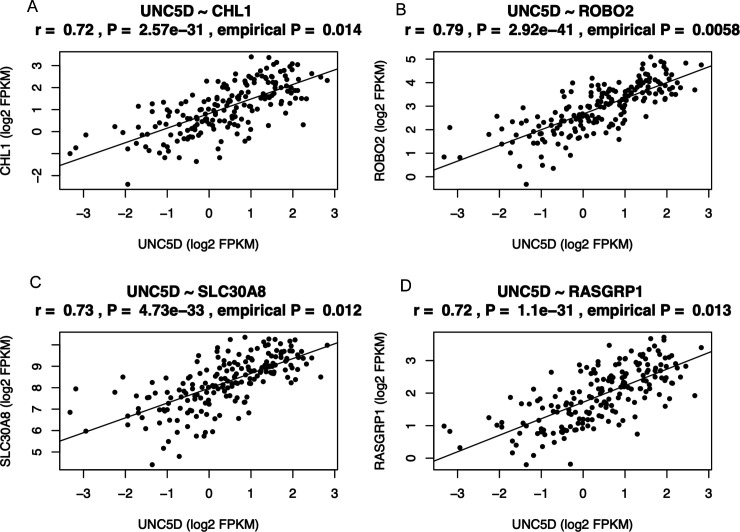
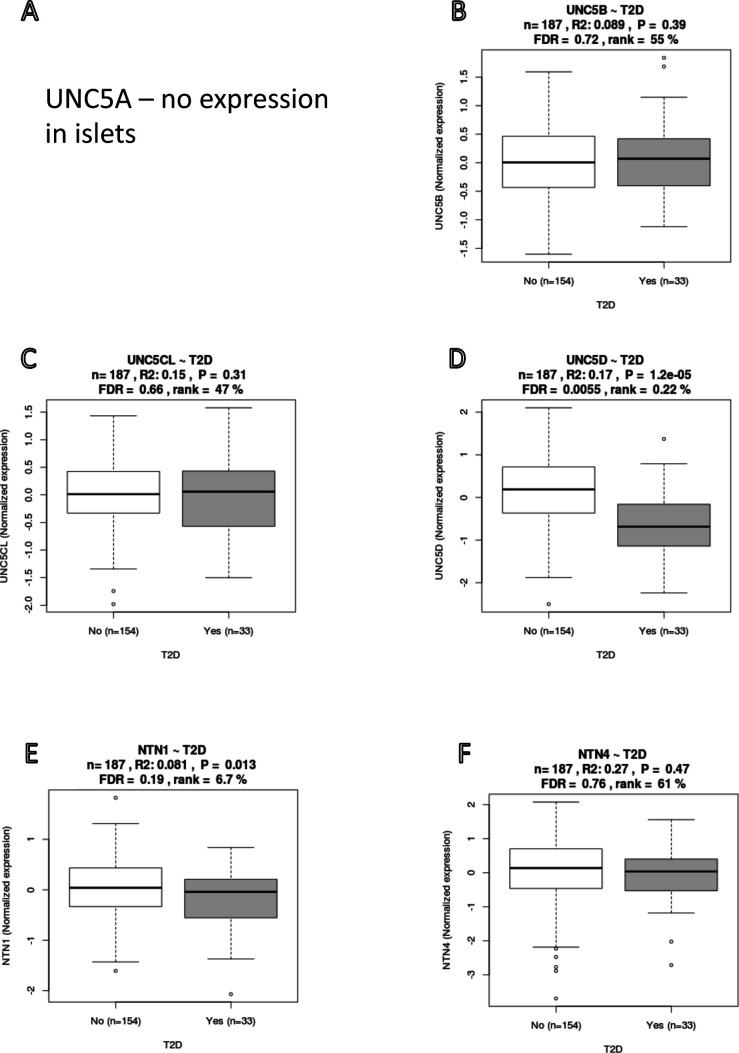
Characterization of gene expression in pancreatic islets and its alteration in type 2 diabetes (T2D) are vital in understanding islet function and T2D pathogenesis. We leveraged RNA sequencing and genome-wide genotyping in islets from 188 donors to create the Islet Gene View (IGW) platform to make this information easily accessible to the scientific community. Expression data were related to islet phenotypes, diabetes status, other islet-expressed genes, islet hormone-encoding genes and for expression in insulin target tissues. The IGW web application produces output graphs for a particular gene of interest. In IGW, 284 differentially expressed genes (DEGs) were identified in T2D donor islets compared with controls. Forty percent of DEGs showed cell-type enrichment and a large proportion significantly co-expressed with islet hormone-encoding genes; glucagon (<i>GCG</i>, 56%), amylin (<i>IAPP</i>, 52%), insulin (<i>INS</i>, 44%), and somatostatin (<i>SST</i>, 24%). Inhibition of two DEGs, <i>UNC5D</i> and <i>SERPINE2</i>, impaired glucose-stimulated insulin secretion and impacted cell survival in a human β-cell model. The exploratory use of IGW could help designing more comprehensive functional follow-up studies and serve to identify therapeutic targets in T2D.


Conflict of interest statement

The authors declare that they have no conflict of interest.

Figures

Figure S1.
Figure S1.. Study design of Islet Gene View.
Data from islets from human organ donors (n = 188, 155 nondiabetic and 33 with type 2 diabetes) expression of the gene in fat, islets, liver, and muscle, in the same pool of 12 individuals. Gene expression as a function of purity, defined as the percentage of endocrine tissue. Expression of the selected gene in relation to other genes in islets. Gene expression in relation to several diabetes-related phenotypes, that is, T2D diagnosis, HbA1c stratum, continuous HbA1c, BMI, and stimulatory index. Test statistics are reported, namely, coefficient of determination (R2), nominal P-value, and percentage rank among all genes as calculated based on sorted P-values. Gene expression in relation to the islet hormone coding genes; SST, INS, GCG, PPY, and GHRL. Spearman’s ρ (r) and the P-value of the gene based on the empirical correlation distribution is reported. INS, insulin; GCG, glucagon; SST, somatostatin; PPY, pancreatic polypeptide; IAPP, islet amyloid polypeptide. Top 10 eQTLs and cRNAseq expression data from Segerstolpe et al (2016).
Figure 1.
Figure 1.. Example output from Islet Gene View of GLRA1.
(A) Expression of the gene in fat, islets, liver, and muscle in the same pool of 12 individuals. (B) Gene expression as a function of purity, defined as the percentage of endocrine tissue. (C) Expression of the selected gene in relation to other genes in islets. (D, E, F, G, H) (Karpichev et al, 2008): Gene expression in relation to several diabetes-related phenotypes, that is, T2D diagnosis (D), HbA1c stratum (E), continuous HbA1c (F), BMI (G), and stimulatory index (H). Test statistics are reported, namely: coefficient of determination (R2), nominal P-value, and percentage rank among all genes as calculated based on sorted P-values. (I, J, K, L, M) (Gibson et al, 2018): Gene expression in relation to the secretory genes INS (I) GCG (J), SST (K), IAPP (L), and PPY (M). Spearman’s ρ (r) and the P-value of the gene based on the empirical correlation distribution is reported. INS, insulin; GCG, glucagon; SST, somatostatin; PPY, pancreatic polypeptide; IAPP, islet amyloid polypeptide. (N, O, P) and (O) Top 10 eQTLs and (P) single-cell RNAseq expression data from Segerstolpe et al (2016).
Figure 2.
Figure 2.. Characterization of differentially expressed genes between islets from T2D donors compared with controls and association with HbA1c levels.
Outer track: 120 genes were down-regulated (indicated in blue), whereas 164 genes were up-regulated in islets from T2D donors (indicated in red). Inner track: genes showing significant positive correlation with HbA1c levels (red) and negative correlation (blue).
Figure 3.
Figure 3.. Replication of differentially expressed genes in comparison with data from.
Solimena et al (2018)Venn diagram shows the overlap of differentially expressed genes from each of the studies. OD and PPP show DE data from organ donor islets and partially pancreatectomized donor islets from Solimena et al, whereas OD (LUND) show DE genes from our data. Nine genes were replicated in all three data sets. 13 genes were replicated between the OD islets from Solimena et al (presented in blue on the left) and our data, whereas 15 genes were replicated between PPP islets and our data (presented in green on the right). The arrows indicate the direction of effect: red arrows pointing down show down-regulation in T2D islets, whereas green arrows pointing up are up-regulated.
Figure S2.
Figure S2.. Islet gene view plots for CHL1.
(A) Expression of the CHL1 in fat, islets, liver, and muscle in the same pool of 12 individuals. (B) CHL1 expression as a function of purity, defined as the percentage of endocrine tissue. (C) Expression of CHL1 in relation to other genes in islets (Karpichev et al, 2008). (D, E, F, G, H) CHL1 is down-regulated in T2D donor islets compared to nondiabetic donor islets, (E) CHL1 is down-regulated in T2D donor islets when stratified by HbA1c stratum, (F) CHL1 is negatively correlated with HbA1c, (G) BMI, and (H) positively with stimulatory index (test statistics are reported, namely, coefficient of determination [R2], nominal P-value, and percentage rank among all genes as calculated based on sorted P-values). (I, J, K, L, M) (Gibson et al, 2018) Gene expression in relation to the secretory genes INS (I) GCG (J), SST (K), IAPP (L), and PPY (M). Spearman’s ρ (r) and the P-value of the gene based on the empirical correlation distribution is reported. INS, insulin; GCG, glucagon; SST, somatostatin; PPY, pancreatic polypeptide; IAPP, islet amyloid polypeptide. (N, O, P) Top 10 eQTLs and (P) cRNAseq expression data from Segerstolpe et al (2016) shows β-cell–enriched expression.
Figure S3.
Figure S3.. Islet gene view plots for HHATL.
(A) Expression of the HHATL in fat, islets, liver, and muscle in the same pool of 12 individuals. (B) HHATL expression as a function of purity, defined as the percentage of endocrine tissue. (C) Expression of HHATL in relation to other genes in islets (Karpichev et al, 2008). (D, E, F, G, H) HHATL is down-regulated in T2D donor islets compared with nondiabetic donor islets, (E) HHATL is down-regulated in T2D donor islets when stratified by HbA1c stratum, (F) HHATL is negatively correlated with HbA1c, (G) BMI, and (H) positively with stimulatory index (test statistics are reported, namely: coefficient of determination [R2], nominal P-value, and percentage rank among all genes as calculated based on sorted P-values). (I, J, K, L, M) (Gibson et al, 2018): Gene expression in relation to the secretory genes INS (I) GCG (J), SST (K), IAPP (L), and PPY (M). Spearman’s ρ (r) and the P-value of the gene based on the empirical correlation distribution is reported. INS, insulin; GCG, glucagon; SST, somatostatin; PPY, pancreatic polypeptide; IAPP, islet amyloid polypeptide. (N, O, P) Top 10 eQTLs and (P) cRNAseq expression data from Segerstolpe et al (2016) shows β-cell–enriched expression.
Figure S4.
Figure S4.. Islet gene view plots for SLC2A2.
(A) Expression of the SLC2A2 in fat, islets, liver, and muscle in the same pool of 12 individuals. (B) SLC2A2 expression as a function of purity, defined as the percentage of endocrine tissue. (C) Expression of SLC2A2 in relation to other genes in islets (Karpichev et al, 2008). (D, E, F, G, H) SLC2A2 is down-regulated in T2D donor islets compared with nondiabetic donor islets, (E) SLC2A2 is down-regulated in T2D donor islets when stratified by HbA1c stratum, (F) SLC2A2 is negatively correlated with HbA1c, (G) BMI, and (H) positively with stimulatory index (test statistics are reported, namely: coefficient of determination [R2], nominal P-value, and percentage rank among all genes as calculated based on sorted P-values). (I, J, K, L, M) (Gibson et al, 2018): Gene expression in relation to the secretory genes INS (I) GCG (J), SST (K), IAPP (L), and PPY (M). Spearman’s ρ (r) and the P-value of the gene based on the empirical correlation distribution is reported. INS, insulin; GCG, glucagon; SST, somatostatin; PPY, pancreatic polypeptide; IAPP, islet amyloid polypeptide. (N, O, P) Top 10 eQTLs and (P) cRNAseq expression data from Segerstolpe et al (2016).
Figure S5.
Figure S5.. Overlap of genes with expression between islets and insulin target tissues.
Overlap of genes with expression detected in all 12 samples per tissue in fat (F), liver (L), muscle (M), and islets (I).
Figure 4.
Figure 4.. Expression of the differentially expressed genes (DEGs) in fat (F), islet (I), liver (L), and muscle (M).
T1 shows expression of DEGs in fat, T2 in islets, T3 in liver, and T4 in muscle. Expression was defined as ≥ 1 count per million (CPM). DEGs expressed in islets and not in other tissues are shown in Segment A; islet and liver in Segment B; islet and muscle in Segment C; fat and islet in Segment D; fat, islet, and liver in segment E; islet, liver, and muscle in segment F; fat islet and muscle in segment G; and all four tissues in segment H. Most of the DE genes were expressed in all four tissues; coded as blue < 1, 0 = white, red ≥ 1.
Figure S6.
Figure S6.. Coexpression with secretory genes Venn diagram of genes co-expressed with secretory genes.
(A) Overlap of positively co-expressed genes (ρ ≥ 0, P ≤ 0.05) with insulin (INS), glucagon (GCG), somatostatin (SST), and islet amyloid polypeptide (IAPP). (B) Overlap of negatively co-expressed genes (ρ ≤ 0, P ≤ 0.05). (C) Overlap of all co-expressed genes regardless of direction (P ≤ 0.05).
Figure 5.
Figure 5.. Differentially expressed genes, cell type enrichment, and correlation with secretory genes.
Differentially expressed genes which are enriched in specific islet cell types are separated into specific segments. Outer tracks show expression in scRNAseq (Segerstolpe et al, 2016). Outermost track show expression in α cells (C1), followed by β cells (C2), γ cells (C3), Δ cells (C4), acinar cells (C5), and ductal cells (C6). Mean of RPKM (log2) values are plotted, with values code as: blue < 1 < red. Inner tracks show correlation with secretory genes starting with GCG on the outside (G), followed by INS (I), IAPP (A), and SST (S), coded as −0.5 ≥ blue, 0 = white, 0.5 ≤ red.
Figure 6.
Figure 6.. Differentially expressed genes grouped by cell type enrichment as reported by Segerstolpe et al (2016).
Differentially expressed genes which are enriched in specific islet cell types are separated into specific segments. Outer tracks show expression in scRNAseq (Segerstolpe et al, 2016). Outermost track show expression in α cells (C1), followed by β cells(C2), γ cells (C3), Δ cells (C4), acinar cells (C5), and ductal cells (C6). Mean of RPKM (log2) values are plotted, with values coded as: blue < 1 < red. Inner tracks show correlation with secretory genes starting with GCG on the outside (G), followed by INS (I), IAPP (A), and SST (S), coded as −0.5 ≥ blue, 0 = white, 0.5 ≤ red. The links show networks as inferred by GeNets.
Figure 7.
Figure 7.
SERPINE2 and UNC5D expression in islets. (A, B) UNC5D expression (A) was down-regulated in T2D donor islets and (B) correlated negatively with HbA1c levels. (C) Immunohistochemical staining of adult pancreas sections from normoglycemic and type 2 diabetic donors showed UNC5D (green) and insulin (red). Scale bar indicate 50 μm, pictures were taken with a 20× objective. Nuclei are shown in blue (DAPI). (D) In scRNA data from the islets, UNC5D showed expression in Δ and β cells only. (E, F) SERPINE2 expression was up-regulated in T2D donor islets and (F) positively correlated with that of HbA1c levels. (G) Immunohistochemical staining of adult pancreas sections from normoglycemic and type 2 diabetic donors showed SERPINE2 (green) and insulin (red). SERPINE2 expression was much higher in immunohistochemistry of the sections from T2D donors Scale bar indicate 50 μm, pictures were taken with a 20× objective. Nuclei are shown in blue (DAPI). (H) In ScRNA data, SERPINE2 showed ubiquitous expression, with enrichment in pancreatic stellate cells. Expression in α cells from T2D donors was significantly higher, whereas that in β cells was lower (although not statistically significant).
Figure S7.
Figure S7.. Islet Gene View graph of UNC5D.
(A, B, C) UNC5D shows highest expression in islets compared with in fat, liver, and muscle in the same pool of 12 individuals (A), UNC5D is positively correlated with purity (endocrine component) (B) and is ranked within the top 9.71% of genes expressed in the islets (C). (D, E, F, G, H) UNC5D expression is down-regulated in T2D donor islets compared with controls (D), as well as in IGT and T2D donors compared with NGT (E) and is negatively correlated with HbA1c levels (F) UNC5D expression in nominally negatively correlated with BMI (G) and positively with stimulatory index (H). Test statistics are reported, namely, coefficient of determination (R2), nominal P-value, and percentage rank among all genes as calculated based on sorted P-values. (I, J, K, L, M) Gene expression in relation to the secretory genes INS (I), GCG (J), SST (K), PPY (L), and IAPP (M). Spearman’s ρ (r) and the P-value of the gene based on the empirical correlation distribution is reported. INS, insulin; GCG, glucagon; SST, somatostatin; PPY, pancreatic polypeptide; IAPP, islet amyloid polypeptide. (N, O, P) Top 10 eQTLs and (P) cRNAseq expression data from Segerstolpe et al (2016).
Figure S8.
Figure S8.. Islet Gene View graph of SERPINE2.
(A, B, C) SERPINE2 shows highest expression in islets compared with in fat, liver, and muscle in the same pool of 12 individuals, (B) SERPINE2 expression is positively correlated with purity (endocrine component) (C) and is ranked 86.9% of genes expressed in the islet. (D, E, F) SERPINE2 expression is significantly up-regulated in islets from T2D donors compared with controls, (E) as well as compared with NGT donors and (F) is positively correlated with Hb1c levels. (G) SERPINE2 expression in nominally positively correlated with BMI. Test statistics are reported, namely: coefficient of determination (R2), nominal P-value, and percentage rank among all genes as calculated based on sorted P-values. (I, J, K, L, M) Gene expression in relation to the secretory genes INS (I) GCG (J), SST (K), PPY (L), and IAPP (M). Spearman’s ρ (r) and the P-value of the gene based on the empirical correlation distribution is reported. INS, insulin; GCG, glucagon; SST, somatostatin; PPY, pancreatic polypeptide; IAPP, islet amyloid polypeptide. (N, O, P) Top 10 eQTLs and (P) cRNAseq expression data from Segerstolpe et al (2016).
Figure 8.
Figure 8.. SERPINE2 and UNC5D knockdown (KD) leads to impaired insulin secretion and induced apoptosis in human pancreatic EndoC-bH1 cells.
(A, B) Effect of siRNA mediated KD of SERPINE2 and UNC5D mRNA. (C) Intracellular insulin content. (D) Glucose-stimulated insulin secretion. (E) Stimulation index (ratio of high glucose 20G to low glucose 1G). (F) Insulin secretion stimulated by IBMX. (G) Effect of KD of SERPINE2 and UNC5D on cytokines induced apoptosis measured with IncuCyte Caspase 3/7 green reagent. Data are shown as Mean with SD (n = 3–5). *P < 0.05, **P < 0.01, ***P < 0.001 (one-way ANOVA, followed by Tukey’s test; #a, b, two-tailed unpaired t test).
Figure S9.
Figure S9.. Islet expression quantitative trait loci (QTLs).
(A) Manhattan plot of eQTLs with the lowest P-value per gene. The top 6 eQTLs are marked with their target gene. (B) Boxplots of the top 6 most significant gene-lead eQTLs.
Figure S10.
Figure S10.. Islet Gene View plots of PTDGS.
(A, B, C) PTGDS is expressed in fat, liver, islet, and muscle, (B) not correlated with purity (C) and is in the top 65.6% of all genes expressed. (D, E, F, G) PTGDS expression is up-regulated in islets from T2D donors, (E) divided by HbA1c strata, (F) positively correlated with HbA1c levels, (G) positively correlated with BMI. (H, I, J, K, L, M) No correction with stimulatory index was observed; however, PTGDS expression was (I) positively correlated with INS (K) SST and (M) PPY expression whereas negatively with (J) GCG and (L) IAPP. Two Significant eQTLS for are reported. (N, O, C) The top eQTL is rs28592848, wherein T allele carriers have lower expression than (C). (P) cRNAseq expression data from Segerstolpe et al (2016).
Figure S11.
Figure S11.. UNC5D and insulin secretion/T2D loci.
(A, B, C, D) UNC5D expression was significantly correlated with that of (A) CHL1, (B) RASGRP1, (C) ROBO2, and (D) SLC30A8.
Figure S12.
Figure S12.. Expression of the UNC5 family and Nectrins in islets.
(A, B, C, D) UNC5A is not expressed; (B) UNC5B and (C) UNC5CL showed nominal, whereas (D) UNC5D showed significant down-regulation in T2D donor islets. (E, F) Expression in T2D donor islets for (E) NTN1 and (F) NTN4 showed a nominal down-regulation compared with versus nondiabetic donor islets.

Similar articles

Cited by

References

    1. Ahlqvist E, Storm P, Karajamaki A, Martinell M, Dorkhan M, Carlsson A, Vikman P, Prasad RB, Aly DM, Almgren P, et al. (2018) Novel subgroups of adult-onset diabetes and their association with outcomes: A data-driven cluster analysis of six variables. Lancet Diabetes Endocrinol 6: 361–369. 10.1016/S2213-8587(18)30051-2 - DOI - PubMed
    1. Alexandraki K, Piperi C, Kalofoutis C, Singh J, Alaveras A, Kalofoutis A (2006) Inflammatory process in type 2 diabetes: The role of cytokines. Ann N Y Acad Sci 1084: 89–117. 10.1196/annals.1372.039 - DOI - PubMed
    1. Belongie KJ, Ferrannini E, Johnson K, Andrade-Gordon P, Hansen MK, Petrie JR (2017) Identification of novel biomarkers to monitor beta-cell function and enable early detection of type 2 diabetes risk. PLoS One 12: e0182932. 10.1371/journal.pone.0182932 - DOI - PMC - PubMed
    1. Benjamini Y, Hochberg Y (1995) Controlling the false discovery rate: A practical and powerful approach to multiple testing. J R Stat Soc B 57: 289–300. 10.1111/J.2517-6161.1995.TB02031.X - DOI
    1. Bouton MC, Boulaftali Y, Richard B, Arocas V, Michel JB, Jandrot-Perrus M (2012) Emerging role of serpine2/protease nexin-1 in hemostasis and vascular biology. Blood 119: 2452–2457. 10.1182/blood-2011-10-387464 - DOI - PubMed

Publication types