. 2022 Jul 29;13(1):4270.
doi: 10.1038/s41467-022-31854-8.

A multimodal iPSC platform for cystic fibrosis drug testing

Affiliations

A multimodal iPSC platform for cystic fibrosis drug testing

Andrew Berical et al. Nat Commun. .

Abstract

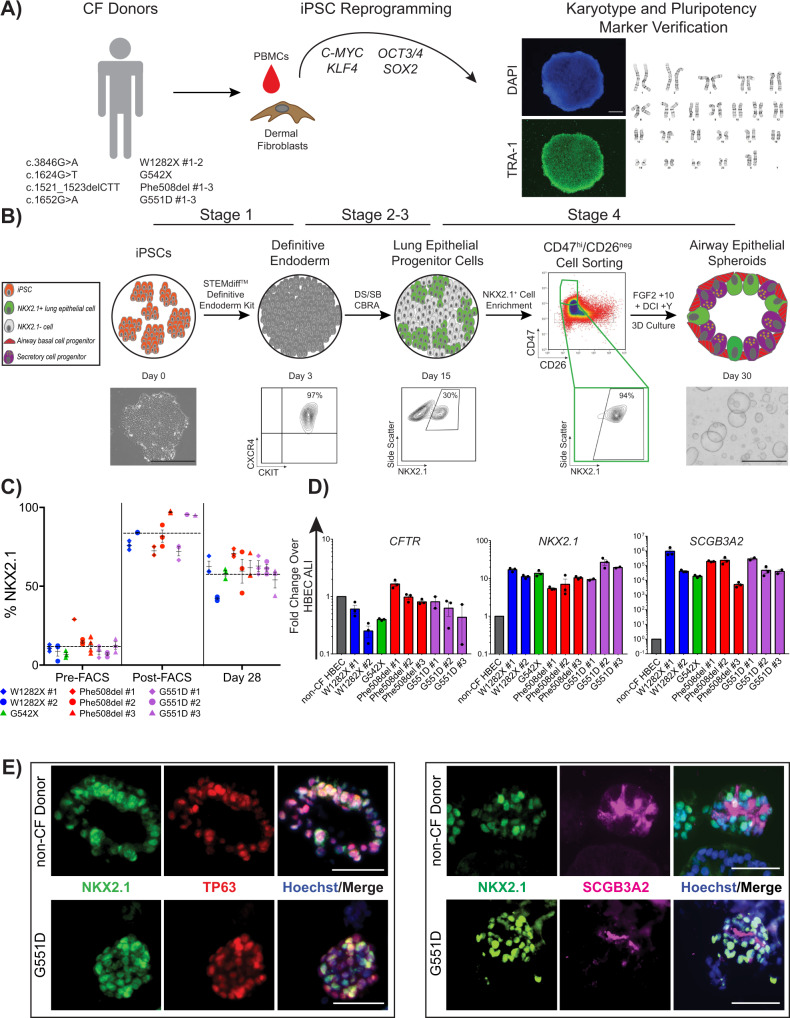
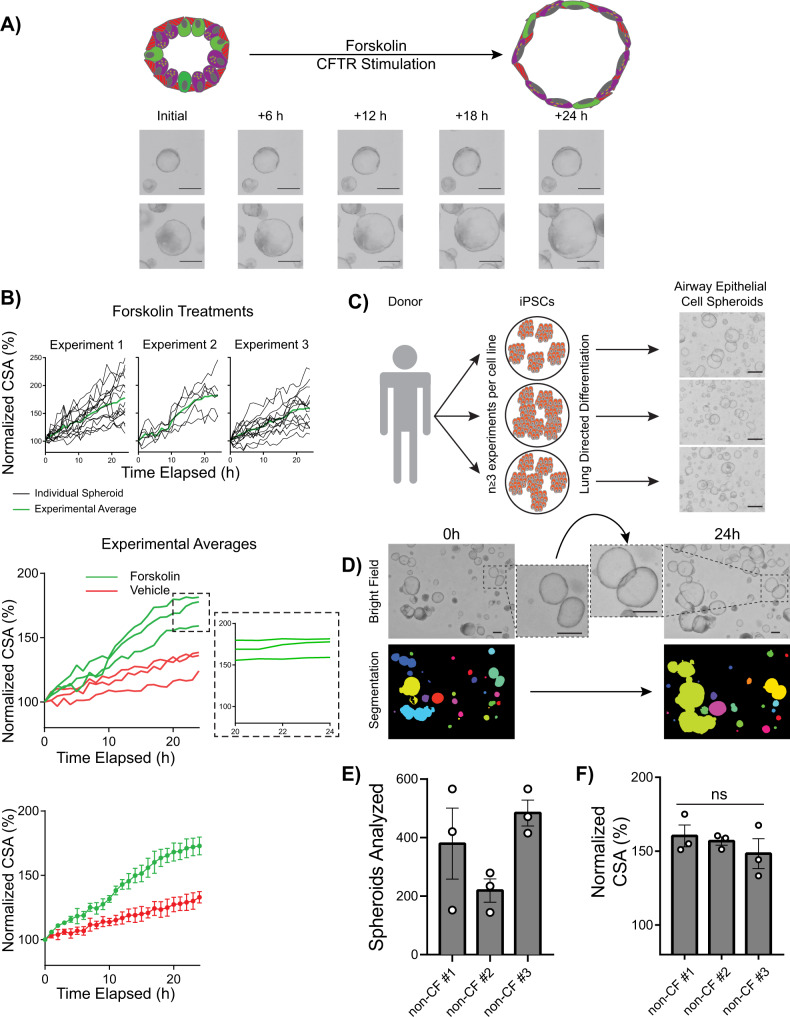
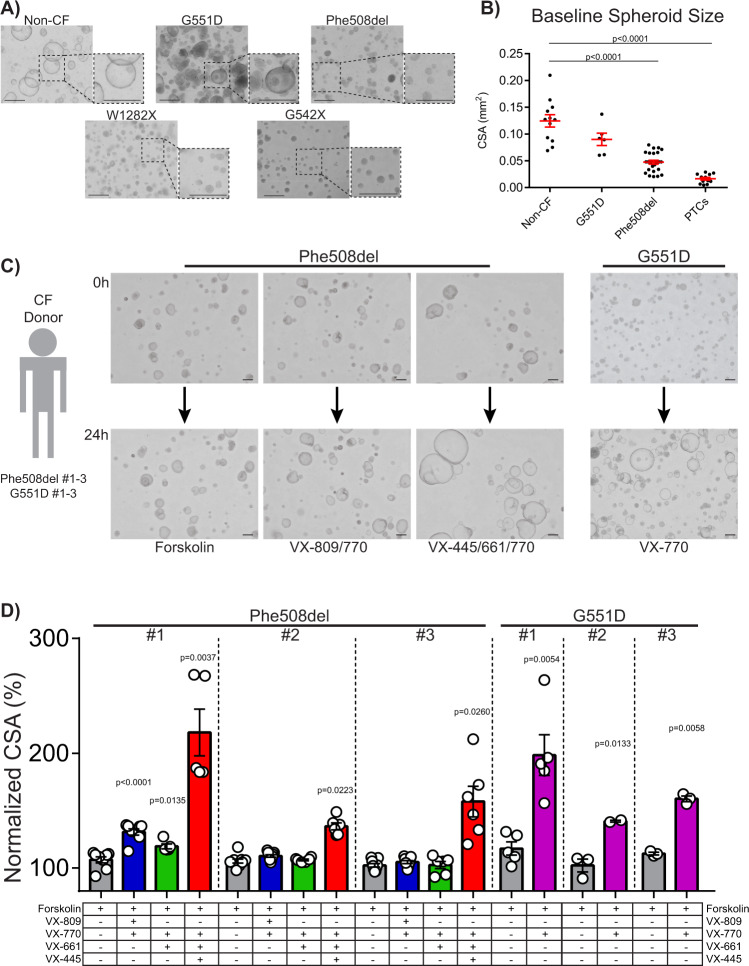
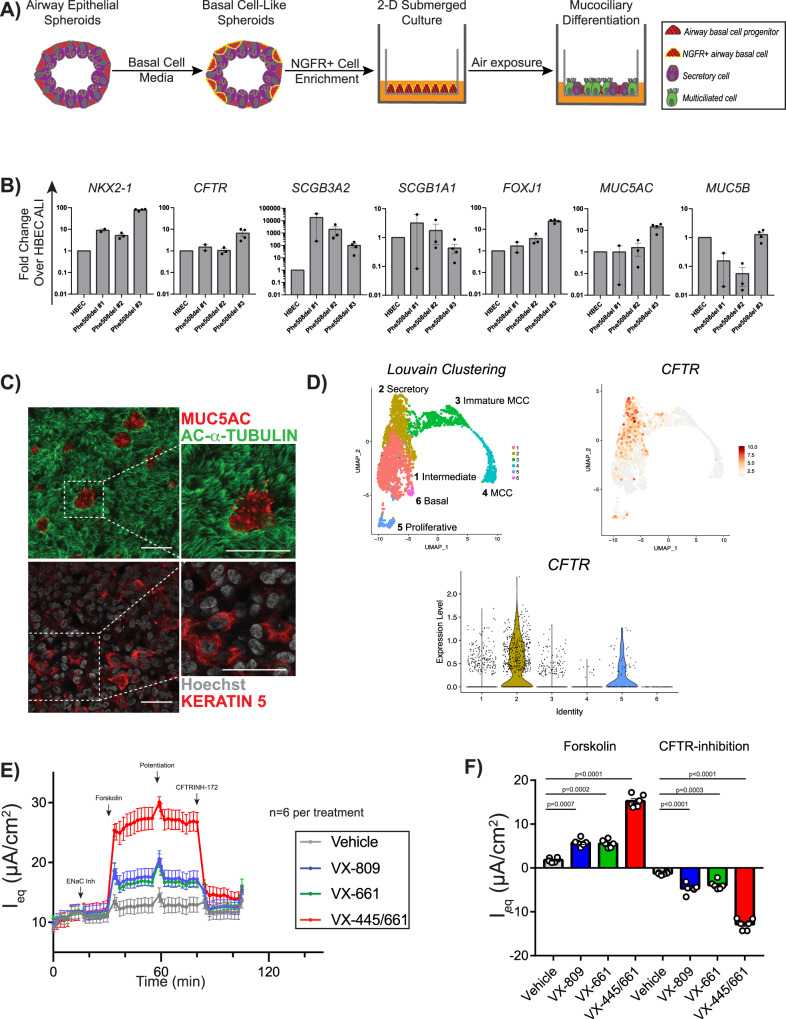
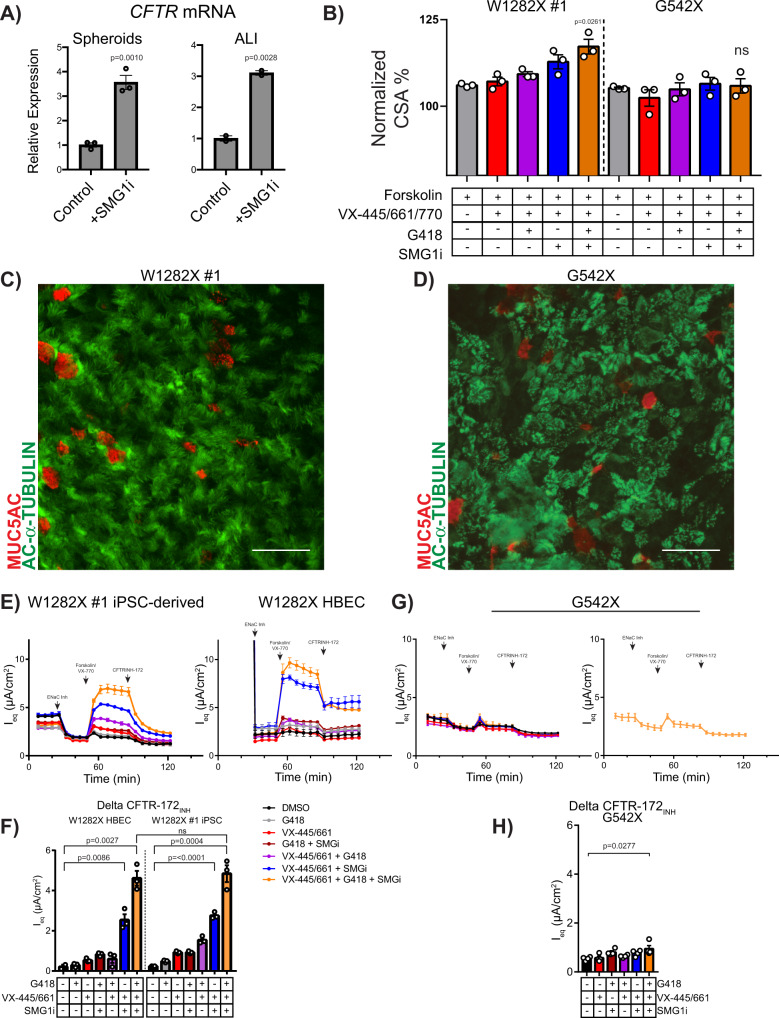
Cystic fibrosis is a monogenic lung disease caused by dysfunction of the cystic fibrosis transmembrane conductance regulator anion channel, resulting in significant morbidity and mortality. The progress in elucidating the role of CFTR using established animal and cell-based models led to the recent discovery of effective modulators for most individuals with CF. However, a subset of individuals with CF do not respond to these modulators and there is an urgent need to develop novel therapeutic strategies. In this study, we generate a panel of airway epithelial cells using induced pluripotent stem cells from individuals with common or rare CFTR variants representative of three distinct classes of CFTR dysfunction. To measure CFTR function we adapt two established in vitro assays for use in induced pluripotent stem cell-derived airway cells. In both a 3-D spheroid assay using forskolin-induced swelling as well as planar cultures composed of polarized mucociliary airway epithelial cells, we detect genotype-specific differences in CFTR baseline function and response to CFTR modulators. These results demonstrate the potential of the human induced pluripotent stem cell platform as a research tool to study CF and in particular accelerate therapeutic development for CF caused by rare variants.


Conflict of interest statement

The authors declare no competing interests.

Figures

Fig. 1
Fig. 1. iPSCs derived from multiple CF donors are differentiated into CFTR-expressing airway epithelial cells.
A Schematic describing approach by which selected individuals with CF caused by different classes of variants had somatic cells reprogrammed into iPSCs, which were subsequently tested for markers of pluripotency and G-band karyotype. Variant details and their abbreviations are provided. An example of TRA-1 staining and DAPI nuclear labeling (scale bar represents 500 µm) and normal 46XX karyotype are shown (see Supplementary Fig. 1 for individual karyotyping). B Schematic of directed differentiation protocol to generate airway epithelial cell spheroids. Flow cytometry checkpoints shown were utilized to ensure adequate differentiation efficiency at the stages indicated. Representative images of a single iPSC colony and several airway epithelial spheroids shown (scale bars represent 500 µm). C Frequency of NKX2-1+ cells as a percentage of all cells at day 14–16, before (Pre-FACS), immediately after sorting CD47hi/CD26neg cells (Post-FACS), and 14 days later (day 28). Each point represents an individual experiment for the iPSC line indicated in the key (n = 3 biological replicates of independent differentiations). Horizontal dashed lines represent the average NKX2-1+ % across all cell lines at the designated time point. D mRNA expression of canonical airway epithelial cell markers on day 28–30 of differentiation in iPSC-derived airway epithelial spheroids from the iPSC lines indicated, calculated relative to levels within non-CF HBEC-derived ALI cultures. Each point represents an individual experiment (n = 3). E Examples of immunolabeling of day 28–30 non-CF and CF iPSC-derived airway epithelial spheroids with antibodies against NKX2-1 and TP63 (left panels) and SCGB3A2 (right panels); scale bars represent 50 µm. Lines and error bars represent mean ± standard error.
Fig. 2
Fig. 2. Quantification of FIS in iPSC-derived airway epithelial spheroids from non-CF donors.
A Schematic of FIS assay with representative images of two spheres immediately prior to as well as 6, 12, 18, and 24 h after forskolin addition. B Kinetics of non-CF airway spheroid FIS measured by the change in cross-sectional area (CSA). Top panel shows individual spheroid FIS (black lines) and average FIS (green lines) (n = 3 experiments). The middle panel shows compiled FIS (and vehicle control) experimental averages with magnified inset indicating 20–24 h. Bottom panel shows mean and standard error for each time point depicted in the middle panel (n = 3 experiments). C Experimental approach for the FIS assay. Each iPSC line was differentiated in three independent experiments and FIS performed on day 28–32 (n = 3 biological replicates of independent differentiations were analyzed per donor for each of three donors). Representative images of non-CF airway epithelial spheroids (day 28) are shown on the right. D Automated imaging analysis of non-CF spheroids before (left) and after (right) forskolin stimulation using OrganoSegTM to quantify the change in CSA. E Number of airway spheroids analyzed per experiment for the non-CF cell line indicated. Each point represents an independent experiment. F Three non-CF donor FIS responses shown. Each point represents an independent experiment. No significant differences between samples, by one-way ANOVA. Scale bars represent 250 µm. Lines and error bars represent mean ± standard error.
Fig. 3
Fig. 3. Characterization of CF iPSC-derived airway epithelial spheroids in terms of morphology, size, and FIS with and without CFTR modulator treatment.
A Representative microscopy images (of n ≥ 3 biological replicates from independent differentiations for each cell line) of airway spheroids from CF and non-CF donors demonstrate differences in morphologic appearance; dashed boxes depict magnified views. B Baseline spheroid size differs with CFTR genotype. Each point represents average spheroid size before forskolin stimulation within an individual experiment (biological replicates from independent differentiations: n = 12 for non-CF, n = 6 for G551D, n = 26 for Phe508del, n = 12 for PTCs). C Representative spheroid images (of n > 3 biological replicates from independent differentiations for each cell line) for the CFTR variants indicated before (0 h) and after (24 h) treatment with compounds shown at bottom of panel. D Change in CSA after treatment of CF airway epithelial cell spheroids with CFTR modulators (n > 3 biological replicates from independent differentiations with exception of n = 2 for G551D #2 VX-770 treatment). P values were calculated using paired two-tailed Student’s t test comparing the treatment sample to forskolin control. Scale bars represent 250 µm. Lines and error bars represent mean ± standard error.
Fig. 4
Fig. 4. iPSC-derived airway epithelial cells grow in ALI culture and can be used to detect CFTR-dependent ion flow.
A Schematic of the generation of iPSC-derived ALI cultures via FACS-purified NGFR + airway basal cells. B mRNA expression of canonical airway epithelial markers within iPSC-derived ALI cultures, compared to non-CF HBEC ALI cultures (biological replicates from independent differentiations: n = 2 for Phe508del #1, n = 3 for Phe508del #2, n = 4 for Phe508del #3). Each point represents an individual experiment. C Example of immunolabeling of iPSC-derived Phe508del ALI cultures with antibodies against markers of multiciliated (acetylated-α-tubulin), mucus secreting (MUC5AC), and airway basal cells (KRT5) with nuclei counterstained with Hoechst. D Uniform Manifold Approximation and Projections (UMAPs) of scRNA-seq of non-CF iPSC-derived airway ALI cultures depicting Louvain clustering and violin plots demonstrating the expression of CFTR in the annotated clusters. E Equivalent current measurements of Phe508del ALI cultures (n = 6 per treatment). Measurements are shown at baseline and after ENaC inhibition, forskolin treatment, CFTR potentiation with Genistein, and CFTR inhibition (arrows). F Quantification of peak delta forskolin and CFTR-inhibition effects of assay results shown in (E) (n = 6 experimental replicates from independent wells of a differentiation). P values were calculated using paired Student’s t test. Lines and error bars represent mean ± standard error. Scale bars represent 50 µm.
Fig. 5
Fig. 5. Assessment of CFTR function in W1282X and G542X iPSC-derived airway spheroids and mucociliary cultures.
A Treatment with SMG1i increases mRNA expression levels of CFTR in W1282X iPSC-derived spheroids (left) and mucociliary ALI cultures (right) compared to controls (experimental replicates from independent wells of a differentiation: n = 3 for control, n = 2 for SMG1i treatment). B FIS assay of W1282X #1 and G542X iPSC-derived airway spheroids after combination treatment with VX-445/VX-661/VX-770, G418, and SMG1i (n = 3). C, D Examples of immunolabeling of iPSC-derived W1282X #1 and G542X ALI cultures with antibodies against markers of multiciliated (acetylated-α-tubulin) and mucus secreting (MUC5AC) cells. E, F Electrophysiological assessment and quantification of W1282X #1 iPSC-derived (left) and primary mucociliary cells (right) using a TECC24 instrument after the indicated treatments (n = 3 experimental replicates from independent wells of a differentiation). G, H Electrophysiological assessment and quantification of G542X iPSC-derived mucociliary cells with the indicated treatments. Right panel shows treatment condition that led to improved CFTR current (n = 3 experimental replicates from independent wells of a differentiation). P values were calculated using unpaired Student’s t test. Scale bars represent 50 µm. Lines and error bars represent mean ±  standard error.

Similar articles

Cited by

References

    1. Ratjen F, et al. Cystic fibrosis. Nat. Rev. Dis. Prim. 2015;1:15010–15019. doi: 10.1038/nrdp.2015.10. - DOI - PMC - PubMed
    1. Riordan JR, et al. Identification of the cystic fibrosis gene: cloning and characterization of complementary DNA. Science. 1989;245:1066–1073. doi: 10.1126/science.2475911. - DOI - PubMed
    1. Cutting, G. R. Cystic fibrosis genetics: from molecular understanding to clinical application. Nat. Rev. Genet.16, 45–56 (2015). - PMC - PubMed
    1. Accurso FJ, et al. Effect of VX-770 in persons with cystic fibrosis and the G551D-CFTR mutation. N. Engl. J. Med. 2010;363:1991–2003. doi: 10.1056/NEJMoa0909825. - DOI - PMC - PubMed
    1. Davies JC, et al. VX-659-Tezacaftor-Ivacaftor in patients with cystic fibrosis and one or two Phe508del alleles. N. Engl. J. Med. 2018;379:1599–1611. doi: 10.1056/NEJMoa1807119. - DOI - PMC - PubMed

Publication types

MeSH terms

Substances