

GSDMD drives canonical inflammasome-induced neutrophil pyroptosis and is dispensable for NETosis
- PMID: 35899491
- PMCID: PMC9535806
- DOI: 10.15252/embr.202154277
GSDMD drives canonical inflammasome-induced neutrophil pyroptosis and is dispensable for NETosis
Abstract
Neutrophils are the most prevalent immune cells in circulation, but the repertoire of canonical inflammasomes in neutrophils and their respective involvement in neutrophil IL-1β secretion and neutrophil cell death remain unclear. Here, we show that neutrophil-targeted expression of the disease-associated gain-of-function Nlrp3A350V mutant suffices for systemic autoinflammatory disease and tissue pathology in vivo. We confirm the activity of the canonical NLRP3 and NLRC4 inflammasomes in neutrophils, and further show that the NLRP1b, Pyrin and AIM2 inflammasomes also promote maturation and secretion of interleukin (IL)-1β in cultured bone marrow neutrophils. Notably, all tested canonical inflammasomes promote GSDMD cleavage in neutrophils, and canonical inflammasome-induced pyroptosis and secretion of mature IL-1β are blunted in GSDMD-knockout neutrophils. In contrast, GSDMD is dispensable for PMA-induced NETosis. We also show that Salmonella Typhimurium-induced pyroptosis is markedly increased in Nox2/Gp91Phox -deficient neutrophils that lack NADPH oxidase activity and are defective in PMA-induced NETosis. In conclusion, we establish the canonical inflammasome repertoire in neutrophils and identify differential roles for GSDMD and the NADPH complex in canonical inflammasome-induced neutrophil pyroptosis and mitogen-induced NETosis, respectively.
Keywords: NETosis; gasdermin D; inflammasome; neutrophil; pyroptosis.
© 2022 The Authors.
Figures
- A, B
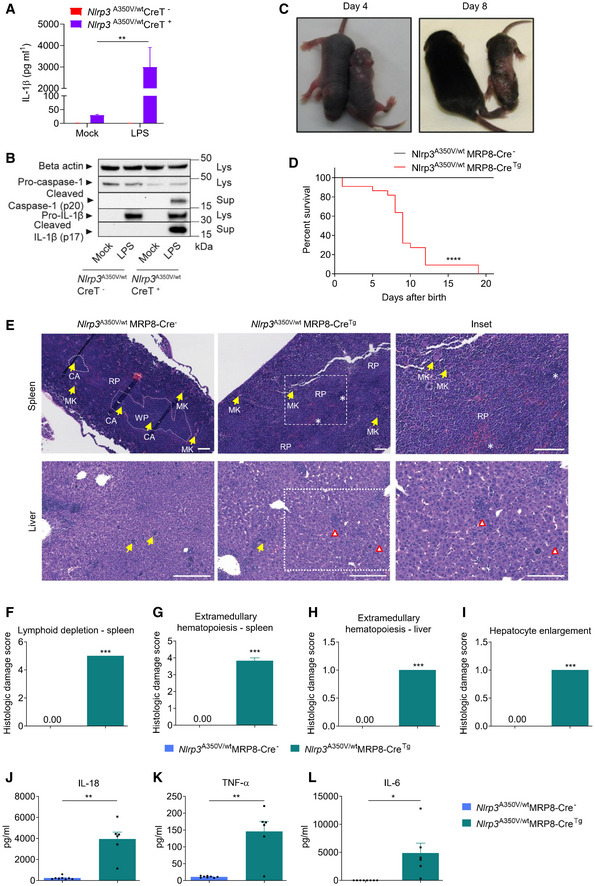
Neutrophils isolated from tamoxifen‐treated Nlrp3 A350V/wt CreT+ and Nlrp3 A350V/wt CreT− mice were incubated with LPS (3 h) before culture media were analysed for secreted IL‐1β (A), and cell lysates and culture media were immunoblotted for β‐actin, caspase‐1 and IL‐1β (B). Cytokine values represent mean ± SEM of n = 4 biological repeats. Statistical significance was analysed by two‐way ANOVA and P‐values were corrected for multiple comparisons (Bonferroni). **P ≤ 0.01.
- C
Representative pictures of Nlrp3 A350V/wt MRP8‐CreTg and Nlrp3 A350V/wt MRP8‐Cre− mice on days 4 and 8 after birth. Left side in each picture: Nlrp3 A350V/wt MRP8‐Cre− mice; right side in each picture: Nlrp3 A350V/wt MRP8‐CreTg. Abscesses (day 4) and scaling erythema (day 8) are observed in Nlrp3 A350V/wt MRP8‐CreTg mice.
- D
Survival curves of Nlrp3 A350V/wt MRP8‐CreTg (n = 22) and littermate Nlrp3 A350V/wt MRP8‐Cre− (n = 21) mice. Statistical significance was analysed by the log‐rank Mantel–Cox test. ****P ≤ 0.0001.
- E
Representative H&E‐stained sections of the spleen (top, scale bar: 100 μM) and liver (bottom, scale bar: 200 μM) of Nlrp3 A350V/wt MRP8‐CreTg and littermate Nlrp3 A350V/wt MRP8‐Cre− mice. Spleens of Nlrp3 A350V/wt MRP8‐Cre− control mice (top left) display characteristic white pulp (WP) regions (example shown surrounded by dashed line) composed of lymphoid follicles and periarteriolar lymphoid sheaths (PALS), which at this magnification are recognized by dark‐purple staining, large aggregates of lymphocytes surrounding the central artery (CA) and their distinctive separation from the red‐staining red pulp (RP). WP was largely absent in spleens of Nlrp3 A350V/wt MRP8‐CreTg (top middle). Megakaryocytes (MK) are indicated for easier recognition of areas of extramedullary haematopoiesis (EMH). Most of the spleen parenchyma of Nlrp3 A350V/wt MRP8‐CreTg animals was replaced by EMH of mostly myeloid lineage, which can be recognized by the medium‐sized cells with more cytoplasm, giving a lighter appearance (inset). In both the overview picture (top middle picture) and inset (top right) of Nlrp3 A350V/wt MRP8‐CreTg spleen, a small amount of EMH of the erythroid lineage is present that can be recognized by small aggregates of darker‐stained, smaller cells (asterisk, *). Liver sections of both Nlrp3 A350V/wtMRP8‐Cre− control mice and diseased Nlrp3 A350V/wt MRP8‐CreTg pups displayed comparable EMH of the erythroid lineage (bottom left picture, indicated with yellow arrows). Liver sections of Nlrp3 A350V/wt MRP8‐CreTg pups also showed a modest increase in EMH of the myeloid lineage (bottom middle picture and inset (scale bar: 100 μM) in the bottom right, indicated with red arrowheads), as well as hepatocyte enlargement.
- F–I
H&E‐stained histological sections of the spleen (F, G) or liver (H, I) of Nlrp3 A350V/wt MRP8‐Cre− (Cre−, n = 8) and Nlrp3 A350V/wt MRP8‐CreTg (CreTg, n = 6) mice were assigned a score of 0–5 for lymphoid depletion (F) or EMH (G, H) or hepatocyte enlargement (I) by a board‐certified pathologist. Values represent mean ± SEM of n = 6–8 biological repeats. Statistical significance was analysed by the Mann–Whitney U‐test. ***P ≤ 0.001.
- J–L
Cytokine secretion analysis (Luminex) of serum samples obtained on day 7 from Nlrp3 A350V/wt MRP8‐Cre− (Cre−, n = 8) and Nlrp3 A350V/wt MRP8‐CreTg (CreTg, n = 6) pups. Values represent mean ± SEM of n = 6–8 biological repeats. Statistical analysis of serum cytokine levels was performed by the Welch's t‐test. *P ≤ 0.05; **P ≤ 0.01.
- A
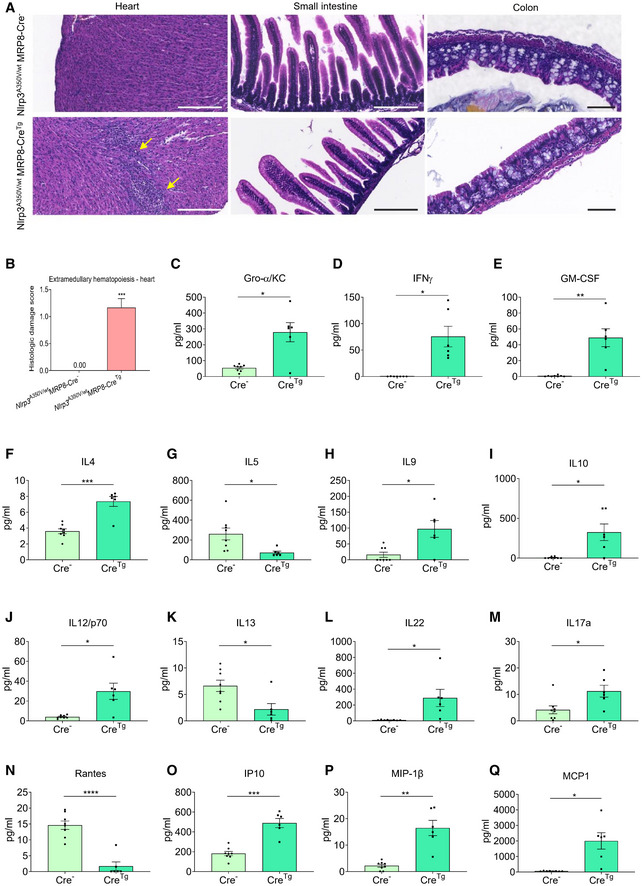
Representative H&E‐stained sections of the heart (scale bar: 200 μM), small intestine (scale bar: 200 μM) and colon (scale bar: 100 μM) of Nlrp3 A350V/wt MRP8‐CreTg and littermate Nlrp3 A350V/wt MRP8‐Cre‐ mice. A mild EMH (arrows) is present in the heart sections of Nlrp3 A350V/wt MRP8‐CreTg mice.
- B
An expert pathologist graded the presence of EMH in H&E‐stained histological sections of the heart of Nlrp3 A350V/wt MRP8‐Cre‐ (Cre‐, n = 8) and Nlrp3 A350V/wt MRP8‐CreTg (CreTg, n = 6) pups using a score of 0–5. Values represent mean ± SEM of n = 6–8 biological repeats. Statistical analysis of histological damage score was determined by Mann–Whitney U‐test. ***P < 0.001.
- C–Q
Cytokine and chemokine concentrations in serum samples obtained on day 7 from Nlrp3 A350V/wt MRP8‐Cre‐ (Cre‐, n = 8) and Nlrp3 A350V/wt MRP8‐CreTg (CreTg, n = 6) pups. Values represent mean ± SEM of biological repeats. Statistical analysis of serum cytokine levels was performed using Welch's t‐test. *P < 0.05; **P < 0.01; ***P < 0.001; ****P < 0.0001.
- A–C
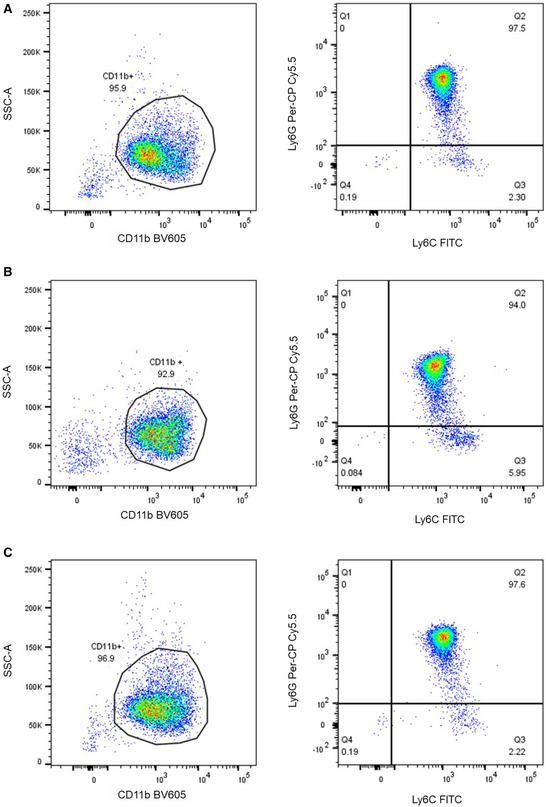
Representative flow cytometry plots of neutrophils isolated from the bone marrow of C57Bl6/N (A), B6Nlrp1b+ (B) and AIM2 KO (C) mice. Left plots: identification of CD11b+ enriched population; right panels: Ly6G+/Ly6C+ neutrophils on gated CD11b+ cells. Data are representative of n = 3 biological repeats.

- A–H
LPS‐primed neutrophils of indicated genotypes were left untreated (Mock) or stimulated with LeTx (3 h) (A, B), TcdA (3 h) (C, D), infected with F. tularensis (18 h) (E, F) or stimulated with FlaTox (3 h) (G, H). IL‐1β secretion levels were determined in culture media (A, C, E, G); and combined cell lysates and culture media (Lys+Sup) were immunoblotted for cleavage of pro‐IL‐1β (~39 kDa) into mature IL‐1β (p17) (B, D, F, H). Cytokine values represent mean ± SEM of n = 3 biological repeats and immunoblots are representative of n = 3 biological repeats. Statistical significance was analysed by two‐way ANOVA: *P ≤ 0.05; **P ≤ 0.01. P‐values were corrected for multiple comparisons (Bonferroni).
- A, B
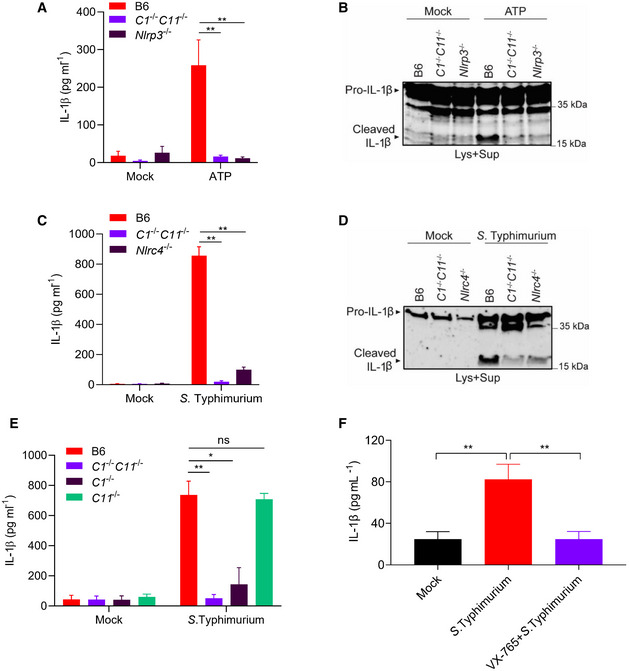
LPS‐primed neutrophils of the indicated genotypes were left untreated (Mock) or stimulated with ATP (1 h). IL‐1β secretion levels were determined in culture media (A); and combined cell lysates and culture media (Lys+Sup) were immunoblotted for cleavage of pro‐IL‐1β (~39 kDa) into mature IL‐1β (p17) (B). Cytokine values represent mean ± SEM of n = 3 biological repeats. Statistical significance was determined by two‐way ANOVA: **P ≤ 0.01. P‐values were corrected for multiple comparisons (Bonferroni).
- C–E
Neutrophils of the indicated genotypes were left untreated (Mock) or infected with S. Typhimurium (3 h). IL‐1β secretion levels were determined in culture media (C, E), and combined cell lysates and culture media (Lys+Sup) were immunoblotted for cleavage of pro‐IL‐1β (~39 kDa) into mature IL‐1β (p17) (D). Cytokine values represent mean ± SEM of n = 3 biological repeats. Statistical significance was determined by two‐way ANOVA: *P ≤ 0.05; **P ≤ 0.01; ns = non‐significant. P‐values were corrected for multiple comparisons (Bonferroni).
- F
LPS‐primed human blood neutrophils were left untreated (Mock) or infected with S. Typhimurium (MOI 0.5) for 3 h in the presence or absence of VX‐765 before IL‐1β secretion levels in culture media were determined. Cytokine data represent mean ± SEM of n = 4 donors. Statistical significance was determined by one‐way ANOVA: **P ≤ 0.01. P‐values were corrected for multiple comparisons (Bonferroni).
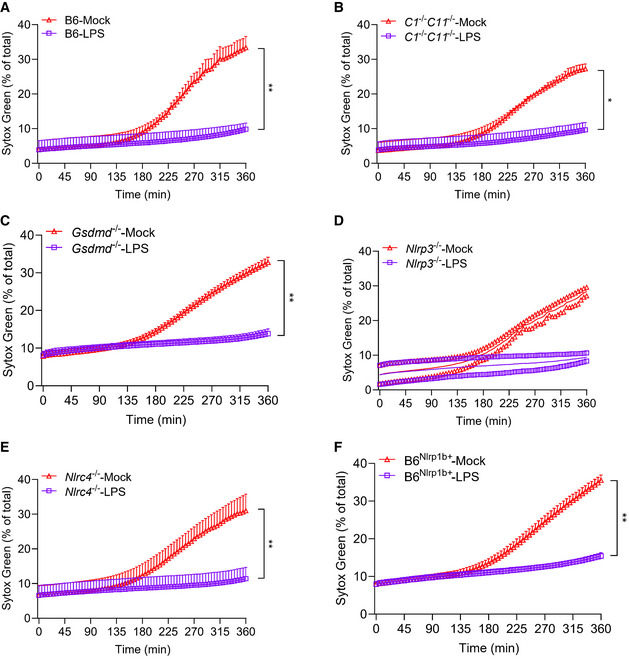
- A–F
Neutrophils of the indicated genotypes were left untreated (Mock) or stimulated with LPS. PMP was assessed by measurement of SYTOX Green incorporation over time (A–F). Values represent mean ± SEM of three independent biological repeats (A–C, E, F). Statistical significance was determined by non‐parametric wilcoxon two‐tailed t‐test: *P ≤ 0.05; **P ≤ 0.01. (D) Data are depicted as individual data points with a mean of n = 2 biological repeats.
- A–D
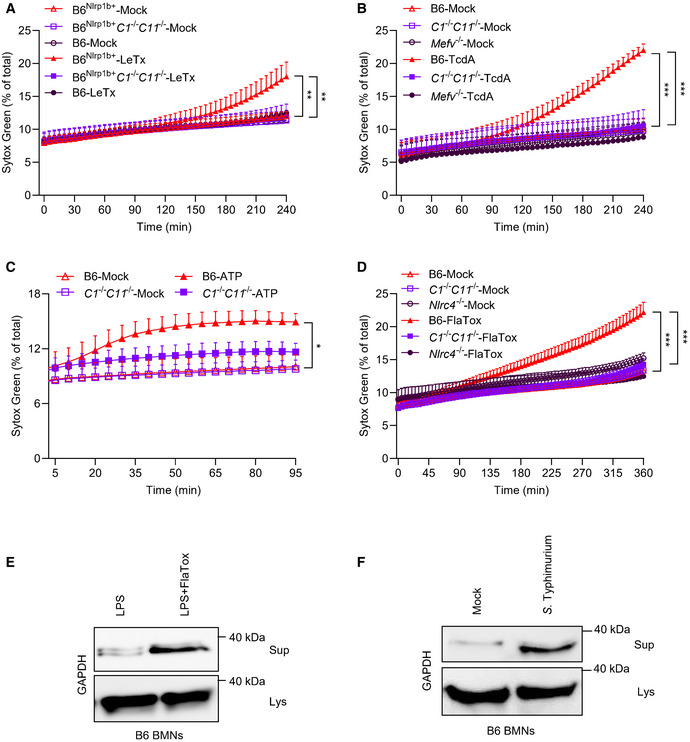
LPS‐primed neutrophils of the indicated genotypes were left untreated (Mock) or stimulated with LeTx (A), TcdA (B), ATP (C) or FlaTox (D). PMP was assessed by measurement of SYTOX Green incorporation over time. Data information: Error bars represent mean ± SEM of n = 3 biological repeats. Statistical significance was analysed by two‐way ANOVA: *P ≤ 0.05; **P ≤ 0.01; ***P ≤ 0.001. P‐values were corrected for multiple comparisons (Bonferroni).
- E
LPS‐primed B6 BMNs were left untreated (LPS) or subsequently stimulated with FlaTox (LPS+FlaTox) for 3 h. Data are representative of n = 3 biological repeats.
- F
B6 BMNs were left untreated (Mock) or infected with S. Typhimurium at MOI 25. Culture media (Sup) and whole‐cell lysates (Lys) were immunoblotted for the release of cytosolic GAPDH into culture media. Data are representative of n = 3 biological repeats.
- A–I
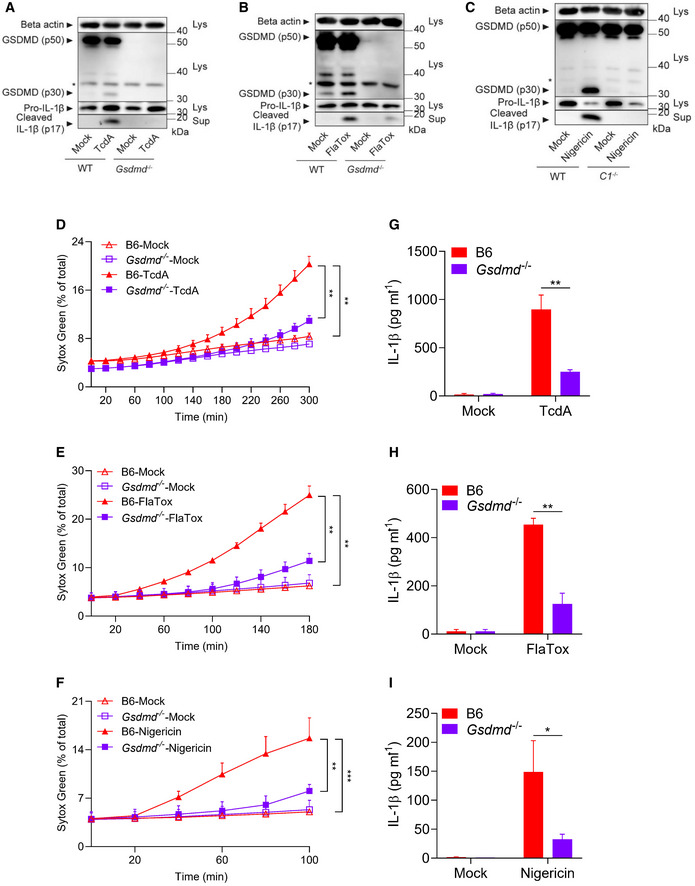
LPS‐primed neutrophils of the indicated genotypes were left untreated (Mock) or stimulated with TcdA (3 h) (A, D, G), FlaTox (3 h) (B, E, H) or nigericin (100 min) (C, F, I).
- A–C
Whole‐cell lysates (Lys) and culture media (Sup) were immunoblotted separately for cleavage of pro‐IL‐1β (~39 kDa) into mature IL‐1β (p17) and cleaved GSDMD (p30). * With Western blots indicates non‐specific cross‐reactivity of the antibody. Data are representative of n = 3 (A, B) or n = 2 (C) biological repeats.
- D–F
PMP was assessed by measurement of SYTOX Green incorporation over time. Data information: Values represent mean ± SEM of n = 3 (D, E) or n = 4 (F) biological repeats. Statistical significance was analysed by two‐way ANOVA: **P ≤ 0.01; ***P ≤ 0.001. P‐values were corrected for multiple comparisons (Bonferroni).
- G–I
IL‐1β secretion levels were determined by Luminex assay. Values represent mean ± SEM of n = 3 (G, I) or n = 4 (H) biological repeats. Statistical significance was analysed by two‐way ANOVA: *P ≤ 0.05; **P ≤ 0.01.
- A–H
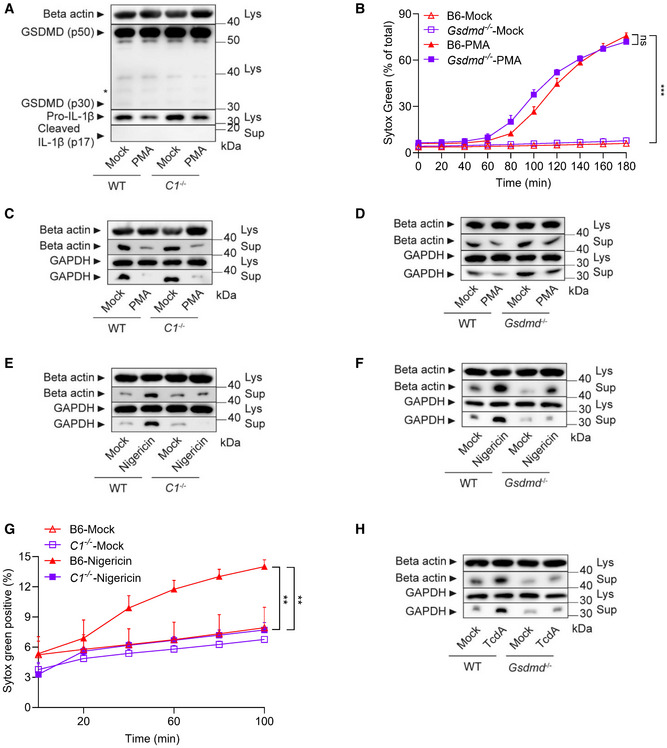
LPS‐primed neutrophils of the indicated genotypes were left untreated (Mock), stimulated with PMA (3 h) (A–D), nigericin (100 min) (E–G) or TcDA (3 h) (H). Whole‐cell lysates (Lys) and culture media (Sup) were immunoblotted for cleavage of pro‐IL‐1β (~39 kDa) into mature IL‐1β (p17) and cleaved GSDMD (p30) (A), and extracellular release of β‐actin and GAPDH (C–F, H). * With Western blots indicates non‐specific bands. (B, G) PMP was assessed by measurement of SYTOX Green incorporation over time. Values represent mean ± SEM of n = 3 biological repeats. Statistical significance was analysed by two‐way ANOVA: ***P ≤ 0.001; **P ≤ 0.01; ns = non‐significant. P‐values were corrected for multiple comparisons (Bonferroni).
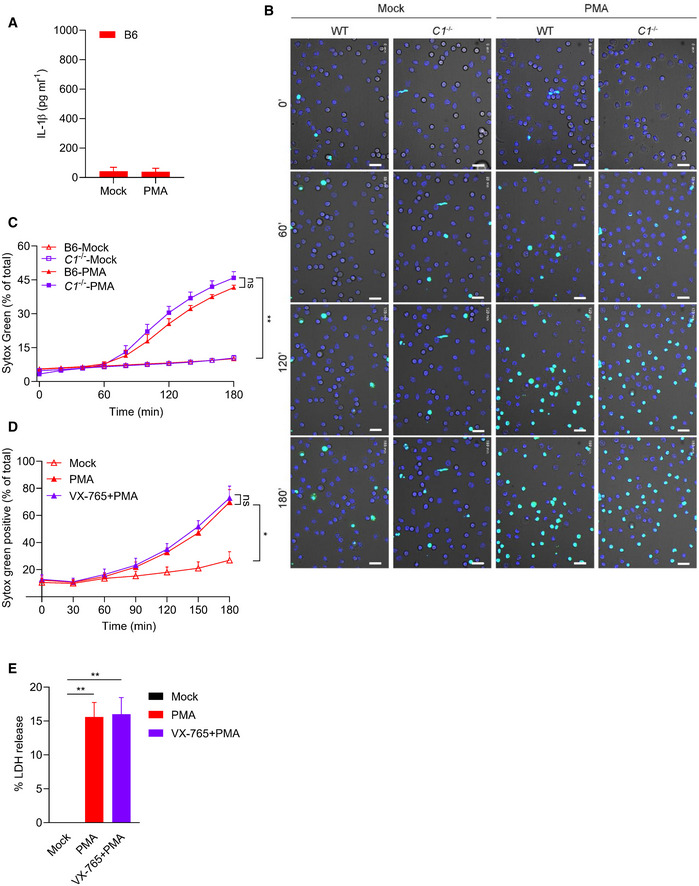
- A–C
LPS‐primed neutrophils of the indicated genotypes were left untreated (Mock) or stimulated with PMA (3 h) before IL‐1β was measured in culture media (A). (B) Representative confocal micrographs of Mock‐ and PMA‐stimulated neutrophils of the indicated genotypes stained with DAPI (dark‐blue nuclei) and SYTOX Green (light blue) taken at the indicated time points (scale bar: 20 μM). (C) PMP was assessed by measurement of SYTOX Green incorporation over time.
- D, E
LPS‐primed human blood neutrophils were left untreated (Mock) or stimulated with PMA in the presence or absence of VX‐765. PMP was determined by SYTOX green uptake over time (D) and cell death was measured by LDH release in culture media 3 h post‐stimulation (E).
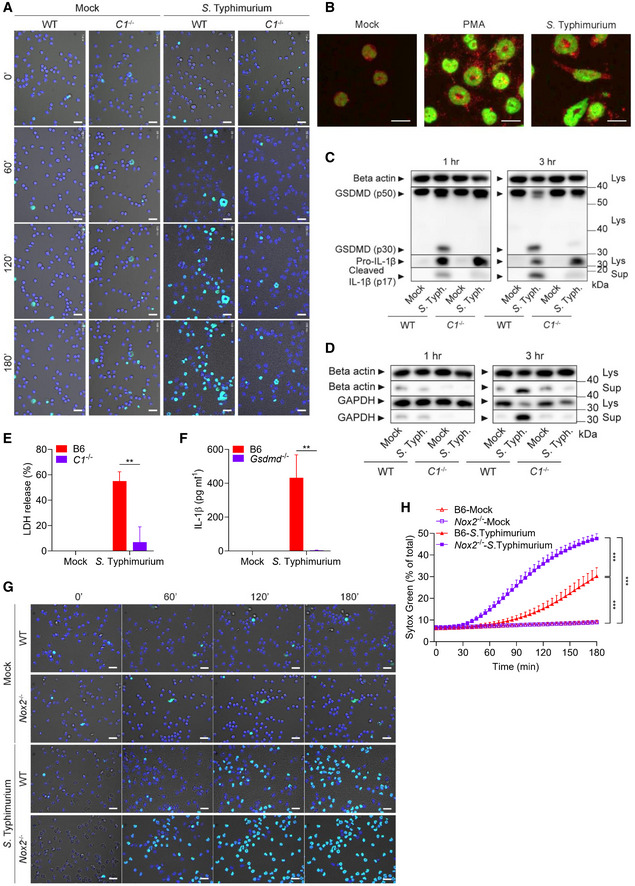
- A–H
Neutrophils of the indicated genotypes were left untreated (Mock) or infected with S. Typhimurium at MOI 25. (A) Representative confocal micrographs taken at different time points were stained with DAPI (dark blue nuclei) and SYTOX Green (light blue). Scale bar: 20 μM. (B) Representative confocal micrographs of untreated (Mock), S. Typhimurium‐infected or PMA‐stimulated wildtype BMNs stained for neutrophil elastase (Red) and SYTOX Green (Green) (Scale bar: 10 μM). (C, D) Cell lysates (Lys) and culture media (Sup) were immunoblotted for the indicated proteins at 1 and 3 h post‐infection. (E) Cell death was measured by LDH assay 3 h post‐infection. (F) IL‐1β secretion levels were determined by Luminex assay 1 h post‐infection. (G) Representative confocal micrographs of neutrophils stained with DAPI (dark‐blue nuclei) and SYTOX Green (light blue) taken at different time points post‐infection (scale bar: 20 μM). (H) PMP was assessed by measurement of SYTOX Green incorporation over time.
Similar articles
-
Gasdermin D is an executor of pyroptosis and required for interleukin-1β secretion.Cell Res. 2015 Dec;25(12):1285-98. doi: 10.1038/cr.2015.139. Epub 2015 Nov 27. Cell Res. 2015. PMID: 26611636 Free PMC article.
-
N-GSDMD trafficking to neutrophil organelles facilitates IL-1β release independently of plasma membrane pores and pyroptosis.Nat Commun. 2020 May 5;11(1):2212. doi: 10.1038/s41467-020-16043-9. Nat Commun. 2020. PMID: 32371889 Free PMC article.
-
Nlrp3 inflammasome activation and Gasdermin D-driven pyroptosis are immunopathogenic upon gastrointestinal norovirus infection.PLoS Pathog. 2019 Apr 24;15(4):e1007709. doi: 10.1371/journal.ppat.1007709. eCollection 2019 Apr. PLoS Pathog. 2019. PMID: 31017981 Free PMC article.
-
Pyroptosis in neutrophils: Multimodal integration of inflammasome and regulated cell death signaling pathways.Immunol Rev. 2023 Mar;314(1):229-249. doi: 10.1111/imr.13186. Epub 2023 Jan 19. Immunol Rev. 2023. PMID: 36656082 Free PMC article. Review.
-
Uncoupled pyroptosis and IL-1β secretion downstream of inflammasome signaling.Front Immunol. 2023 Apr 6;14:1128358. doi: 10.3389/fimmu.2023.1128358. eCollection 2023. Front Immunol. 2023. PMID: 37090724 Free PMC article. Review.
Cited by
-
Regulated cell death in neutrophils: From apoptosis to NETosis and pyroptosis.Semin Immunol. 2023 Nov;70:101849. doi: 10.1016/j.smim.2023.101849. Epub 2023 Nov 6. Semin Immunol. 2023. PMID: 37939552 Free PMC article. Review.
-
Communications between Neutrophil-Endothelial Interaction in Immune Defense against Bacterial Infection.Biology (Basel). 2024 May 24;13(6):374. doi: 10.3390/biology13060374. Biology (Basel). 2024. PMID: 38927254 Free PMC article. Review.
-
NLRP3 selectively drives IL-1β secretion by Pseudomonas aeruginosa infected neutrophils and regulates corneal disease severity.Nat Commun. 2023 Sep 20;14(1):5832. doi: 10.1038/s41467-023-41391-7. Nat Commun. 2023. PMID: 37730693 Free PMC article.
-
Pyroptosis and gasdermins-Emerging insights and therapeutic opportunities in metabolic dysfunction-associated steatohepatitis.Front Cell Dev Biol. 2023 Aug 17;11:1218807. doi: 10.3389/fcell.2023.1218807. eCollection 2023. Front Cell Dev Biol. 2023. PMID: 37664463 Free PMC article. Review.
-
Pyroptosis in cardiovascular diseases: Pumping gasdermin on the fire.Semin Immunol. 2023 Sep;69:101809. doi: 10.1016/j.smim.2023.101809. Epub 2023 Jul 19. Semin Immunol. 2023. PMID: 37478801 Free PMC article. Review.
References
-
- Boyden ED, Dietrich WF (2006) Nalp1b controls mouse macrophage susceptibility to anthrax lethal toxin. Nat Genet 38: 240–244 - PubMed
Publication types
MeSH terms
Substances
LinkOut - more resources
Full Text Sources
Miscellaneous
