. 2022 Jul;607(7918):339-344.
doi: 10.1038/s41586-022-04902-y. Epub 2022 Jun 29.

Increasing the resilience of plant immunity to a warming climate

Affiliations

Increasing the resilience of plant immunity to a warming climate

Jong Hum Kim et al. Nature. 2022 Jul.

Abstract

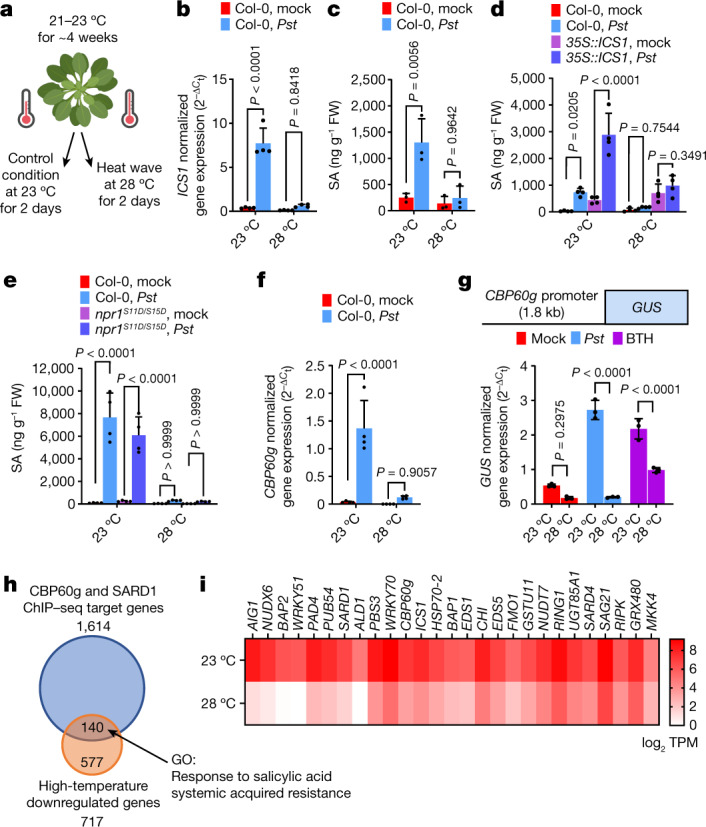
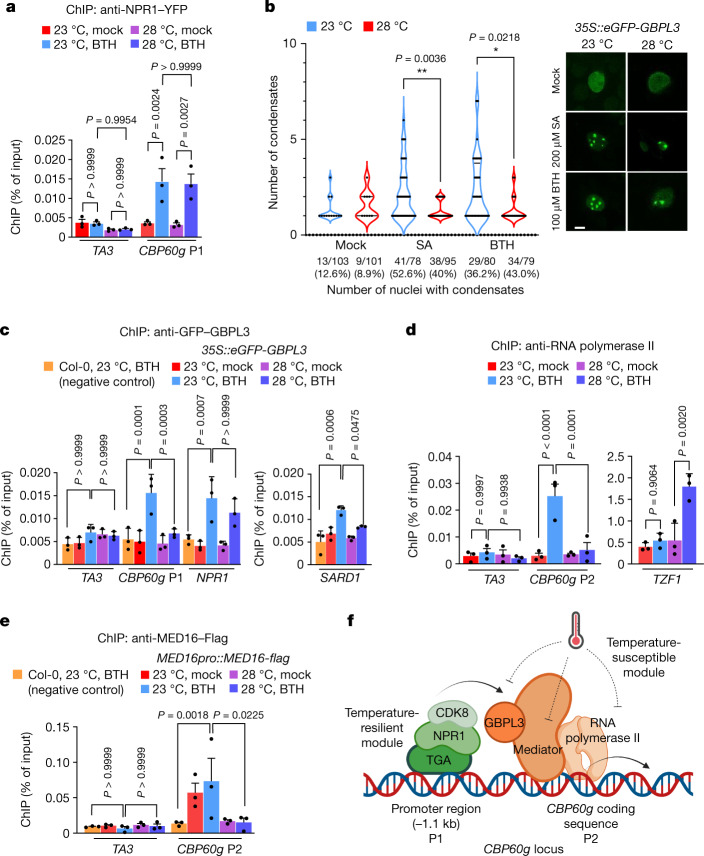
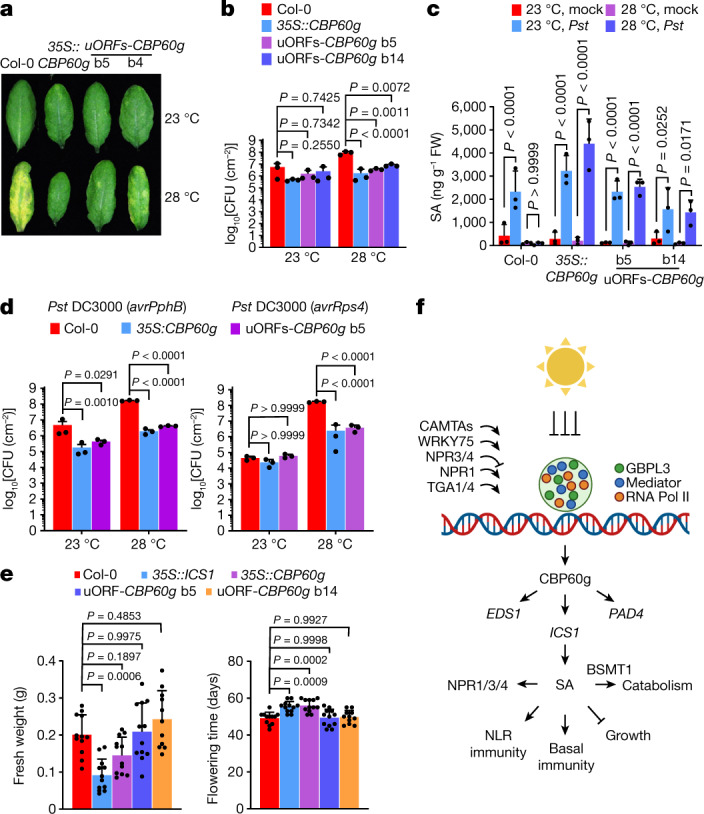
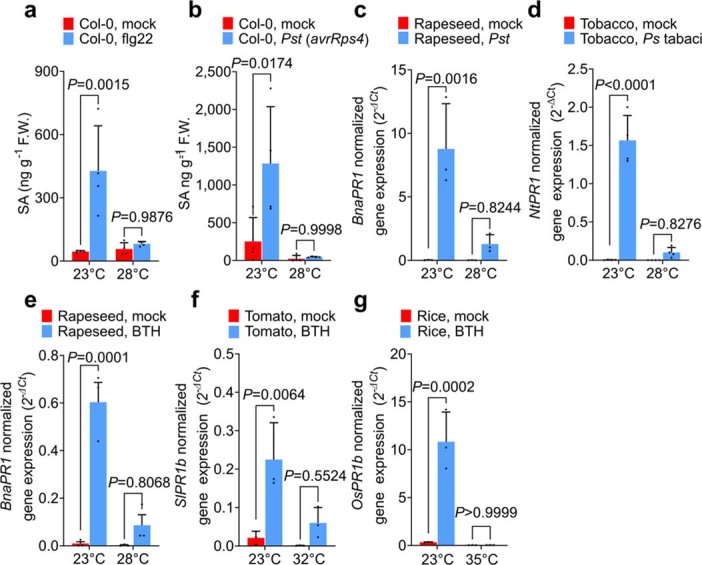
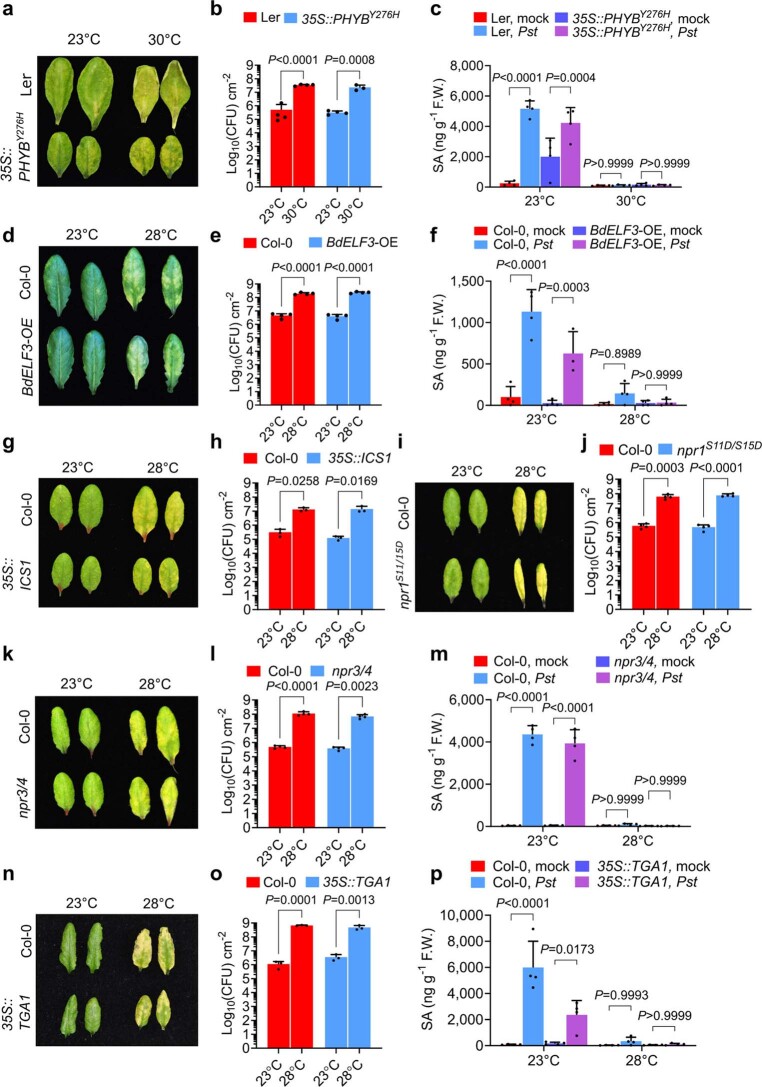
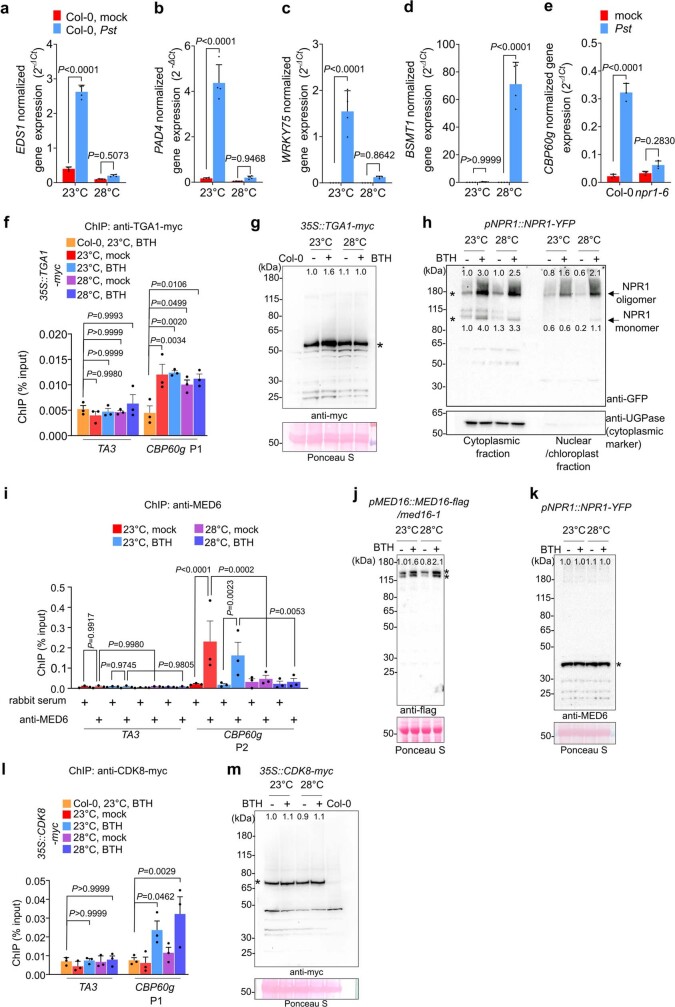
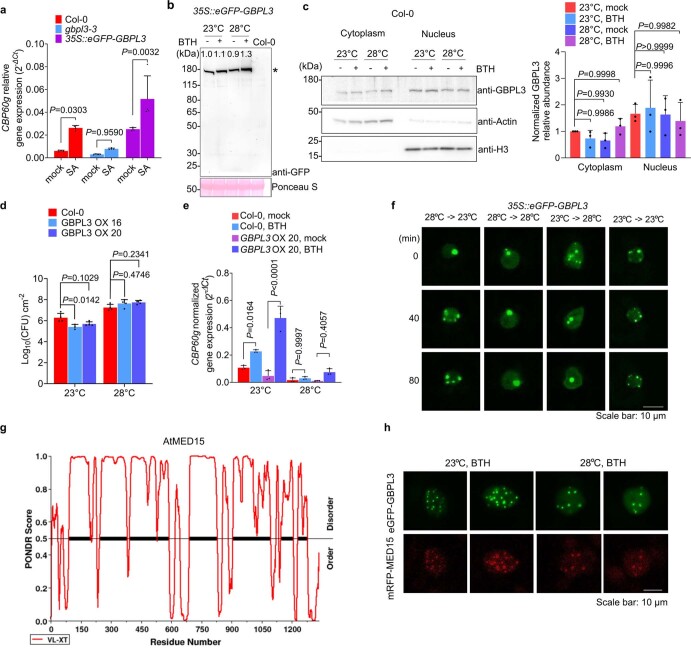
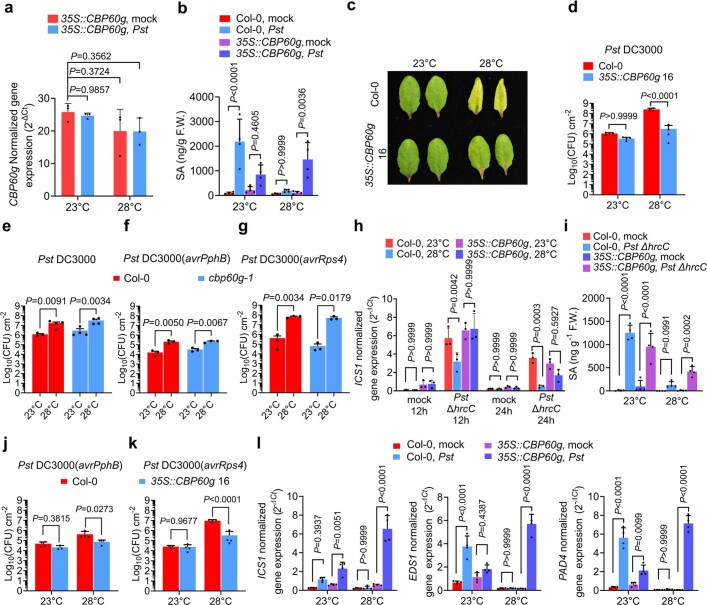
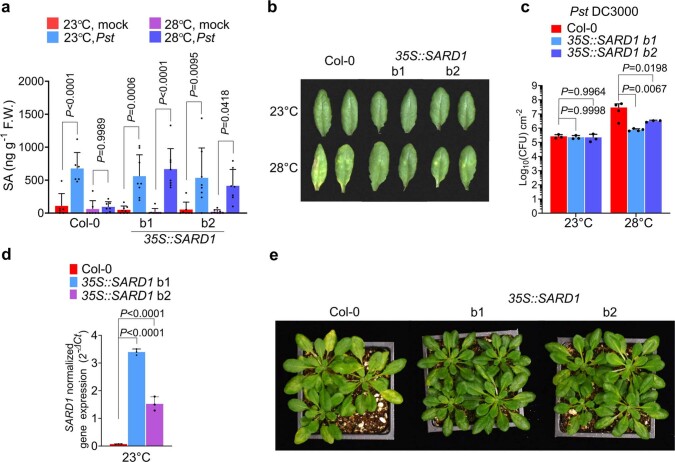
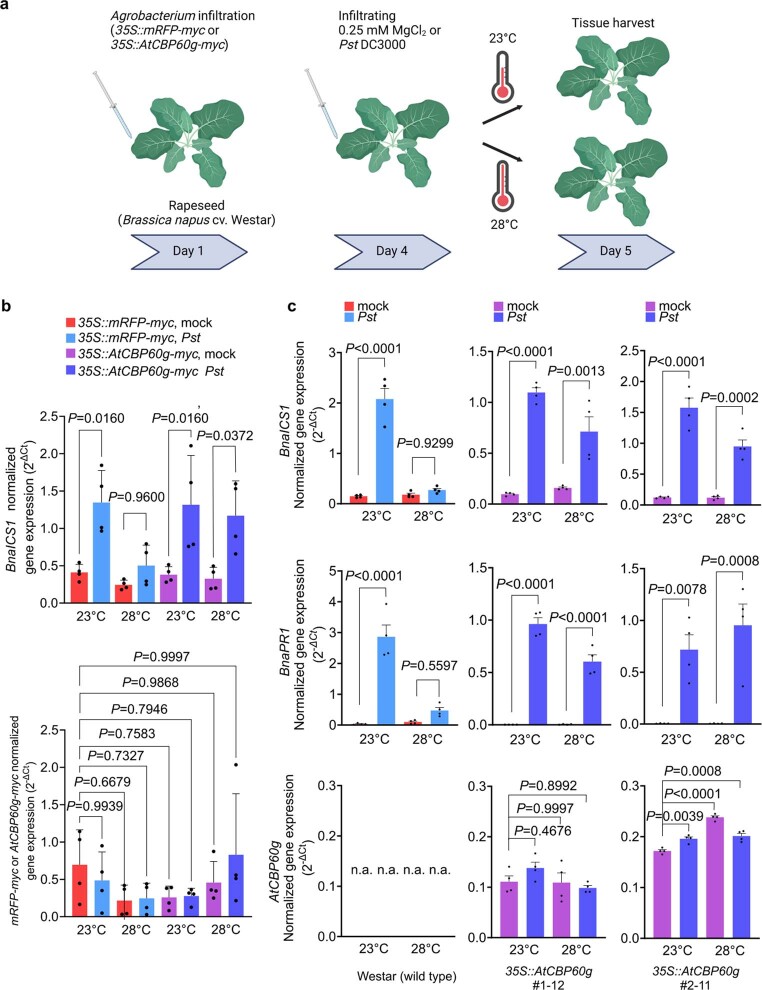
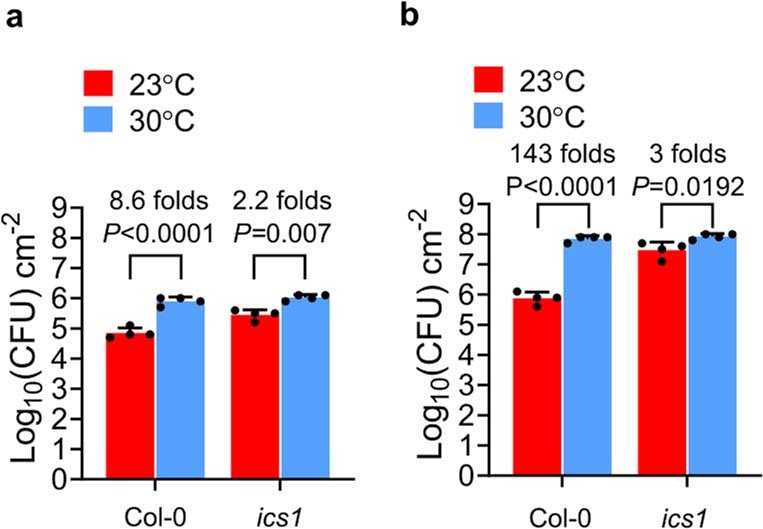
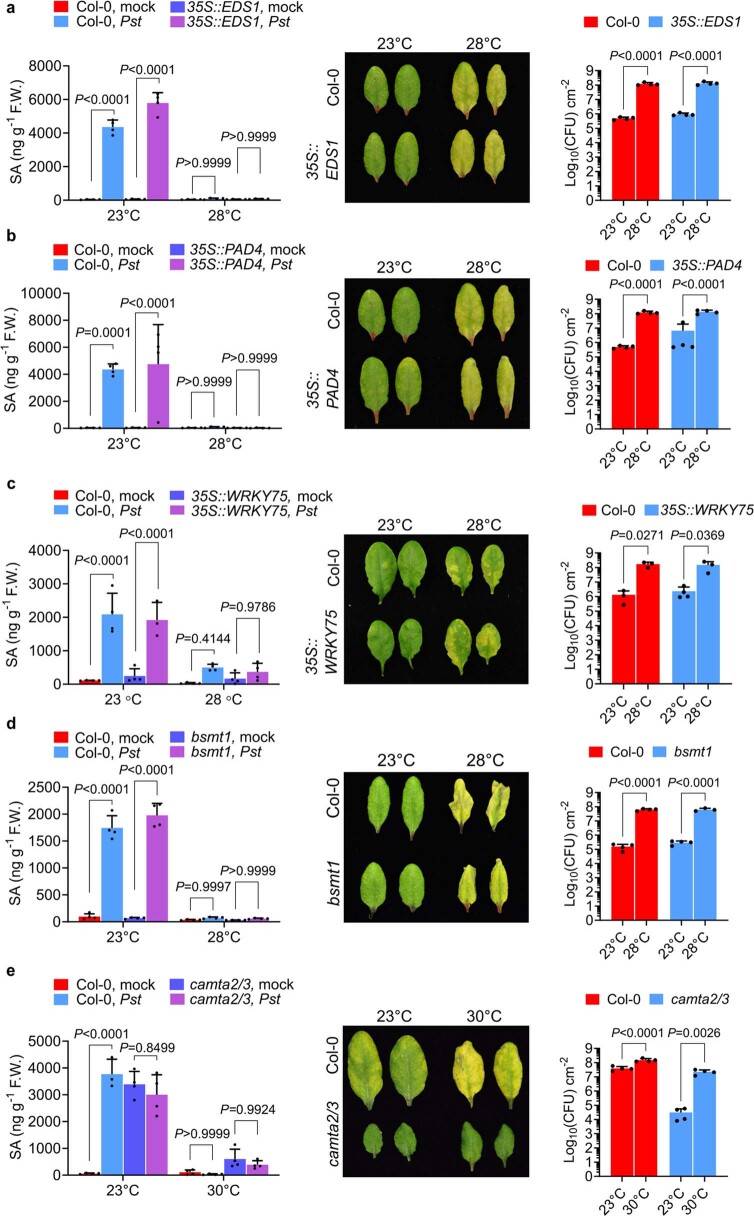
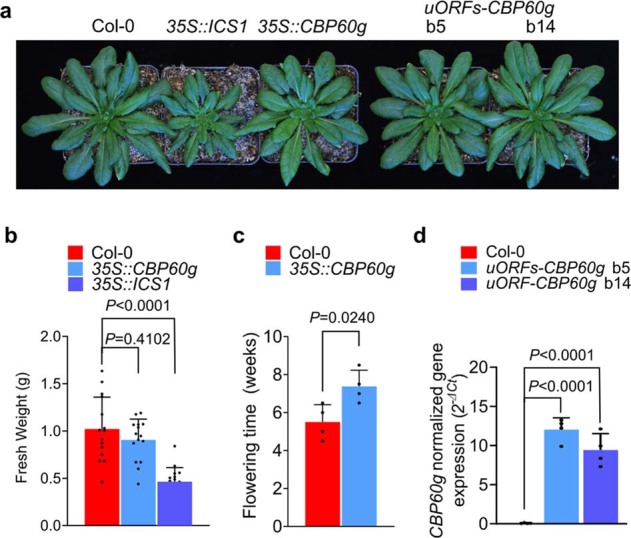
Extreme weather conditions associated with climate change affect many aspects of plant and animal life, including the response to infectious diseases. Production of salicylic acid (SA), a central plant defence hormone1-3, is particularly vulnerable to suppression by short periods of hot weather above the normal plant growth temperature range via an unknown mechanism4-7. Here we show that suppression of SA production in Arabidopsis thaliana at 28 °C is independent of PHYTOCHROME B8,9 (phyB) and EARLY FLOWERING 310 (ELF3), which regulate thermo-responsive plant growth and development. Instead, we found that formation of GUANYLATE BINDING PROTEIN-LIKE 3 (GBPL3) defence-activated biomolecular condensates11 (GDACs) was reduced at the higher growth temperature. The altered GDAC formation in vivo is linked to impaired recruitment of GBPL3 and SA-associated Mediator subunits to the promoters of CBP60g and SARD1, which encode master immune transcription factors. Unlike many other SA signalling components, including the SA receptor and biosynthetic genes, optimized CBP60g expression was sufficient to broadly restore SA production, basal immunity and effector-triggered immunity at the elevated growth temperature without significant growth trade-offs. CBP60g family transcription factors are widely conserved in plants12. These results have implications for safeguarding the plant immune system as well as understanding the concept of the plant-pathogen-environment disease triangle and the emergence of new disease epidemics in a warming climate.


Conflict of interest statement

The authors declare no competing interests.

Figures

Fig. 1
Fig. 1. Temperature vulnerability of CBP60g gene expression and the SA transcriptome.
Leaves of 4- to 5-week-old Arabidopsis plants were syringe-infiltrated with mock (0.25 mM MgCl2), Pst DC3000 (106 colony forming units (CFU) per ml−1 suspension) or BTH solution and then incubated at 23 °C or 28 °C. Hormone analysis, RNA sequencing (RNA-seq), and quantitative PCR with reverse transcription (RT–qPCR) were performed 24 h after treatment (that is, 1 day post-inoculation (dpi)). a, A schematic diagram of the experimental protocol. b,c, ICS1 transcript (b) and SA (c) levels in mock- and Pst DC3000-infiltrated Col-0 plants at 1 dpi. FW, fresh weight. d,e, SA levels in mock- and Pst DC3000-inoculated Col-0 (d,e) and 35S::ICS1 (d) or npr1S11D/S15D (e) plants at 1 dpi. f, Endogenous CBP60g transcript level of samples in b at 1 dpi. g, Top, schematic of the GUS reporter gene. Bottom, GUS reporter gene expression in mock-, Pst DC3000- and BTH-treated pCBP60g::GUS plants one day after treatment. h, Gene Ontology (GO) analysis of Pst DC3000-induced genes that are differentially regulated at elevated temperature and their overlap with the SARD1 and CBP60g ChIP–sequencing dataset. i, Representative RNA-seq reads after Pst DC3000 infection of defence-related CBP60g target genes for plants in h. TPM, transcripts per million mapped reads. Data in bg,i are mean ± s.d. (n = 3 (c,g,i) or 4 (b,df) biological replicates) from one representative experiment analysed with two-way ANOVA with Tukey’s honest significant difference (HSD) for significance. Experiments were independently performed three times, except for i, with two experiments. Exact P-values for all comparisons are shown in the Source Data. Source data
Fig. 2
Fig. 2. Elevated temperature represses CBP60g promoter activity.
Four- to five-week-old Col-0 and indicated transgenic plants were treated with mock (0.1% DMSO) or 100 µM BTH solution and then incubated at 23 °C and 28 °C. ChIP–qPCR and confocal imaging were performed in plants one day after treatment. a, ChIP–qPCR analyses of NPR1pro::NPR1-YFP using anti-GFP antibody and indicated primer sets. The position of the CBP60g primer sequence is shown in f. b, Confocal imaging of eGFP–GBPL3 in 35S::eGFP-GBPL3 infiltrated with mock (0.1% DMSO), 200 µM SA or 100 µM BTH solution at 23 °C or 28 °C 1 day after treatment. Scale bar, 10 μm. ce, ChIP–qPCR analyses of 35S::eGFP-GBPL3 (c), NPR1pro::NPR1-YFP (d) and MED16pro::MED16-flag (e) plants using the indicated antibodies and primer sets. f, Schematic showing known regulators binding at the CBP60g locus. Temperature-susceptible (green) and temperature-resilient (orange) modules are indicated. Primer positions (P1 for promoter region and P2 for coding region) are indicated. For ChIP analyses, the TA3 transposon was used as the negative control target locus in (a,ce). A BTH-treated Col-0 sample incubated at 23 °C (c,e) was used as a negative control for immunoprecipitation. Results in (a,ce) are mean ± s.d. of three independent experiments; two-way ANOVA with Tukey’s HSD. Images in b show one representative experiment (of four independent experiments); one-way ANOVA with Bartlett’s test. Exact P-values greater than 0.05 are shown in the Source Data. Source data
Fig. 3
Fig. 3. Restoration of SA accumulation and immunity at elevated temperature in 35S::CBP60g plants.
Wild-type Col-0 and 35S::CBP60g plants were syringe-infiltrated with mock (0.25 mM MgCl2) or Pst DC3000 (106 CFU ml−1) and incubated at 23 °C or 28 °C. a, SA levels in mock- and Pst DC3000-inoculated plants at 24 h (1 dpi). b, Images of leaves from Pst DC3000-inoculated plants at 3 dpi. c, In planta Pst DC3000 bacterial levels at 3 dpi. d,e, In planta Pst DC3000 (avrPphB) (d) or Pst DC3000 (avrRps4) (e) bacterial levels at 3 dpi. f, Heat map of RNA-seq reads for genes that are downregulated in Col-0 grown at 28 °C but fully or partially restored in 35S::CBP60g grown under the same conditions. RPKM, reads per kilobase of transcript per million mapped reads. Data in a,c,e are mean ± s.d. (n = 4 biological replicates) of one representative experiment (out of three independent experiments) analysed by two-way ANOVA with Tukey’s HSD. Results in d are mean ± s.d. (n = 4 biological replicates except 35S::CBP60g at 23 °C (n = 3 biological replicates)) of one representative experiment (out of three independent experiments) analysed by two-way ANOVA with Tukey’s HSD. Exact P-values for all comparisons are shown in the Source Data. Source data
Fig. 4
Fig. 4. Optimized CBP60g expression leads to temperature-resilient SA defences without growth or developmental trade-offs.
Col-0, 35S::CBP60g and 35S::uORFsTBF1-CBP60g plants were syringe-infiltrated with mock (0.25 mM MgCl2) or Pst DC3000 solution (106 CFU ml−1) and then incubated at 23 °C and 28 °C. a, Foliar disease symptoms were evaluated at 3 dpi. b, In planta Pst DC3000 bacterial levels in samples in a at 3 dpi. c, SA levels in samples in a at 1 dpi. d, In planta Pst DC3000 (avrPphB) and Pst DC3000 (avrRps4) bacterial levels at 3 dpi. e, Fresh weight (left) at day 28 and flowering time (right) for the indicated plant genotypes. f, A working model of how elevated temperature targets the SA defence and immune network through CBP60g expression. At normal growth temperature, infection induces CBP60g gene expression. CBP60g regulates various defence genes, including those involved in SA accumulation (such as ICS1, EDS1 and PAD4). At elevated temperature, recruitment of Mediator, GBPL3 and RNA Pol II to the CBP60g locus is impaired, leading to lower SA production and reduced immunity at elevated temperature. Data in bd are mean ± s.d. (n =  3 biological replicates) from one representative experiment (out of three independent experiments) analysed by two-way ANOVA with Tukey’s HSD. Data in e are mean ± s.d. (n = 12 biological replicates) from one representative experiment (out of three independent experiments), analysed by one-way ANOVA with Bartlett’s test. Exact P-values greater than 0.05 are shown in the Source Data. Source data
Extended Data Fig. 1
Extended Data Fig. 1. The SA pathway is downregulated at elevated temperatures in different plant species examined.
a–b, SA levels in 4-week-old Col-0 plants at 24 h after treatment [i.e., 1 day post-inoculation (dpi)] with flg22 peptide treatment (a) or Pst DC3000(avrRps4) inoculation [1.0 x 10⁸ Colony Forming Units (CFU) mL−1] (b) at 23 °C and 28 °C. c–d, Transcript levels of BnaPR1 in leaves of 4-week-old rapeseed Westar plants infiltrated with mock (0.25 mM MgCl2) or Pst DC3000 [1.0 x 10⁵ Colony Forming Units (CFU) mL−1] (c) and NtPR1 in leaves of 4-week-old tobacco plants infiltrated with mock (0.25 mM MgCl2) or Ps tabaci 11528 [1.0 x 10⁶ Colony Forming Units (CFU) mL−1] (d) at 24 h post-inoculation (1 dpi) at 23 °C and 28 °C. e, BnaPR1 expression levels in leaves of 4-week-old rapeseed Westar plants 1 day after mock (0.1% DMSO) or 50 µM BTH treatment at 23 °C and 28 °C f, SA marker gene (SlPR1b) expression levels in 4-week-old Castlemart tomato plants 1 day after mock (0.1% DMSO) or 100 µM BTH treatment at 23 °C and 32 °C. g, SA marker gene (OsPR1b) expression levels in 5-week-old rice plants 1 day after mock (0.1% DMSO) or 200 µM BTH treatment at 28 °C and 35 °C. Results show the means ± S.D. [n = 3 (c, eg) or 4 (a, b, d) biological replicates] from one representative experiment (of three independent experiments) analyzed with two-way ANOVA with Tukey’s HSD for significance. Exact P-values for all comparisons are detailed in the Source Data files Source data
Extended Data Fig. 2
Extended Data Fig. 2. Basal resistance to Pst DC3000 at control (23 °C) and elevated temperature (28–30 °C) in constitutively activated phyB and ELF3 thermosensor lines and in genetically activated SA biosynthetic and signalling mutants.
a–f, Symptom expression at 3 day post-inoculation (dpi) (a, d), in planta Pst DC3000 bacterial levels at 3 dpi (b, e) and SA levels of mock (0.25 mM MgCl2)- and Pst DC3000-inoculated leaves [1.0 x 10⁶ Colony Forming Units (CFU) mL−1] at 1 dpi (c, f) of Ler (ac), Col-0 (df), 35S::PHYBY276H (ac), and BdELF3-OE (df). g–j, Symptom expression at 3 dpi (g, i) and in planta Pst DC3000 bacterial levels at 3 dpi (h, j) of Col-0 (gj), 35S::ICS1 (g, h), and npr1S11D/S15D (i, j). k–p, Symptom expression at 3 dpi (k,n), in planta Pst DC3000 bacterial levels at 3 dpi (l, o) and SA levels of mock- and Pst DC3000-inoculated leaves at 1 dpi (m, p) of Col-0 (kp), npr3/4 (km), and 35S::TGA1 (np). Results show the means ± S.D. [n = 4 (c, e, j, l, m, p) or n = 3 (h, o) biological replicates] from one representative experiment (of three independent experiments) analyzed with two-way ANOVA with Tukey’s HSD for significance. Results show the means ± S.D. [(b) n = 4 biological replicates except 35S::PHYBY276H at 30 °C (n = 3 biological replicates), (f) n = 4 biological replicates except BdELF3-OE, Pst at 23 °C (n = 3 biological replicates)] from one representative experiment (of three independent experiments) analyzed with two-way ANOVA with Tukey’s HSD for significance. Exact P-values for all comparisons are detailed in the Source Data files Source data
Extended Data Fig. 3
Extended Data Fig. 3. Effect of elevated temperature on transcript levels, protein levels and promoter recruitment of SA pathway regulators.
a–d, Endogenous EDS1 (a), PAD4 (b), WRKY75 (c), and BSMT1 (d) transcript levels of samples in Fig. 1b at 24 h after treatment (1 dpi). e, CBP60g gene expression levels in Col-0 and npr16 plants at 24 h after Pst DC3000 inoculation [1.0 x 10⁶ Colony Forming Units (CFU) mL−1] at 23 °C. f, ChIP-qPCR analysis of 35S::TGA1-4myc using anti-myc antibody and primer sets indicated in Fig.2f. Binding of TGA1-myc to CBP60g locus is not affected by temperature in mock (0.1% DMSO)- or BTH-treated samples (P-value = 0.7903 and 0.9566, respectively). g, Immunoblot results of 35S::TGA1-myc used for ChIP-qPCR analyses in (f). h, NPR1 immunoblot of NPR1pro::NPR1-YFP plant cytosolic and nuclear protein fractions 24 h after BTH treatment at 23 °C and 28 °C. Both NPR1 oligomers (high molecular weight) and monomers (low molecular weight) are indicated by arrowheads. Anti-UGPase immunoblot is shown as the cytoplasmic marker control. i, ChIP-qPCR results of NPR1pro::NPR1-YFP using anti-MED6 antibody and primer sets indicated in Fig.2f. j, Immunoblot result of MED16pro::MED16-3flag used for ChIP-qPCR analysis in Fig. 2e. k, Immunoblot results of NPR1pro::NPR1-YFP using anti-MED6 antibody used for ChIP-qPCR analyses in (i). l, ChIP-qPCR results of 35S::CDK8-myc using anti-myc antibody and primer sets indicated. m, Immunoblot results of 35S::CDK8-myc using anti-myc antibody used for ChIP-qPCR analyses in (l). For immunoblot (g, j, k, m), stained RuBisCO large subunits are shown as loading controls. Numbers in panels (g, h, j, k, m) indicate relative protein band signal intensities compared to the corresponding band denoted with a * symbol(s). For gel/blot source data, see Supplementary Fig. 1. For ChIP analyses, the TA3 transposon was used as the negative control target locus. Primer positions (P1 for promoter region and P2 for coding region) are indicated in Fig. 2f. Antibody information is included in Supplementary Table 5. Result in (ae) shows the means ± S.D. [n = 4 (ad) or 3 (e) biological replicates] from one representative experiment [of three (ad) or two (e) independent experiments] analyzed with two-way ANOVA with Tukey’s HSD for significance. Results in (g, h, j, k, m) show one representative experiment [of two (g, h) or three (j, k, m) independent experiments]. Results in (f, i, l) are the average ± S.D. [of three independent experiments (n = 3 experiments)], analyzed with two-way ANOVA with Tukey’s HSD for significance. Exact P-values for those comparisons that are greater than 0.05 are detailed in the Source Data files Source data
Extended Data Fig. 4
Extended Data Fig. 4. Characterization of 35S::eGFP-GBPL3 and GBPL3 OX plants.
a, CBP60g gene expression levels in Col-0, gbpl3-3, and 35S::eGFP-GBPL3 plants at 24 h (1 day) after mock (water) or 200 µM salicylic acid spray at 23 °C. b, Immunoblot results of 35S::eGFP-GBPL3 used for ChIP-qPCR analyses in Fig. 2c. Stained RuBisCO large subunits are shown as loading controls. Numbers in the panel indicate relative protein band signal intensities compared to the corresponding band denoted with a * symbol. c, Subcellular fractionation of Arabidopsis Col-0 leaf cells treated with mock (0.1% DMSO) or BTH for 24h at control (23 °C) or elevated temperature (28 °C). Actin and Histone H3 protein were used as markers of cytoplasmic and nuclear fractions, respectively. d, In planta Pst DC3000 [1.0 x 10⁶ Colony Forming Units (CFU) mL−1] bacterial levels in Col-0, GBPL3 OX #16 and GBPL3 OX #20 plants at 3 dpi. e, CBP60g gene expression levels of Col-0 and GBPL3 OX #20 plants at 24 h after mock (0.1% DMSO) or 100 µM BTH spray at 23 °C or 28 °C. f, Time lapse confocal microscopy of Arabidopsis mesophyll cell expressing eGFP-GBPL3 after transfer to 28 °C from 23 °C or to 23 °C from 28 °C. Scale bar, 10 µm. g, Prediction of intrinsically disordered region in AtMED15 (Threshold score: 0.5). h, Confocal microscopy of Nicotiana tabacum mesophyll cells transiently expressing eGFP-GBPL3 and mRFP-MED15 at 23 °C and 28 °C. Six to seven weeks old N. tabacum leaves were infiltrated with Agrobacterium harbouring 35S::eGFP-GBPL3 or 35S::mRFP-MED15-flag. After incubation for 3 days at control temperature, the plants were treated with 100 µM BTH solution and shifted to 23 °C or 28 °C. After 1 day, mesophyll cells were visualized by confocal microscopy. Scale bar, 10 µm. Results in (a, d, e) show the means ± S.D. [(a) n = 4, (d) n = 4 except GBPL3 OX 16 at 23 °C (n = 3 biological replicates), or (e) n = 3 biological replicates] from one representative experiment (of two independent experiments), analyzed with two-way ANOVA with Tukey’s HSD for significance. Results in (b, left panel of c) show one representative experiment (of three independent experiments). Result in (right panel of c) shows the means ± S.D. (of three independent experiments) analyzed with one-way ANOVA with Bartlett’s test for significance. Results in (f, h) show one representative experiment (of two independent experiments). Exact P-values for all comparisons are detailed in the Source Data files Source data
Extended Data Fig. 5
Extended Data Fig. 5. Characterization of 35S::CBP60g 16 and cbp60g-1 plants.
a, CBP60g transcript levels in 4-week old 35S::CBP60g at 23 °C or 28 °C 1 day after mock (0.25 mM MgCl2) treatment or Pst DC3000 infection [1.0 x 10⁶ Colony Forming Units (CFU) mL−1]. b–d, SA levels at 1 dpi (b), symptom expression at 3 dpi (c) and in planta Pst DC3000 [1.0 x 10⁶ Colony Forming Units (CFU) mL−1] bacterial levels at 3 dpi (d) of Col-0 and 35S::CBP60g 16 plants. e–g, bacterial levels in Col-0 and cbp60g-1 plants inoculated with Pst DC3000 (e), Pst DC3000 (avrPphB) (f), and Pst DC3000 (avrRps4) (g) at 3 dpi. h, ICS1 gene expression levels in Pst DC3000 ΔhrcC-infected Col-0 and 35S:CBP60g plants [1.0 x 10⁸ Colony Forming Units (CFU) mL−1] at 12- and 24-h post-inoculation (hpi). i, SA levels in Pst DC3000 ΔhrcC-infected Col-0 and 35S:CBP60g plants (1.0 x 10⁸ Colony Forming Units (CFU) mL−1) at 24 h post-inoculation. j–k, In planta Pst DC3000 (avrPphB) (j), and (avrRps4) (k) bacterial levels of Col-0 and 35S::CBP60g 16 plants at 3 dpi. l, ICS1, EDS1 and PAD4 gene expression levels of Col-0 and 35S::CBP60g plants 1 day after mock (0.25 mM MgCl2)- and Pst DC3000-infiltration [1.0 x 10⁶ Colony Forming Units (CFU) mL−1]. Results show the means ± S.D. [n = 3 (a, f, g, h) or 4 (b, d, i) biological replicates] from one representative experiment [of two (a, h, i) or three (b, d, f, g) independent experiments] analyzed with two-way ANOVA with Tukey’s HSD for significance. Results in (e) show the means ± S.D. [n = 4 biological replicates except Col-0 at 23 °C (n = 3 biological replicates)] from one representative experiments (of three independent experiments) analyzed with two-way ANOVA with Tukey’s HSD for significance. Results in (j) show the means ± S.D. [n = 4 (Col-0) or 3 (35S::CBP60g 16) biological replicates] from one representative experiments (of three independent experiments) analyzed with two-way ANOVA with Tukey’s HSD for significance. Results in (k) show the means ± S.D. [n = 4 biological replicates except 35S::CBP60g 16 at 23 °C (n = 3 biological replicates)] from one representative experiments (of three independent experiments) analyzed with two-way ANOVA with Tukey’s HSD for significance. Exact P-values for those comparisons that are greater than 0.05 are detailed in the Source Data files Source data
Extended Data Fig. 6
Extended Data Fig. 6. Characterization of 35S::SARD1 plants.
a–c, SA levels at 24 h (a), symptom expression at day 3 (b), in planta bacterial levels at day 3 (c) post-inoculation with mock (0.25 mM MgCl2) or Pst DC3000 solution [1.0 x 10⁶ Colony Forming Units (CFU) mL−1]. d, SARD1 gene expression levels in 4-week-old plants of Col-0 and 35S::SARD1. e, Appearance of 4.5-week-old Col-0 and 35S::SARD1 plants (lines b1 and b2) grown at 23 °C were infiltrated with 1 x 10⁶ CFU mL−1 Pst DC3000 and further incubated at 28 °C for 3 days. Results in (a) show the means ± S.D. [n = 6 (Col-0, 23 °C mock and Col-0, 23 °C Pst), 7 (Col-0, 28 °C mock and Col-0, 28 °C Pst), 8 (all 35S::SARD1 b1 line data), 7 (35S::SARD1 b2 line, 23 °C mock), 8 (35S::SARD1 b2 line, 23 °C Pst), 8 (35S::SARD1 b2 line, 28 °C mock), or 7 (35S::SARD1 b2 line, 28 °C Pst) biological replicates from two independent experiments] analyzed with two-way ANOVA with Tukey’s HSD for significance. Results in (c) show the means ± S.D. [n = 3 (Col-0 at 23 °C), 4 (Col-0 at 28 °C), 3 (35S::SARD1 b1 at 23 °C), 4 (35S::SARD1 b1 at 28 °C), or 3 (35S::SARD1 b2 at 23 °C and 28 °C) biological replicates] from one representative experiments (of four independent experiments) analyzed with two-way ANOVA with Tukey’s HSD for significance. Results in (d) show the means ± S.D. (n = 3 biological replicates) from one representative experiments (of two independent experiments) analyzed with one-way ANOVA with Bartlett’s test for significance. Result in (e) shows one representative experiment of four independent experiments. Exact P-values for those comparisons that are greater than 0.05 are detailed in the Source Data files Source data
Extended Data Fig. 7
Extended Data Fig. 7. BnaICS and BnaPR1 transcript levels in transgenic rapeseed plants expressing AtCBP60g-myc.
a, A schematic diagram of experimental flow using Agrobacterium-mediated transient expression system. b, Transcript levels of BnaICS1 and myc-tagged transgenes (mRFP-myc or AtCBP60g-myc) in mock (0.25 mM MgCl2)- or Pst DC3000-infiltrated [1.0 x 10⁵ Colony Forming Units (CFU) mL−1] rapeseed leaves at 1 dpi. Leaves were pre-infiltrated with Agrobacterium suspension 3 days before mock or Pst DC3000 treatment. Results in (b) are the means ± S.D. (n = 4 biological replicates from two independent experiments). Statistical analysis was performed using two-way ANOVA with Tukey’s HSD. The experiment was repeated four times with similar results. c, Transcript levels of BnaICS1, BnaPR1 and AtCBP60g-myc in mock- or Pst DC3000-infiltrated [1.0 x 10⁵ Colony Forming Units (CFU) mL−1] wild-type and two independent 35S::AtCBP60g-myc transgenic rapeseed leaves. AtCBP60g transcript level in each leaf sample was quantified (bottom row). No AtCBP60g transcript was detected in Westar samples as control, whereas AtCBP60g transcript was detected in each 35S::AtCBP60g-myc sample. Data in (c) are the means S.E.M. (n = 4 biological replicates). The experiment was repeated twice. Statistical analysis was performed using two-way ANOVA with Tukey’s HSD. n.a., not applicable. Exact P-values for those comparisons that are greater than 0.05 are detailed in the Source Data files Source data
Extended Data Fig. 8
Extended Data Fig. 8. Pst DC3000 bacterial population levels in Arabidopsis Col-0 and the ics1 mutant.
a–b, In planta Pst [1.0 x 10⁶ Colony Forming Units (CFU) mL−1] bacterial levels in Col-0 and ics1 (i.e., sid2-2) plants at 23 °C and 30 °C at 1 (a) and 3 (b) dpi. Data are the means ± S.D. (n = 4 biological replicates). The experiment was repeated three times. Statistical analysis was performed using two-way ANOVA with Tukey’s HSD. Exact P-values for all comparisons are detailed in the Source Data files Source data
Extended Data Fig. 9
Extended Data Fig. 9. SA accumulation and basal immunity to Pst DC3000 at elevated temperature in plants altered in positive and negative SA regulators.
a–e, SA levels at 1 dpi (left panels), symptom expression at 3 dpi (middle panels) and in planta Pst DC3000 bacterial levels at 3 dpi (right panels) of Col-0 (ae) and 35S::EDS1 (a), 35S::PAD4 (b), 35S::WRKY75 (c), bsmt1 (d) and camta2/3 plants (e) [1.0 x 10⁶ Colony Forming Units (CFU) mL−1]. Results show the means ± S.D. [n = 4 (a, b) biological replicates] from one representative experiment (of three independent experiments) analyzed with two-way ANOVA with Tukey’s HSD for significance. Results in (c) show the means ± S.D. [left panel: n = 4 biological replicates except 35S::WRKY75, Pst at 23 °C (n = 3 biological replicates); right panel: n = 3 biological replicates except 35S::WRKY75 at 23 °C (n = 4 biological replicates)] from one representative experiment (of three independent experiments) analyzed with two-way ANOVA with Tukey’s HSD for significance. Results in (d) show the means ± S.D. [left panel: n = 4 biological replicates; right panel: n = 4 biological replicates except bsmt1, Pst at 28 °C (n = 3 biological replicates)] from one representative experiment (of three independent experiments) analyzed with two-way ANOVA with Tukey’s HSD for significance. Results in (e) show the means ± S.D. [left panel: n = 4 biological replicates except Col-0, Pst at 23 °C (n = 3 biological replicates); right panel: n = 4 biological replicates] from one representative experiment (of three independent experiments) analyzed with two-way ANOVA with Tukey’s HSD for significance. Exact P-values for all comparisons are detailed in the Source Data files Source data
Extended Data Fig. 10
Extended Data Fig. 10. Characterization of 35S::ICS1, 35S::CBP60g and uORF-CBP60g plants.
a, Appearance of 6-week-old Col-0, 35S::ICS1, 35S::CBP60g and uORFs-CBP60g plants. b, Quantification of fresh weights of 6-week-old Col-0, 35S::ICS1, 35S::CBP60g. c, Flowering time phenotypes of Col-0 and 35S::CBP60g plants. d, CBP60g transcript levels in 4-week old Col-0, and 35S::uORFs-CBP60g plants measured by RT-qPCR. Results in (b) show the means ± S.D. [n = 15 (Col-0, 35S::CBP60g), n = 16 (35S::ICS1) biological replicates] from one representative experiment (of two independent experiments) analyzed with one-way ANOVA with Bartlett’s test for significance. Results in (c) show the means ± S.D. (n = 4 biological replicates) from one representative experiment (of two independent experiments) with two-tailed Student’s t-test. Results in (d) show the means ± S.D. (n = 4 biological replicates of two independent experiments) analyzed with one-way ANOVA with Bartlett’s test for significance. Exact P-values for all comparisons are detailed in the Source Data files Source data

Comment in

Similar articles

Cited by

References

    1. Glazebrook J. Contrasting mechanisms of defense against biotrophic and necrotrophic pathogens. Annu. Rev. Phytopathol. 2005;43:205–227. - PubMed
    1. Fu ZQ, Dong X. Systemic acquired resistance: turning local infection into global defense. Annu. Rev. Plant Biol. 2013;64:839–863. - PubMed
    1. Peng Y, Yang J, Li X, Zhang Y. Salicylic acid: biosynthesis and signaling. Annu. Rev. Plant Biol. 2021;72:761–791. - PubMed
    1. Castroverde CDM, Dina D. Temperature regulation of plant hormone signaling during stress and development. J. Exp. Bot. 2021;72:7436–7458. - PubMed
    1. Velásquez AC, Castroverde CDM, He SY. Plant–pathogen warfare under changing climate conditions. Curr. Biol. 2018;28:R619–R634. - PMC - PubMed

Publication types

MeSH terms