. 2022 Aug;40(8):1231-1240.
doi: 10.1038/s41587-022-01302-5. Epub 2022 May 19.

Deep Visual Proteomics defines single-cell identity and heterogeneity

Affiliations

Deep Visual Proteomics defines single-cell identity and heterogeneity

Andreas Mund et al. Nat Biotechnol. 2022 Aug.

Abstract

Despite the availabilty of imaging-based and mass-spectrometry-based methods for spatial proteomics, a key challenge remains connecting images with single-cell-resolution protein abundance measurements. Here, we introduce Deep Visual Proteomics (DVP), which combines artificial-intelligence-driven image analysis of cellular phenotypes with automated single-cell or single-nucleus laser microdissection and ultra-high-sensitivity mass spectrometry. DVP links protein abundance to complex cellular or subcellular phenotypes while preserving spatial context. By individually excising nuclei from cell culture, we classified distinct cell states with proteomic profiles defined by known and uncharacterized proteins. In an archived primary melanoma tissue, DVP identified spatially resolved proteome changes as normal melanocytes transition to fully invasive melanoma, revealing pathways that change in a spatial manner as cancer progresses, such as mRNA splicing dysregulation in metastatic vertical growth that coincides with reduced interferon signaling and antigen presentation. The ability of DVP to retain precise spatial proteomic information in the tissue context has implications for the molecular profiling of clinical samples.


Conflict of interest statement

P.H. is the founder and a shareholder of Single-Cell Technologies Ltd., a biodata analysis company that owns and develops the BIAS software. The remaining authors declare no competing interests.

Figures

Fig. 1
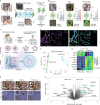
Fig. 1. DVP concept and workflow.
DVP combines high-resolution imaging, AI-guided image analysis for single-cell classification and isolation with an ultra-sensitive proteomics workflow. DVP links data-rich imaging of cell culture or archived patient biobank tissues with deep-learning-based cell segmentation and machine-learning-based identification of cell types and states. (Un)supervised AI-classified cellular or subcellular objects of interest undergo automated LMD and MS-based proteomic profiling. Subsequent bioinformatics data analysis enables data mining to discover protein signatures, providing molecular insights into proteome variation in health and disease states at the level of single cells. tSNE, t-distributed stochastic neighbor embedding.
Fig. 2
Fig. 2. BIAS for integrative image analysis and automated LMD single-cell isolation.
a, AI-driven nucleus and cytoplasm segmentation of normal-appearing and cancer cells and tissue using BIAS. b, We benchmarked the accuracy of its segmentation approach using the F1 metric and compared results to three additional methods—M1 is unet4nuclei, M2 is CellProfiler and M3 is Cellpose—while OUR refers to nucleAIzer. Bars show mean F1 scores with s.e.m.; n = 10 independent images for melanoma tissue and (U2OS) cells, and n = 20 for salivary gland tissue. Visual representation of the segmentation results: green areas correspond to true positive, blue to false positive and red to false negative. c, BIAS serves as the interface between the scanning and an LMD microscope, allowing high-accuracy transfers of cell contours between the microscopes. Illustration of cutting offset with respect to the object of interest and optimal path finding. d, Practical illustration of the functions in the upper panel. e, Immunofluorescence staining of the human fallopian tube epithelium with FOXJ1 and EpCAM antibodies, detecting ciliated and epithelial cells, respectively. Left panel: Ciliated (FOXJ1-positive) and secretory (FOXJ1-negative) cells. Right panel: Cell classification based on FOXJ1 intensity. Class 1 (FOXJ1-positive) and class 2 (FOXJ1-negative); magnification factor = ×387. f, PCA of FOXJ1-positive and FOXJ1-negative cell proteomes. g, Heat map of known protein markers for secretory and ciliated cells. Protein levels are z-scored. Asterisks represent imputed data. The marker list was derived from the Human Protein Atlas project and based on literature mining. h, Volcano plot of the pairwise proteomic comparison between FOXJ1-positive and FOXJ1-negative cells. Cell-type-specific marker proteins are highlighted in green and turquoise, and black represents potential novel marker proteins. Significant enriched cell-type-specific proteins are displayed above the black lines (two-sided t-test, FDR < 0.05, s0 = 0.1, n = 4 biological replicates).
Fig. 3
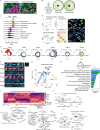
Fig. 3. DVP defines single-cell heterogeneity at the subcellular level.
a, Segmentation of whole cells and nuclei in BIAS of DNA (DAPI)-stained U2OS cells. Scale bar, 20 μm b, Automated LMD of whole cells and nuclei into 384-well plates. Images show wells after collection. c, Relative protein levels (x axis) of major cellular compartments between whole cell (n = 3 biological replicates) and nuclei (n = 3 biological replicates) specific proteomes. y axis displays point density. d, Left: conceptual workflows of the phenotype finder model of BIAS for ML-based classification of cellular phenotypes. Right: results of unsupervised ML-based classification of six distinct U2OS nuclei classes based on morphological features and DNA staining intensity. Colors represent classes. Scale bar, 20 μm. e, Phenotypic features used by ML to define six distinct nuclei classes. Radar plots show z-scored relative levels of morphological features (nuclear area, perimeter, solidity and form factor) and DNA staining intensity (total DAPI signal). f, Example images of nuclei from the six classes identified by ML. Blue color shows DNA staining intensity, and red color shows EdU staining intensity to identify cells undergoing replication. Represented nuclei are enlarged for visualization and do not reflect actual sizes. g, PCA of five interphase classes based on 3,653 protein groups after data filtering. Replicates of classes (n = 3 biological replicates) are highlighted by ellipses with a 95% confidence interval. h, Enrichment analysis of proteins regulated among the five nuclei classes. Significant proteins (515 ANOVA significant, FDR < 0.05, s0 = 0.1) were compared to the set of unchanged proteins based on Gene Ontology Biological Process (GOBP), Reactome pathways as well as cell cycle and cancer annotations derived from the Human Protein Atlas (HPA). A Fisher’s exact test with a Benjamini–Hochberg FDR of 0.05 was used (Supplementary Table 3). i, Unsupervised hierarchical clustering of all 515 ANOVA significant protein groups (Supplementary Table 4). Cell-cycle-regulated proteins reported by the HPA are shown in the lower bar. Nuclei classes (n = 3 biological replicates) are shown in the row bar. C1–C4 show clusters upregulated in the different nucleus classes. j, Network analysis of enriched pathways for protein clusters C1–C4. Pathway enrichment analysis was performed with the ClusterProfiler R package. ER, endoplasmic reticulum; PC, principal component.
Fig. 4
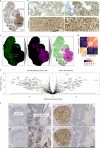
Fig. 4. DVP applied to archived tissue of a rare salivary gland carcinoma.
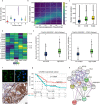
a, IHC staining of an acinic cell carcinoma of the salivary gland using the cell adhesion protein EpCAM. b, Representative regions from normal-appearing tissue (upper panels I and II) and acinic cell carcinoma (lower panels III and IV) from a. c, DVP workflow applied to the acinic cell carcinoma tissue. DL-based single cell detection of normal-appearing (green) and neoplastic (magenta) cells positive for EpCAM. Cell classification based on phenotypic features (form factor, area, solidity, perimeter and EpCAM intensity). d, Proteome correlations of replicates from normal-appearing (normal, n = 6) or cancer regions (cancer, n = 9). e, Volcano plot of pairwise proteomic comparison between normal and cancer tissue. t-test significant proteins (two-sided t-test, FDR < 0.05, s0 = 0.1, n = 6 biological replicates for normal and n = 9 for cancer) are highlighted by black lines. Proteins more highly expressed in normal tissue are highlighted in green on the volcanoʼs left, including known acinic cell markers (AMY1A, CA6 and PIP). Proteins more highly expressed in the acinic cell carcinoma are on the right in magenta, including the proto-oncogene SRC and interferon response proteins (MX1 and HLA-A; Supplementary Table 6). f, IHC validation of proteomic results. CNN1, SRC, CK5 and FASN are significantly enriched in normal or cancer tissue. Scale bar, 100 μm.
Fig. 5
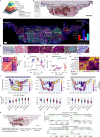
Fig. 5. DVP applied to archived primary melanoma tissue.
a, DVP sample isolation workflow to profile primary melanoma. b, DVP applied to primary melanoma immunohistochemically stained for the melanocyte marker SOX10 and the melanoma marker CD146. Left panel: stained melanoma tissue on a PEN glass membrane slide. Right panel: pathology-guided annotation of different tissue regions. Scale bar, 1 mm. c, Pathologist-guided and ML-based cell classification based on CD146 and SOX10 staining intensity and spatial localization: normal melanocytes, stromal cells, melanoma in situ, CD146-low melanoma, CD146-high melanoma, radial growth melanoma and vertical growth melanoma. Right lower panel: frequency of classes predicted by unsupervised ML (k-means clustering). d, Example pictures of the seven identified classes. Magnification factor = ×4,400. e, Correlation matrix (Pearson r) of all 27 measured proteome samples. f, PCA of proteomes. g, PCA of all melanoma-specific proteomes from in situ to invasive (vertical growth) melanoma. h, Unsupervised hierarchical clustering based on all 1,910 ANOVA significant (FDR < 0.05) protein groups. Two clusters of upregulated (cluster A) or downregulated (cluster B) proteins in invasive melanoma are highlighted. i, Tissue heat map mapping the proteomics results onto the imaging data. Relative pathway levels of selected terms from the two clusters are highlighted in i. Median protein levels were calculated per annotation and plotted for each isolated cell class against their x and y coordinates, as defined by their segmented cellular contours. j, Box plots of z-scored protein levels for the differentially regulated pathways visualized in i above. The box plots define the range of the data (whiskers), 25th and 75th percentiles (box) and medians (solid line). Outliers are plotted as individual dots outside the whiskers. k, Comparing proteomic changes in CD146-high melanoma cells (class 4) of the vertical growth (region 2) with the radial growth (region 1). Blood vessels in proximity to melanoma cells of the vertical growth are highlighted in red. Scale bar, 1 mm. l, Gene set enrichment analysis plot of significantly enriched pathways for melanoma cells of the vertical and radial growth phase. Pathway enrichment analysis was based on the protein fold change between vertical and radial melanoma cells and performed with the ClusterProfiler R package. Enriched terms with an FDR < 0.05 are shown. MHC, major histocompatibility complex.
Extended Data Fig. 1
Extended Data Fig. 1. Benchmarking of segmentation algorithm.
a, Cell body and nuclei segmentation of melanoma, salivary gland and fallopian tube tissue using the Biological Image Analysis Software (BIAS). We benchmarked the accuracy of our segmentation approach using the F1 metric and compared results to three additional methods M1-M3. unet4nuclei (M1), CellProfiler (M2), CellPose (M3), while OUR refers to nucleAIzer. Bars show mean F1-scores with SEM (standard error of the mean). Visual representation of the segmentation results: green areas correspond to true positive, blue to false positive and red to false negative. Data provided in Table 1 and Supplementary Table 1. b, BIAS allows the processing of multiple 2D and 3D microscopy image file formats. Examples for image pre-processing, deep learning-based image segmentation, feature extraction and machine learning-based phenotype classification. c, Left: Contour alignment in the LMD7 software before laser microdissection of fallopian tube epithelial cells. Middle: Screenshot after laser microdissection. Right: 384-well inspection after laser microdissection in individual fallopian tube epithelial cells. d, Number of quantified proteins per replicate of FOXJ1 positive and negative epithelial cells. Samples were acquired in data-independent mode and analyzed with the DIA-NN software. e, Replicate correlations of proteome measurements. Correlation values show Pearson correlations. f, Pathway enrichment analysis for proteins significantly higher in ciliated cells compared to secretory fallopian tube epithelial cells.
Extended Data Fig. 2
Extended Data Fig. 2. PCA and loadings of cell culture classes at sub-cellular level and number of significantly changed proteins vs. class abundance.
a, Quantitative proteomic results of whole cell and nuclei replicates, and comparison between whole cells and nuclei. b, Principal component analysis (PCA) of whole cell (n = 3) and nuclei proteomes (n = 3). Proteins with the strongest contribution to PC1 are highlighted. c, Relative proportions of the six nuclei classes. d, Number of differentially expressed proteins (two-sided t-test, n = 3 biological replicates) compared to unclassified nuclei (bulk). Proteins with an FDR less than 0.05 were considered significant. e, Correlation between number of significantly regulated proteins per nuclei class vs relative class proportion. A linear model was fitted to the data showing an inverse correlation with Pearson r = -0.96 (p-value = 0.01). f, Relative protein levels (z-score) of known cell cycle markers across the five nuclei classes. All bar graphs represent mean of data (n = 3 biological replicates) and error bars are s.d. ANOVA p-values are shown.
Extended Data Fig. 3
Extended Data Fig. 3. DVP discovers uncharacterized proteins with potential clinical relevance.
a, Violin plots showing nuclear area in pixels of the 6 nuclei classes identified by ML. b, Nuclear area in pixels of U2OS FUCCI cells in relation to the cell cycle pseudotime. Color code indicates point density. c, Nuclear area of three major cell cycle states G1, G1/S and S/G2 determined by fluorescently tagged CDT1 and GMNN intensities and Gaussian clustering. Box plots show the results of n = 238,675 cells in total (85,551 for G1, 83,121 for G1/S and 70,003 for S/G2). d, Relative protein levels of all identified ORF proteins in the dataset. C7orf50, C1orf112, C19orf53 and C11orf98 were differentially expressed (ANOVA p-value < 0.05) across the 5 nuclei classes (n = 3 biological replicates). e, Mean intensities of immunofluorescent stained C7orf50 and the cell cycle markers ANLN and CCNB1 in U20S cells. C7orf50 levels were quantified in nuclei with low and high ANLN and CNNB1 intensities. Box plots show the results of n = 263 cells per condition (C7orf50-ANLN) and n = 412 per condition (C7orf50-CCNB1). f, Upper panel: Representative immunofluorescence images of C7orf50 and DNA (DAPI) stained U2OS cells. Scale bar is 20 µm. Note, C7orf50 is enriched in nucleoli. Lower panel: Immunohistochemistry of a C7orf50 stained pancreatic adenocarcinoma (https://bit.ly/2X4re05). Image credit: Human Protein Atlas. Scale bar is 40µm. g, Kaplan-Meier survival analysis of pancreatic adenocarcinoma (https://bit.ly/3BAxewA) based on relative C7orf50 RNA levels (FPKM, number of Fragments Per Kilobase of exon per Million reads). RNA-seq data is reported as median FPKM, generated by The Cancer Genome Atlas (https://bit.ly/3iSOG8d). Patients were divided into two groups based on C7orf50 levels with n=41 low and n=135 high patients. A log-rank test was calculated with p = 0.0001. h, String interactome analysis for C7orf50. A high confidence score of 0.7 was used with the five closest interactors highlighted by color. The box plots in c and e define the range of the data (whiskers), 25th and 75th percentiles (box), and medians (solid line). Outliers are plotted as individual dots outside the whiskers.
Extended Data Fig. 4
Extended Data Fig. 4. DVP applied to archival tissue of a rare salivary gland carcinoma.
a, Immunohistochemical staining of normal salivary gland stained for the cell adhesion protein EpCAM. Supervised (random forest) ML was trained to identify acinar (green) and duct cells (turquoise). Scale bar = 20µm. b, Quantitative proteomic comparison between acinar and duct cells from tissue in A with known cell type specific markers highlighted (https://bit.ly/3iOK8Qf). c, Relative protein levels of selected pathways that were significantly higher in acinar or duct cells. d, Unsupervised hierarchical clustering of acinar and duct cell proteomes from two different patients together with acinar cell carcinoma cells. Note that normal acinar cells of two different tissues clustered together. Duct cells clustered furthest away. Prior to clustering, protein levels from different sample groups (duct cell tissue #1, acinar cell tissue #1, acinar cell tissue #2, carcinoma tissue #2) were averaged and z-scored. Bar on the left shows differentially expressed pathways from panel b with acini and duct specific proteins in green and turquoise, respectively.
Extended Data Fig. 5
Extended Data Fig. 5. DVP applied to archival tissue of primary melanoma.
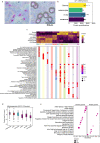
a, Isolation of tumor adjacent SOX10 positive melanocytes from a cutaneous melanoma tissue. Left: Contour alignment before laser microdissection. Right: Inspection after laser microdissection. b, Number of protein quantifications per sample type with n = 4 (melanocytes), n = 5 (stroma), n = 5 (melanoma in situ) and n = 13 (melanoma) independent replicates. Bar graphs represent mean of data and error bars are s.d. Samples were acquired in data-independent mode and analyzed with the DIA-NN software. c, Upper panel: Heatmap from Fig. 5h shown with identified protein clusters (color bar). Unsupervised hierarchical clustering based on all 1,910 ANOVA significant (FDR < 0.05) protein groups. Protein levels were z-scored. Lower panel: Pathway enrichment analysis of different row clusters obtained by unsupervised hierarchical clustering. The ReactomePA package was used for enrichment analysis with an FDR cut-off of 0.05 for all enriched terms. d, Relative levels (z-score) of proteins related to the KEGG term ‘melanogenesis’. Note, melanocytes show highest protein levels. The box plots define the range of the data (whiskers), 25th and 75th percentiles (box), and medians (solid line). Outliers are plotted as individual dots outside the whiskers. e, Pathway enrichment analysis of proteins up or down-regulated in vertical versus radial growth melanoma cells. Enrichment results were obtained with the ClusterProfiler R package based on an FDR < 0.05.

Comment in

Similar articles

Cited by

References

    1. Hériché J-K, Alexander S, Ellenberg J. Integrating imaging and omics: computational methods and challenges. Annu. Rev. Biomed. Data Sci. 2019;2:175–197. doi: 10.1146/annurev-biodatasci-080917-013328. - DOI
    1. Brunner A, et al. Ultra‐high sensitivity mass spectrometry quantifies single‐cell proteome changes upon perturbation. Mol. Syst. Biol. 2022;18:e10798. doi: 10.15252/msb.202110798. - DOI - PMC - PubMed
    1. Hollandi R, et al. nucleAIzer: a parameter-free deep learning framework for nucleus segmentation using image style transfer. Cell Syst. 2020;10:453–458. doi: 10.1016/j.cels.2020.04.003. - DOI - PMC - PubMed
    1. Smith K, Horvath P. Active learning strategies for phenotypic profiling of high-content screens. J. Biomol. Screen. 2014;19:685–695. doi: 10.1177/1087057114527313. - DOI - PubMed
    1. Isola, P., Zhu, J.-Y., Zhou, T. & Efros, A. A. Image-to-image translation with conditional adversarial networks. Preprint at https://arxiv.org/abs/1611.07004 (2016).

Publication types