. 2022 May 18;13(1):2733.
doi: 10.1038/s41467-022-30192-z.

Extended intergenic DNA contributes to neuron-specific expression of neighboring genes in the mammalian nervous system

Affiliations

Extended intergenic DNA contributes to neuron-specific expression of neighboring genes in the mammalian nervous system

Ravneet Jaura et al. Nat Commun. .

Abstract

Mammalian genomes comprise largely intergenic noncoding DNA with numerous cis-regulatory elements. Whether and how the size of intergenic DNA affects gene expression in a tissue-specific manner remain unknown. Here we show that genes with extended intergenic regions are preferentially expressed in neural tissues but repressed in other tissues in mice and humans. Extended intergenic regions contain twice as many active enhancers in neural tissues compared to other tissues. Neural genes with extended intergenic regions are globally co-expressed with neighboring neural genes controlled by distinct enhancers in the shared intergenic regions. Moreover, generic neural genes expressed in multiple tissues have significantly longer intergenic regions than neural genes expressed in fewer tissues. The intergenic regions of the generic neural genes have many tissue-specific active enhancers containing distinct transcription factor binding sites specific to each neural tissue. We also show that genes with extended intergenic regions are enriched for neural genes only in vertebrates. The expansion of intergenic regions may reflect the regulatory complexity of tissue-type-specific gene expression in the nervous system.


Conflict of interest statement

The authors declare no competing interests.

Figures
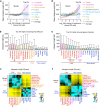
Fig. 1
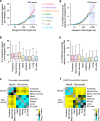
Fig. 1. Genes highly induced in neurons and neural tissues have significantly extended intergenic DNA.
a Genome-wide relationship between intergenic DNA lengths and gene induction levels, assessed by RNA-seq analysis of postnatal (0 day or P0) mouse tissues (forebrain, heart, intestine, liver, kidney, lung), embryonic (E15.5) neural tube, and ES cell-derived motor neurons (Supplementary Data 1). The lines represent the mean intergenic lengths for genes, binned according to the gene induction level for each tissue compared to ES cells (log2 fold-change in FPKM: fragments per kilobase of transcript per million reads, 200 genes per bin, 18,383 mRNA genes). The dotted line indicates the average intergenic lengths of all the mRNA genes (192.3 kb). b Box plots of the intergenic DNA lengths of the top 5% of all the mRNA genes, highly induced in the mouse CNS, PNS, and other tissues (919 genes, Supplementary Data 2), shown in the shaded area in (a). Dorsal root, trigeminal, and colonic neurons represent sensory neurons in the PNS. The box plots show the median (line in a box), first-to-third quartiles (boxes), and 1.5 × the interquartile range (whiskers). c Heatmap of the P-value (two-sided, two-sample t-test) for the difference in intergenic lengths of the top 5% of all the mRNA genes, highly induced in each tissue (919 genes) between pairwise combinations of the representative tissues shown in (b) (Supplementary Data 3). P-values were not adjusted for multiple comparisons. Yellow represents significant P-values, and black and cyan represent less or non-significant P-values. d Same analyses as shown in (a) except human tissues and cells. The lines represent the mean intergenic lengths for genes, binned according to the gene induction level for each tissue compared to ES cells (200 genes per bin, 19,268 mRNA genes, Supplementary Data 4). The dotted line indicates the average intergenic lengths of all the mRNA genes (197.3 kb). e, f Same analyses as shown in (b, c) except human tissues and cells, reported in Supplementary Data 1. The top 5% highly induced genes in each tissue and cell type (963 genes), out of all the mRNA genes, were used for the analyses.
Fig. 2
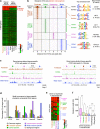
Fig. 2. Highly induced genes in neural supporting glial cells have extended intergenic lengths.
a Genome-wide relationship between intergenic DNA lengths and gene induction levels in neurons and various glial cell types in the mouse brain. The lines represent the mean intergenic lengths for the genes, binned according to the gene induction level for each cell type compared to ES cells (log2 fold-change in FPKM; 200 genes per bin; 18,383 mRNA genes; Supplementary Data 2). b Box plots of the intergenic DNA lengths of the top 5% highly induced genes in each cell type, out of all the mRNA genes (919 out of 18,383), shown in the shaded area in (a). The box plots indicate the median (line in a box), first-to-third quartiles (boxes), and 1.5 × the interquartile range (whiskers). *P = 1.05 × 10−10; two-sided, two-sample t-test (Supplementary Data 3). c The Venn diagram of the overlap of highly induced genes (2902 in total) between 3 CNS cell types (glutamatergic neurons, astrocytes, and oligodendrocytes) in mice. The top 10% highly induced genes in each cell type, out of all the mRNA genes, were used. 508 genes were induced in all 3 CNS cell types (Supplementary Methods). d Expression levels of 755 housekeeping (HK) genes and 2902 genes, based on the Venn diagram analysis in (c), in the 3 CNS cell types and 3 non-neural tissues (the mouse 8-week heart, intestine, and kidney). The HK genes were induced >2-fold compared to ES cells in all 6 cell types. 870 genes were induced in 2 CNS cell types and 1524 genes were induced in only 1 CNS cell type. The FPKM values were median normalized and log2 transformed (Supplementary Data 5). e Box plots of the intergenic DNA lengths of the groups of genes (2902 genes) defined in (c, d) and all other genes (13,817 genes). The box plots show the median (line in a box), first-to-third quartiles (boxes), and 1.5 × the interquartile range (whiskers). **P = 3.93 × 10−6; *P < 3.70 × 10−3; n.s., non-significant P > 0.44; two-sided, two-sample t-test.
Fig. 3
Fig. 3. Genes with long intergenic DNA are not highly expressed in neural tissues but repressed in non-neural tissues.
a Illustration of intergenic lengths for EID genes (genes with extremely long intergenic DNA). EID genes have longer than 500 kb of intergenic DNA lengths. “x” and “y” indicate the upstream and downstream DNA distances to the ends of the nearest neighboring genes, X and Y, from the ends of focal genes. b Absolute gene expression levels (log10 FPKM) in tissues shown in Fig. 1a and mouse ES cells, depending on the intergenic DNA lengths. The lines indicate the mean gene expression level for genes, binned according to the intergenic DNA lengths for each tissue (200 genes per bin, 18,383 mRNA genes). EID genes (shaded) are repressed in non-neural tissues and ES cells. c Gene ontology (GO) analysis for EID genes (1525 genes), shown in the shaded area in (b), and genes having short intergenic DNA regions (1848 genes with <10 kb of intergenic DNA lengths). The most enriched seven non-redundant GO terms are shown (Supplementary Data 6, 7). A one-sided Fisher’s exact test was used to calculate P-values in gene set enrichment analysis. P-values were not adjusted for multiple comparisons.
Fig. 4
Fig. 4. Genes with long intergenic DNA have significantly more accessible and active enhancers in neural tissues than other tissues.
a, d Average number of ATAC-seq peaks (a) and ChIP-seq H3K27ac peaks (d) per intergenic DNA region for genes, depending on the intergenic DNA lengths, in mouse tissues and cells shown in Fig. 3b. The lines indicate the average number of peaks for genes, binned according to the intergenic DNA lengths for each tissue and cell type (200 genes per bin, 18,383 mRNA genes, Supplementary Data 8). b, e Box plots of the number of ATAC-seq peaks (b) and ChIP-seq H3K27ac-enriched peaks (e) per intergenic DNA region of EID genes in each tissue and cell type (1621 genes), shown in the shaded areas in (a, d). The box plots show the median (line in a box), first-to-third quartiles (box), and 1.5 × the interquartile range (whiskers). c, f Heatmap of the P-values (two-sided, two-sample t-test) for the difference in the number of ATAC-seq peaks (c) and H3K27ac-enriched peaks (f) per intergenic DNA regions of EID genes (1621 genes) between all pairwise combinations of tissues and cells, shown in (b, e). P-values were not adjusted for multiple comparisons. Yellow represents significant P-values, and black and cyan represent less or non-significant P-values (Supplementary Data 9).
Fig. 5
Fig. 5. Extended intergenic regions of generic neural genes have distinct enhancers containing tissue-specific TF-binding sites.
a Expression levels of 17,804 all mRNA genes, expressed in 8 tissues. They include the housekeeping (HK; 790 genes), which were induced >2-fold in all 8 mouse tissues, and generic neural genes (1131 genes), which were induced >2-fold only in 4 neural tissues. The FPKM values were median normalized and log2 transformed. b ATAC-seq mapping in the intergenic accessible DNA sites of the 625 generic neural genes with >100 kb intergenic regions in 4 neural tissues, grouped by commonly accessible DNA sites (521 peaks) and 4 groups of the tissue-specific accessible DNA sites (11,004 peaks). The de novo DNA motifs represent the most (top) enriched motif within 50 bp from the midpoints of ATAC-seq peaks in each group (Supplementary Data 10). c Examples of intergenic regions with multiple tissue-specific ATAC-seq peaks (arrows) in multiple neural tissues. The indicated loci show the intergenic regions of the neural genes, Negr1 (Neuronal growth regulator) and Sst (Somatostatin), with distinct tissue-specific ATAC-peaks. d Percentage of the occurrence of the DNA motifs within 100 bp from the midpoints of the tissue-specific intergenic ATAC-seq peaks, identified in (b) and background genomic regions. All MEME motif format files, used here, were reported in Supplementary Data 11. e Expression levels of 3153 mRNA genes grouped by the number of neural tissues expressing the same set of neural genes and tissue-specific genes. The top 10% highly induced genes in each tissue, out of all the mRNA genes (1780 out of 17,804), were used to define the overlap of induced genes between each tissue (Supplementary Methods). The housekeeping genes were not included as the overlapped genes. The FPKM values were median normalized and log2 transformed. f Box plots of the intergenic DNA lengths of the 4 groups of neural genes grouped in (e), 790 housekeeping genes defined in (a), and all other genes (13,861 genes). The box plots show the median (line in a box), first-to-third quartiles (boxes), and 1.5 × the interquartile range (whiskers). ***P < 2.73 × 10−13; **P < 9.35 × 10−4; *P < 4.12 × 10−2; two-sided, two-sample t-test.
Fig. 6
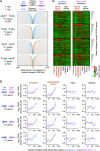
Fig. 6. Genomic view of tissue-specific expression of neighboring genes depending on intergenic lengths.
a Genome-wide distribution of TSSs (orange dots) and TESs (cyan dots) of 18,040 all mRNA genes, sorted by the shared intergenic lengths between neighboring genes, in the 4 groups of gene pairs. Arrows show the transcription direction of gene pairs. b Gene induction levels of the left and right genes in mouse tissues (log2 fold-change in FPKM in each tissue compared to ES cells), ordered by the shared intergenic lengths of the 4 groups shown in (a). c Genome-wide induction levels of the neighboring left and right genes in the representative tissues, depending on the shared intergenic DNA length. Gene induction levels in each tissue compared to ES cells (log2 fold-change in FPKM) were shown in the 4 groups of gene pairs defined in (a). The lines indicate the mean gene induction levels for genes, binned according to the shared intergenic lengths for each tissue (200 genes per bin). All gene pairs and log2 FKPM values used in (a, b, c) are listed in Supplementary Data 13.
Fig. 7
Fig. 7. Intergenic enhancers are necessary for the expression of neighboring neural genes in motor neurons.
a The location of Isl1-bound intergenic enhancers, detected by ChIP-seq Isl1, ChIP-seq H3K27ac, and ATAC-seq, located between Ntf3 and Kcna5 genes in motor neurons differentiated from mouse ES cells. 1719 bp genomic DNA of motor neuron-specific NK-E1 enhancer (blue arrow) was deleted in an ES cell using CRISPR genome editing. b, c Same as (a) except OM-E1 (cyan arrow) and CP-E1 (green arrow) enhancers that are located in the intergenic regions between Oprl1 and Myt1, and Chrm2 and Ptn genes, respectively. 1109 bp of OM-E1 and 1468 bp of CP-E1 enhancers were deleted. d Expression levels of neighboring genes, Ntf3 and Kcna5, measured by quantitative RT-PCR in motor neurons containing the NK-E1 enhancer deletion, normalized to wild type expression levels of Ntf3 and Kcna5. Error bars represent standard deviation (SD). Data are presented as mean values +/− SD. Dots represent the corresponding data points (Supplementary Data 14). Two biologically independent differentiated cells were examined over 2 independent experiments (n = 4). e Same as (d) except expression levels of Oprl1 and Myt1 genes for OM-E1 enhancer deletion. Two biologically independent differentiated cells were examined over 2 independent experiments (n = 4). f Same as (d) except expression levels of Chrm2 and Ptn genes for CP-E1 enhancer deletion. Two biologically independent differentiated cells were examined over 3 independent experiments (n = 6). g Percentage of intergenic enhancers interacting with the promoters of the neighboring genes detected by Hi-C. The number of interactions between enhancers and promoters in the mouse cortical neurons, human cortex, and hippocampus was shown in Supplementary Table 1 and Data 15.
Fig. 8
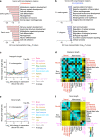
Fig. 8. Long intergenic regions are enriched in neural genes only in vertebrates.
a, b Gene ontology analysis for the top 5% genes, having the longest intergenic regions, of all the protein-coding genes in each organism. The most enriched seven non-redundant GO terms were shown (Supplementary Data 6, 7). A one-sided binomial test was used to calculate P-values in gene set enrichment analysis. P-values were not adjusted for multiple comparisons. c Genome-wide relationship between intergenic DNA lengths and gene induction levels, assessed by RNA-seq analysis of tissues and cells in Drosophila melanogaster (Supplementary Data 1). The lines represent the mean intergenic lengths for genes binned according to the gene induction level for each tissue compared to embryonic Schneider 2 (S2) cells (log2 fold-change in FPKM, 200 genes per bin, 9897 mRNA genes, Supplementary Data 18). The dotted line indicates the average intergenic length of all the mRNA genes (8.3 kb). d Heatmap of the P-values (two-sided, two-sample t-test) for the difference in intergenic lengths of the top 5% highly induced genes in each tissue (495 genes), out of all the mRNA genes, between pairwise combinations of the representative tissues shown in Supplementary Fig. 13. P-values were not adjusted for multiple comparisons. Yellow represents significant P-values. Cyan and black represent less or non-significant P-values (P > 1 × 10−3) (Supplementary Data 3). e, f Same analyses as shown in (c, d) except gene lengths instead of intergenic lengths. Gene length is defined as the distance between transcription start and end sites. The average gene length (6.6 kb) of all the mRNA genes, shown as the dotted line in (e), was used for normalization to the average intergenic length shown in (c).
Fig. 9
Fig. 9. Extended intergenic regions contain distinct tissue-specific enhancers contributing to the expression of neighboring neural genes.
We propose that generic neural genes expressed in multiple neural tissues have extended intergenic regions (median length: 180.7 kb) with an average of 8 neural tissue-specific enhancers (median 16.1 kb between the closest enhancers per intergenic region; Supplementary Figs. 5, 8d). Tissue-specific neural genes also have significantly longer intergenic regions than non-neural genes. Neural genes mostly share their intergenic regions with neighboring neural genes, having many cell- and tissue-specific intergenic enhancers bound by the distinct neural TFs. These neural TFs sites are chromatin accessible and enriched with acetylation of H3K27 in a tissue-specific manner. An insulator binding protein, CTCF, binds to commonly accessible DNA sites in the intergenic regions. As a result, co-expression of neighboring neural genes is controlled mostly by distinct intergenic enhancers rather than common enhancers. We propose that a large number of neural cis-regulatory elements in extended intergenic regions lead to tissue- and developmental-specific neural gene expression in the complex mammalian nervous system.

Similar articles

Cited by

References

    1. Elgar G, Vavouri T. Tuning in to the signals: noncoding sequence conservation in vertebrate genomes. Trends Genet. 2008;24:344–352. doi: 10.1016/j.tig.2008.04.005. - DOI - PubMed
    1. Lee H, Zhang Z, Krause HM. Long noncoding RNAs and repetitive elements: junk or intimate evolutionary partners? Trends Genet. 2019;35:892–902. doi: 10.1016/j.tig.2019.09.006. - DOI - PubMed
    1. Shabalina SA, Spiridonov NA. The mammalian transcriptome and the function of non-coding DNA sequences. Genome Biol. 2004;5:105. doi: 10.1186/gb-2004-5-4-105. - DOI - PMC - PubMed
    1. Elkon R, Agami R. Characterization of noncoding regulatory DNA in the human genome. Nat. Biotechnol. 2017;35:732–746. doi: 10.1038/nbt.3863. - DOI - PubMed
    1. Ong CT, Corces VG. Enhancer function: new insights into the regulation of tissue-specific gene expression. Nat. Rev. Genet. 2011;12:283–293. doi: 10.1038/nrg2957. - DOI - PMC - PubMed

Publication types

Substances