. 2022 Jul;607(7918):351-355.
doi: 10.1038/s41586-022-04865-0. Epub 2022 May 18.

Limited cross-variant immunity from SARS-CoV-2 Omicron without vaccination

Affiliations

Limited cross-variant immunity from SARS-CoV-2 Omicron without vaccination

Rahul K Suryawanshi et al. Nature. 2022 Jul.

Abstract

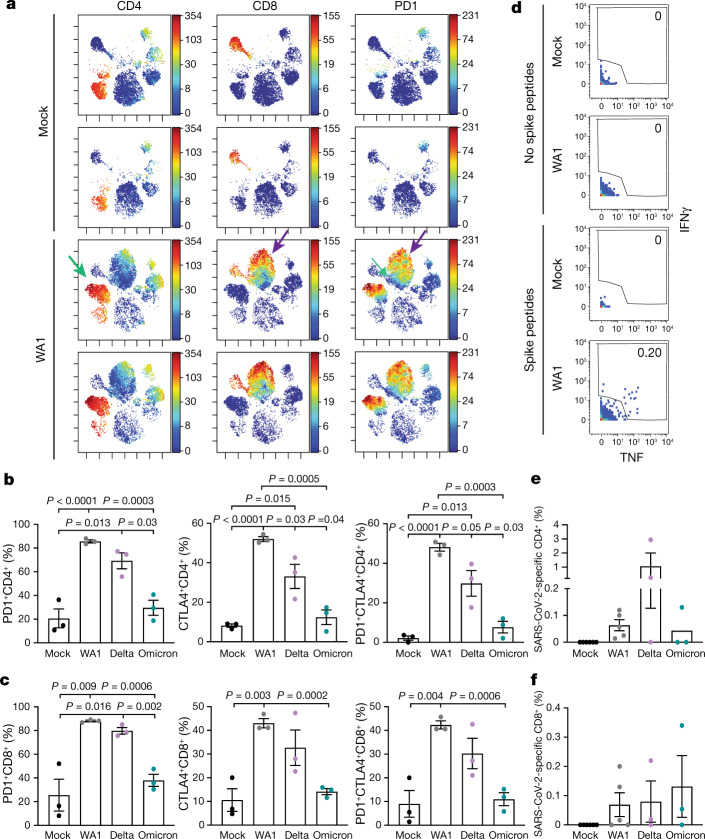
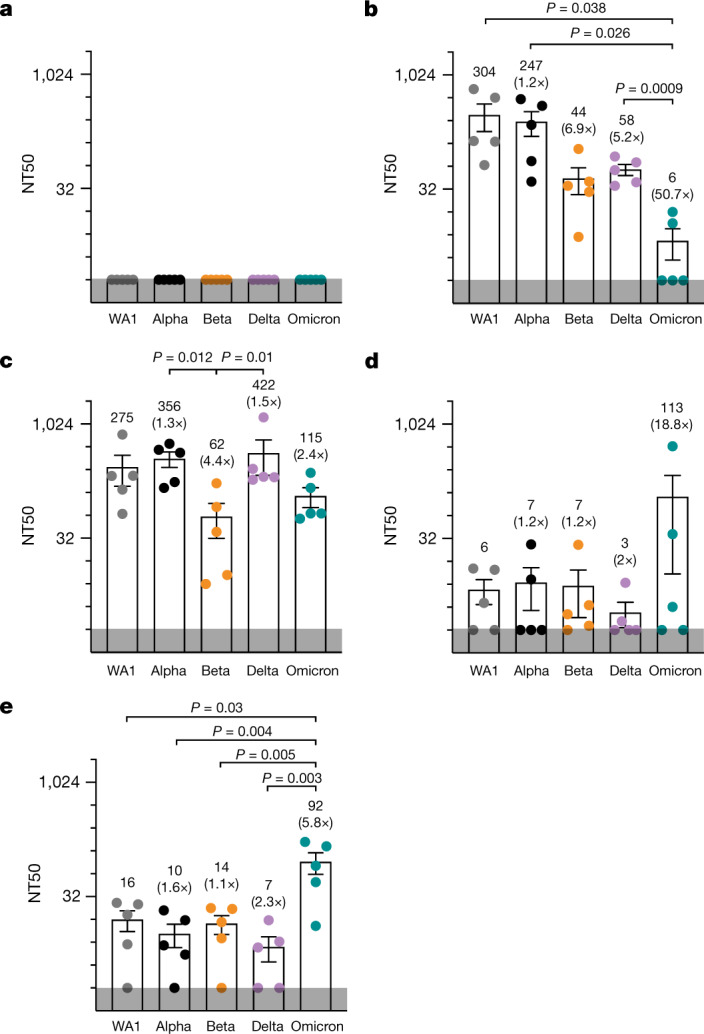
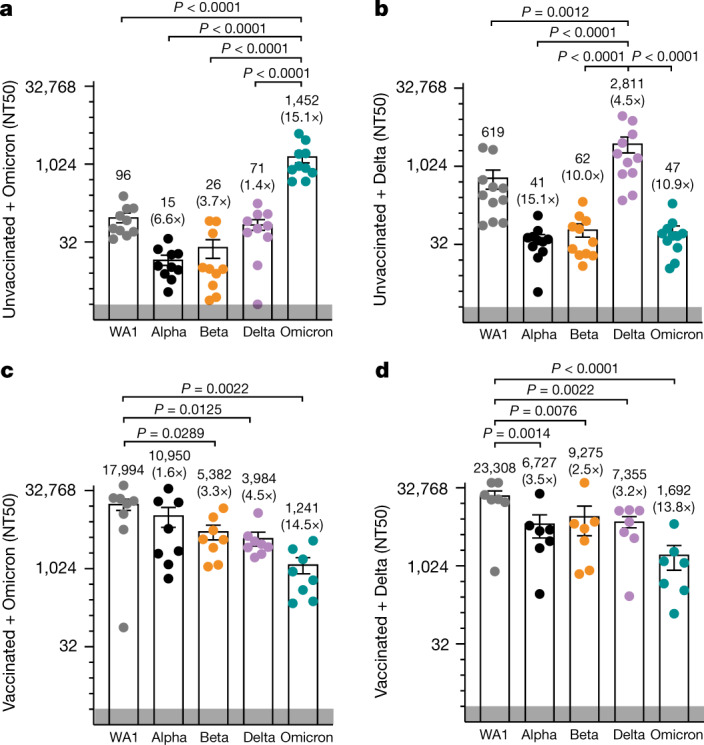
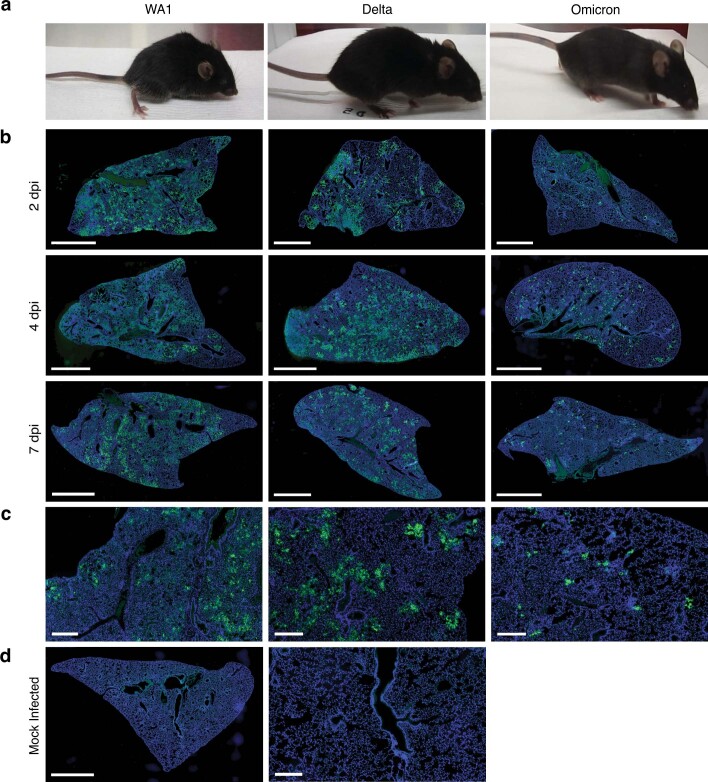
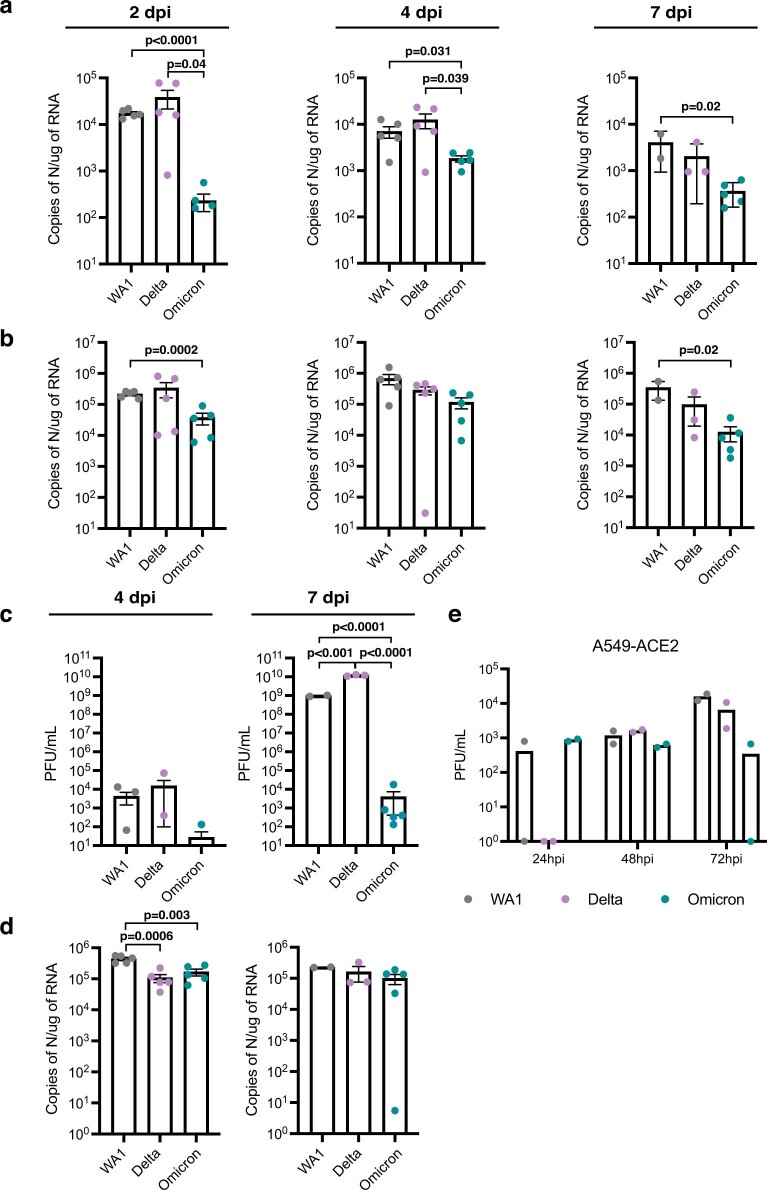
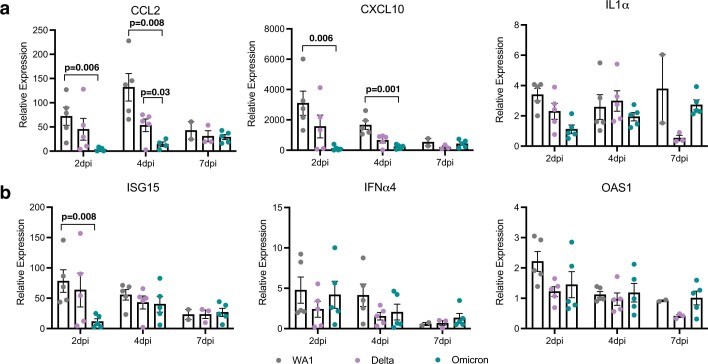
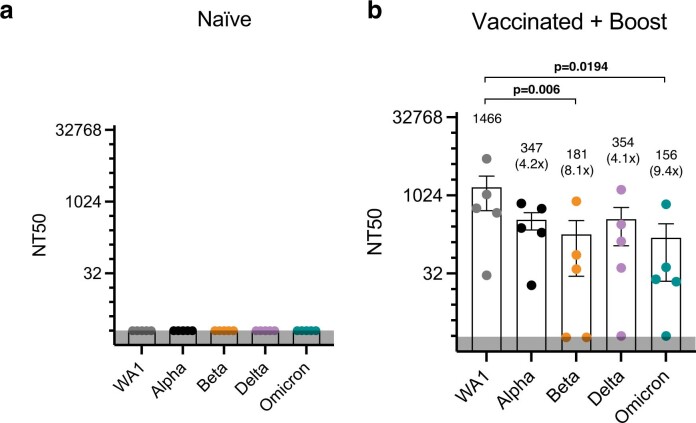
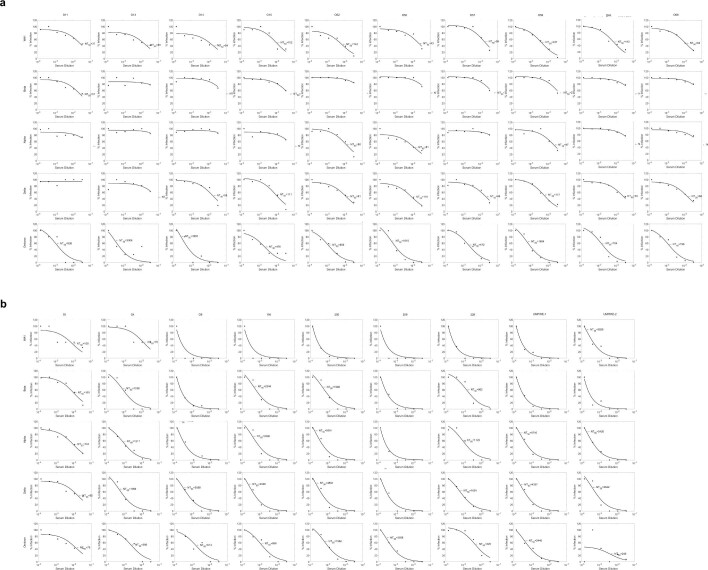
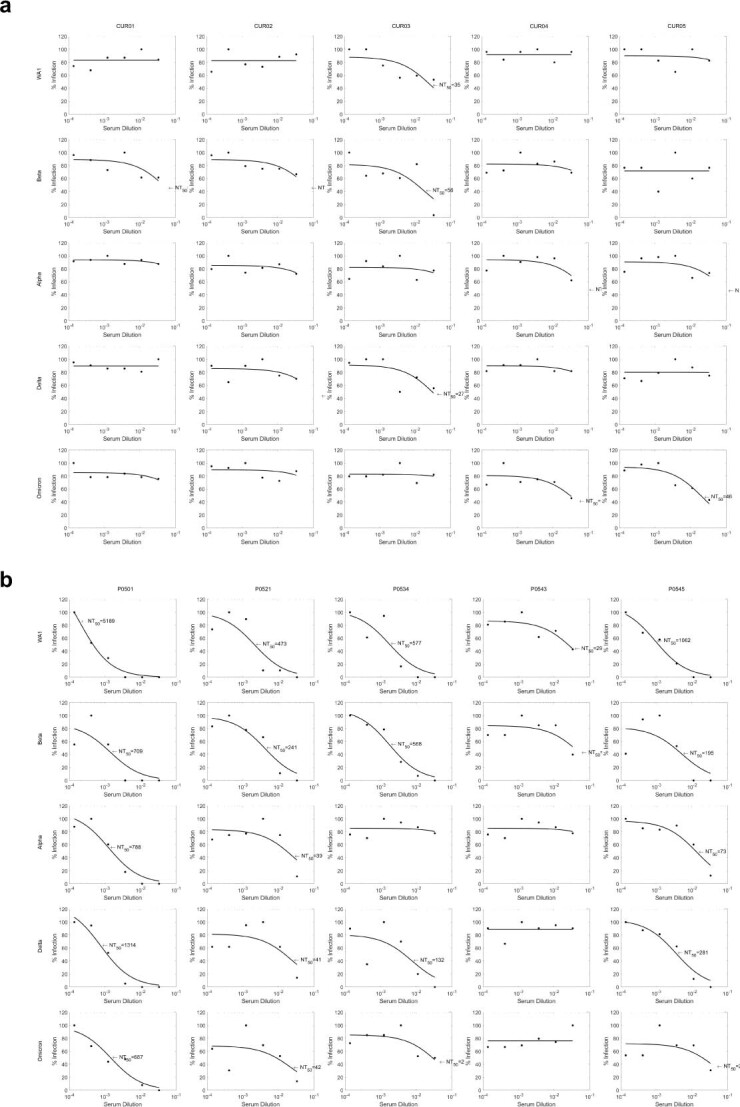
SARS-CoV-2 Delta and Omicron are globally relevant variants of concern. Although individuals infected with Delta are at risk of developing severe lung disease, infection with Omicron often causes milder symptoms, especially in vaccinated individuals1,2. The question arises of whether widespread Omicron infections could lead to future cross-variant protection, accelerating the end of the pandemic. Here we show that without vaccination, infection with Omicron induces a limited humoral immune response in mice and humans. Sera from mice overexpressing the human ACE2 receptor and infected with Omicron neutralize only Omicron, but not other variants of concern, whereas broader cross-variant neutralization was observed after WA1 and Delta infections. Unlike WA1 and Delta, Omicron replicates to low levels in the lungs and brains of infected animals, leading to mild disease with reduced expression of pro-inflammatory cytokines and diminished activation of lung-resident T cells. Sera from individuals who were unvaccinated and infected with Omicron show the same limited neutralization of only Omicron itself. By contrast, Omicron breakthrough infections induce overall higher neutralization titres against all variants of concern. Our results demonstrate that Omicron infection enhances pre-existing immunity elicited by vaccines but, on its own, may not confer broad protection against non-Omicron variants in unvaccinated individuals.


Conflict of interest statement

J.A.D. is a cofounder of Caribou Biosciences, Editas Medicine, Scribe Therapeutics, Intellia Therapeutics and Mammoth Biosciences; a scientific advisory board member of Vertex, Caribou Biosciences, Intellia Therapeutics, eFFECTOR Therapeutics, Scribe Therapeutics, Mammoth Biosciences, Synthego, Algen Biotechnologies, Felix Biosciences, The Column Group and Inari; a director at Johnson & Johnson and Tempus; and has research projects sponsored by Biogen, Pfizer, AppleTree Partners and Roche. C.Y.C. is the director of the UCSF-Abbott Viral Diagnostics and Discovery Study; receives research support from Abbott Laboratories; and also receives support for SARS-CoV-2 research unrelated to this study from Mammoth Biosciences.

Figures

Fig. 1
Fig. 1. Robust infection of K18-hACE2 mice with the Delta and ancestral variants, but not with the Omicron variant.
a, Schematic of the experiment. Fifteen mice per group were intranasally infected with 104 p.f.u. of the indicated variant. Body temperature and weight were monitored daily. At 2, 4 and 7 days post-infection (d.p.i.), the upper respiratory tract and lungs were harvested and processed for downstream analysis. n = 5 per group. b, Changes in body temperature of mice infected with WA1, Delta and Omicron. Data are shown as the average ± s.d. and were analysed by two-way analysis of variance (ANOVA) and adjusted for multiple testing using the Bonferroni test. c, Severe weight loss of WA1-infected and Delta-infected mice. Data are shown as the average ± s.d. and were analysed by two-way ANOVA and adjusted for multiple testing using the Bonferroni test. The horizontal dashed lines in b,c indicate the baseline body temperature (b) and weight (c) of mice. d, Probability of survival of variant-infected mice. n = 10. Source Data
Fig. 2
Fig. 2. Robust viral replication of WA1 and Delta, but not Omicron, in airway cells from mice and humans.
a, Plaque assay titres from the upper airway (nasal turbinates and bronchus) of WA1-infected, Delta-infected and Omicron-infected mice at the indicated time points. Data are shown as the average ± s.e.m. analysed by the two-tailed unpaired Student’s t-test. Each dot represents an infectious virus titre in an individual mouse at 2 d.p.i. (n = 5), 4 d.p.i. (n = 5) and 7 d.p.i. (WA1 infection group n = 2, Delta n = 2 and Omicron n = 5). b, Plaque assay titres from the lungs of infected mice at the indicated time points. Data are shown as the average ± s.e.m. at each time point and were analysed by the two-tailed unpaired Student’s t-test. Each dot represents infectious virus titre in individual mice at 2 d.p.i. (n = 5), 4 d.p.i. (n = 5) and 7 d.p.i. (WA1 infection group n = 2, Delta n = 2 and Omicron n = 5). c, Plaque assay titres from supernatants of infected human airway organoids (multiplicity of infection (MOI) of 1). Data are shown as the average ± s.e.m. Each dot represents an independent experiment using human lung airway organoids generated at 24 h (n = 2) and 48 h (n = 3). h.p.i., hours post-infection. d, Plaque assay titres from supernatants of infected A549-ACE2 cells (MOI of 0.1). n = 2 represents infectious virus titres in independent experiments. Source Data
Fig. 3
Fig. 3. Ancestral and VOC SARS-CoV-2 elicit immune responses in the lungs of mice.
a, T cells from lungs of infected mice (n = 3) were phenotypically distinct and expressed PD1. Single-cell suspensions of lungs from mock-infected and WA1-infected K18-hACE2 mice were harvested at 9 d.p.i. and analysed by CyTOF. Shown are tSNE plots gated on total immune cells (CD45+) from the lungs of mice, coloured by expression levels of the antigen listed at the top (red shows the highest expression and blue represents the lowest expression). 'Islands' of CD4+ and CD8+ T cells unique to the infected mice (identified by green and purple arrows, respectively, in the third row) express especially high levels of the activation/exhaustion marker PD1, as demonstrated in the right-hand column. b,c, T cells from lungs of infected mice (n = 3) expressed elevated levels of the activation/checkpoint antigens PD1 and CTLA4. The proportions of CD4+ (b) and CD8+ (c) T cells expressing PD1, CTLA4 or both PD1 and CTLA4 are indicated. d, SARS-CoV-2-specific T cells are elicited in the lungs of mice infected with SARS-CoV-2. Representative plots corresponding to pulmonary T cells from uninfected (mock) and WA1-infected K18-hACE2 mice, stimulated for 6 h with or without overlapping SARS-CoV-2 spike peptides. Note that SARS-CoV-2-specific T cells (those producing IFNγ and/or TNF) were only detected in infected mice after peptide stimulation (n = 3). e,f, SARS-CoV-2-specific T cells are elicited in the lungs of mice infected with WA1 (n = 6), Delta (n = 3) and Omicron (n = 3). The proportions of CD4+ (e) and CD8+ (f) T cells expressing IFNγ and/or TNF (gated as shown in c) are indicated. CD4+ T cell responses trended highest in Delta-infected mice, and the CD8+ T cell responses were highest in Delta-infected and Omicron-infected mice (n = 3). In b,c,e,f, data are shown as the average ± s.e.m. analysed by the two-tailed unpaired Student’s t-test. Source Data
Fig. 4
Fig. 4. Cross-variant neutralization of SARS-CoV-2 isolates from the sera of infected mice.
K18-hACE2 mice were infected with 1 × 104 p.f.u. of WA1, Delta or Omicron. The virus neutralization assay was carried out with sera collected at 7 d.p.i. Data points in the graph represent individual sera samples showing NT50s against SARS-CoV-2 isolates. The numbers in parentheses indicate the fold change in neutralization efficacy or resistance of respective isolates relative to the NT50 of the ancestral isolate (WA1). The grey band at the bottom of the graph indicates the limit of detection. ad, Graphs representing the NT50 of sera from naive (a), WA1-infected (b), Delta-infected (c) and Omicron-infected (d) mice against different viral isolates. n = 5 mouse in each group. e, K18-hACE2 mice were infected with 5 × 102 p.f.u. of Omicron (n = 5). The virus neutralization assay was carried out with sera collected at 9 d.p.i. Data are presented as average ± s.e.m. and were analysed by two-way ANOVA and two-tailed unpaired Student’s t-test. Source Data
Fig. 5
Fig. 5. Cross-variant neutralization of SARS-CoV-2 isolates from human sera.
ad, Graphs representing the NT50 of variants by sera from unvaccinated individuals with likely Omicron infection (based on date of collection; n = 10) (a), unvaccinated individuals with likely Delta infection (based on date of collection; n = 11) (b), vaccinated individuals with a confirmed Omicron infection (n = 8) (c) and vaccinated individuals with confirmed Delta infection (based on date of collection; n = 7) (d). The data points in the graph represent individual serum samples. The grey band at the bottom of the graph indicates the limit of detection. Data presented in a–d are average ± s.e.m. and were analysed by two-way ANOVA and two-tailed unpaired Student’s t-test. The details regarding samples (group, age, sex, COVID-19 infection status, vaccination dates, and sample collection dates after infection or symptoms are summarized in Extended Data Table 1). Source Data
Extended Data Fig. 1
Extended Data Fig. 1. Physical conditions of the infection mice at 5 dpi.
a, Representative images of WA1-, Delta-, and Omicron-infected mice 5 dpi. WA1-infected mice were lethargic and had a hunched posture, ungroomed coat, and squinted eyes. Delta-infected mice are mildly lethargic. Omicron-infected mice appeared normal. b, Representative images of lungs from mice infected with WA1, Delta, or Omicron at 2 dpi (n = 5), 4 dpi (n = 5), and 7 dpi (WA1 infection group n = 2, Delta n = 2 and Omicron n = 5). SARS-CoV-2 nucleocapsid is stained in green and nucleus is stained in blue. Scale bar, 2 mm. c, Representative images of tissue sections from lung tissue infected with WA1, Delta, or Omicron collected at 7 dpi (WA1 infection group n = 2, Delta n = 2 and Omicron n = 5). SARS-CoV-2 nucleocapsid is stained in green and nucleus is stained in blue. Scale bar, 300 μm. d, Representative images of mock infected lungs. SARS-CoV-2 nucleocapsid is stained in green and nucleus is stained in blue. Scale bar, 2 mm (left panel) and 300 μm (right panel), n = 5 mice.
Extended Data Fig. 2
Extended Data Fig. 2. Lower viral replication of Omicron in mice and human cells.
a, RT-qPCR of SARS-CoV-2 N RNA isolated from upper respiratory tract (nasal turbinates and bronchus) of WA1-(grey), Delta-(purple), and Omicron-(teal) infected mice at indicated time points. Data are expressed in absolute copies/μg based on a standard curve of N gene with known copy number. Data are shown as an average ± SEM at 2 dpi (n = 5), 4 dpi (n = 5), and 7 dpi (WA1 infection group n = 2, Delta n = 2 and Omicron n = 5) and analyzed by two-tailed unpaired student’s t-test. b, RT-qPCR of SARS-CoV-2 N RNA isolated from lungs of infected mice at indicated time points. Data are expressed in absolute copies/μg based on a standard curve of N gene with known copy number. Data are shown as an average ± SEM at 2 dpi (n = 5), 4 dpi (n = 5), and 7 dpi (WA1 infection group n = 2, Delta n = 2 and Omicron n = 5) and analyzed by the two-tailed unpaired student's t-test. c, Plaque assay titers from the brains of infected mice at indicated time points. Data are shown as an average ± SEM at 4 dpi (n = 5) and 7 dpi (WA1 infection group n = 2, Delta n = 2 and Omicron n = 5) and analyzed by the two-tailed unpaired student’s t-test. d, RT-qPCR of SARS-CoV-2 N RNA isolated from brains of infected mice at indicated time points. Data are expressed in absolute copies/μg based on a standard curve of N gene with known copy number. Data are shown as an average ± SEM at 4 (n = 5) and 7 (n = 2–5) dpi and analyzed by the two-tailed unpaired student's t-test. e, Plaque assay titers from supernatants of infected A549-ACE2 (MOI of 0.01). Data are shown as average ± SEM, n = 2. Source Data
Extended Data Fig. 3
Extended Data Fig. 3. Differential expression of proinflammatory markers in lungs of infected mice.
a, RT-qPCR of proinflammatory cytokines and chemokines from RNA isolated from lungs of infected mice at the indicated time points. Data are expressed relative to mock-infected mice. Data are shown as the average ± SEM at 2 dpi (n = 5), 4 dpi (n = 5), and 7 dpi (WA1 infection group n = 2, Delta n = 2 and Omicron n = 5) and analyzed by two-tailed unpaired student’s t-test. b, RT-qPCR of interferon-stimulated genes from RNA isolated from lungs of infected mice at the indicated time points. Data are expressed relative to mock-infected mice. Data are shown as the average ± SEM at 2 dpi (n = 5), 4 dpi (n = 5), and 7 dpi (WA1 infection group n = 2, Delta n = 2 and Omicron n = 5) and analyzed by the two-tailed unpaired student’s t-test. Source Data
Extended Data Fig. 4
Extended Data Fig. 4. Cross-variant neutralization of SARS-CoV-2 isolates by human sera.
Graphs representing NT50 of sera from a, naive and b, vaccinated and Pfizer-boosted individuals against different viral isolates, n = 5 in each group. The average neutralization efficacies of sera from each graph are shown and fold-changes relative to ancestral isolate (WA1) are shown in parentheses. The grey band indicates the limit of detection. Data are shown as the average ± SEM and analyzed by 2-way ANOVA and adjusted for multiple testing using the Bonferroni test. Source Data
Extended Data Fig. 5
Extended Data Fig. 5. Sera neutralizing titer assays of from SARS-CoV-2-infected mice.
Neutralization assays of sera from a, naive (representative), b, WA1-, c, Delta-, and d, Omicron-infected mice at 7 days post-infection against WA1, Alpha, Beta, Delta, and Omicron isolates. e, Neutralization assays of sera from Omicron-infected mice at 9 days post-infection against WA1, Alpha, Beta, Delta, and Omicron isolates.
Extended Data Fig. 6
Extended Data Fig. 6. Sera neutralizing titer assays of individuals infected with Omicron.
Neutralization assays of sera from a, unvaccinated and b, vaccinated individuals infected with Omicron (likely based on time of collection) against WA1, Alpha, Beta, Delta, and Omicron isolates.
Extended Data Fig. 7
Extended Data Fig. 7. Sera neutralizing titer assays from individuals infected with Delta.
Neutralization assays of sera from a, unvaccinated and b, vaccinated individuals infected with Delta (likely based on time of collection) against WA1, Alpha, Beta, Delta, and Omicron isolates.
Extended Data Fig. 8
Extended Data Fig. 8. Sera neutralizing titer assays from individuals.
Neutralization assays of sera from a, naive and b, vaccinated and Pfizer boosted individuals against WA1, Alpha, Beta, Delta, and Omicron isolates.

Update of

Comment in

Similar articles

Cited by

References

    1. Sigal A. Milder disease with Omicron: is it the virus or the pre-existing immunity? Nat. Rev. Immunol. 2022;22:69–71. doi: 10.1038/s41577-022-00678-4. - DOI - PMC - PubMed
    1. Wolter N, et al. Early assessment of the clinical severity of the SARS-CoV-2 omicron variant in South Africa: a data linkage study. Lancet. 2022;399:437–446. doi: 10.1016/S0140-6736(22)00017-4. - DOI - PMC - PubMed
    1. Dejnirattisai W, et al. SARS-CoV-2 Omicron-B.1.1.529 leads to widespread escape from neutralizing antibody responses. Cell. 2022;185:467–484.e15. doi: 10.1016/j.cell.2021.12.046. - DOI - PMC - PubMed
    1. Syed, A. M. et al. Omicron mutations enhance infectivity and reduce antibody neutralization of SARS-CoV-2 virus-like particles. Preprint at medRxiv10.1101/2021.12.20.21268048 (2022). - PMC - PubMed
    1. Mannar D, et al. SARS-CoV-2 Omicron variant: antibody evasion and cryo-EM structure of spike protein–ACE2 complex. Science. 2022;375:760–764. doi: 10.1126/science.abn7760. - DOI - PMC - PubMed

Publication types

Supplementary concepts