. 2022 Sep;22(9):2139-2157.
doi: 10.1111/ajt.17097. Epub 2022 Jul 5.

Extracellular vesicles derived from patients with antibody-mediated rejection induce tubular senescence and endothelial to mesenchymal transition in renal cells

Affiliations

Extracellular vesicles derived from patients with antibody-mediated rejection induce tubular senescence and endothelial to mesenchymal transition in renal cells

Rossana Franzin et al. Am J Transplant. 2022 Sep.

Abstract

Extracellular vesicles (EV) are emerging mediators in several diseases. However, their role in the pathophysiology of antibody-mediated allograft rejection (AMR) has been poorly investigated. Here, we investigated the role of EV isolated from AMR patients in inducing tubular senescence and endothelial to mesenchymal transition (EndMT) and analyzed their miRNA expression profile. By multiplex bead flow cytometry, we characterized the immunophenotype of plasma AMR-derived EV and found a prevalent platelet and endothelial cell origin. In vitro, AMR-derived EV induced tubular senescence by upregulating SA-β Gal and CDKN1A mRNA. Furthermore, AMR-derived EV induced EndMT. The occurrence of tubular senescence and EndMT was confirmed by analysis of renal biopsies from the same AMR patients. Moreover, AMR-derived EV induced C3 gene upregulation and CFH downregulation in tubular epithelial cells, with C4d deposition on endothelial cells. Interestingly, RNase-mediated digestion of EV cargo completely abrogated tubular senescence and EndMT. By microarray analysis, miR-604, miR-515-3p, miR-let-7d-5p, and miR-590-3p were significantly upregulated in EV from AMR group compared with transplant controls, whereas miR-24-3p and miR-29a-3p were downregulated. Therefore, EV-associated miRNA could act as active player in AMR pathogenesis, unraveling potential mechanisms of accelerated graft senescence, complement activation and early fibrosis that might lead to new therapeutic intervention.

Keywords: aging; antibody-mediated allograft rejection; cellular senescence; complement system; extracellular vesicles; miRNA.


Figures

FIGURE 1
FIGURE 1
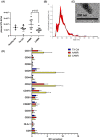
Characterization and quantization of AMR‐derived EV. (A) Quantization of EV isolated from plasma of AMR patients was assessed by nanoparticle tracking analysis (Nanosight™ technology, NTA EV/ml) after isolation by ultracentrifugation. Kruskal–Wallis test (p = .031) revealed a significant difference among all groups (Healthy EV n = 5, for TX Ctrl, AAMR and CAMR n = 9). Dunn’s multiple comparisons post hoc test confirmed a significant increase in the number of EV in the AAMR group compared with the CAMR (p = .02). (B) Size distribution of plasma EV by nanoparticle tracking analysis. (C) Representative transmission electron microscopy showing EV size of a TX Ctrl patient. (D) Multiplex bead‐based flow cytometry analysis was performed by MACsplex exosome capture beads containing a cocktail of 39 different markers. Experiments were performed with EV from four patients for TX Ctrl, AAMR, and CAMR groups, graph indicated values after normalization of the raw median fluorescence intensity (MFI). Raw MFI was subtracted with the MFI of the negative/blank control used in the same run experiment to avoid nonspecific signals. Values below the corresponding control were indicated as negative and were not showed. (TX CTRL, AAMR, and CAMR n = 4, data are expressed as mean ± SD; *p value < .05, Kruskal–Wallis test.) [Color figure can be viewed at wileyonlinelibrary.com]
FIGURE 2
FIGURE 2
AMR‐derived EV induced cellular senescence in RPTEC culture. (A) RPTEC were plated in 96‐well plate, treated with EV purified from plasma of AMR patients (5e+4 EV/cells target for 24 h) and MTT assay was performed. Untreated cells (indicated as basal), cell exposed to healthy EV and to TX Ctrl patients were used as controls. H2O2 (0.5 mM) was used as positive control for cell viability reduction. Data represent the mean ± SD; n = 3, *p < .05, **p < .01, one‐way ANOVA nonparametric test. (B) SA‐β Gal staining in RPTEC treated with EV purified from AMR patients plasma in early passage RPTEC (5e+4 EV/cells target for 24 h). Increased SA‐β‐Gal+ cells were observed after AAMR and CAMR EV exposition. Compared with untreated cells and to healthy EV and TX Ctrl EV exposed cells, AAMR, and CAMR EV‐treated cells were positive to SA‐β Gal, appeared enlarged, with formation of larger and polynucleated cells (arrows and boxes). H2O2 (0.5–1 mM) exposed cells were used as positive control of senescence (not showed). Scale bar: 200 μm. The graph shows the quantification of SA‐β‐Gal+ cells. The ratio of cells positive for SA‐β‐gal activity was calculated in five not overlapping fields per condition (six‐well plate). Data are shown as mean ± SD of three independent experiments and the medians were analyzed by Kruskal–Wallis test (p < .05 between all groups) with an option for multiple comparisons (#p < .01 vs. untreated cells, *p < .05 vs. TX Ctrl). (C) Gene expression of p21 waf1/cip1 (CDKN1A), (D) KL and IL‐6 evaluated by qPCR in RPTEC exposed to EV for 24 h (5e+4 EV/cells target). Data were normalized to β‐actin housekeeping gene. Data are shown as mean ± SD of three independent experiments and the medians were analyzed by Mann–Whitney U test. *p < .05, **p < .01. H2O2 at 0.3–0.5 mM exposed cells were used as positive control of senescence.
FIGURE 3
FIGURE 3
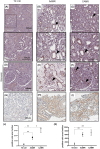
Increased p16INK4a expression in renal biopsies of AMR patients. Immunohistochemical stainings showing the p16INK4a expression in kidney biopsies at tubular (A–C) and glomerular level (D–F) and IL‐6 (G–I). IHC was performed on paraffin kidney sections. Arrows indicate positive tubular staining. Fields indicated by arrows in A–C, field indicated is enlarged at the bottom. Tubular and glomerular p16 expression in AAMR (B, E) and in CAMR (C, F) was increased compared with TX Ctrl biopsies (A, D). Scale bar as indicated (100 μm). (J) Graphical representation of p16INK4a and IL‐6 (K) expression level reported as the ratio of no. positive cells/500 μm2 in the different groups. Data are displayed as median plus interquartile range and were analyzed by Kruskal–Wallis test with an option for multiple comparison (Tukey’s multiple comparisons test) (n = 8,*p < .05, **p < .01).
FIGURE 4
FIGURE 4
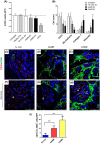
AMR patients‐derived EV induced EndMT in vitro, in vivo EndMT was observed in renal biopsies of the same patients. Primary endothelial cells (HUVEC) were incubated with healthy volunteers EV, control transplant patients EV, and AMR‐derived EV (5e+4 EV/cells target for 24 and 48 h). (A) MTT assay performed on HUVEC plated in 96‐well plate, treated with EV purified from plasma of AMR patients for 24 h. Untreated cells (indicated as basal), cell exposed to healthy control EV and H2O2 (up to 0.5 mM) were used as controls. Data represent the mean ± SD; n = 3. (B) Flow cytometry analysis showed a significant reduction of constitutive endothelial markers CD31 and VE‐cadherin and an increased expression of dysfunctional fibroblast‐like markers collagen I and vimentin after 48 h of treatment (representative plot are shown in Figure S2). Data are shown as median± interquartile range, *p value p < .05, **p value p < .01, Mann–Whitney test). (C–H) Analysis of EndMT on renal biopsies. Endothelial cells were double‐stained for the constitutive CD31 (green) and myofibroblast‐like α‐SMA marker (red) to investigate the occurrence of EndMT. (C) In control transplant biopsies, α‐SMA expression was limited to the wall of renal arteries and αSMA+ glomerular cells were barely detectable. (D) The tubule interstitium of acute and (E) chronic AMR biopsies showed an increased α‐SMA expression as indicated by white arrows. (H) In addition, strong and diffuse expression of α‐SMA was observed also in the glomerular capillaries of the biopsies with chronic AMR, lesser than in acute AMR (G). The fluorescent dye To‐pro 3 was used to counterstain nuclei (blue). (F–H) Glomeruli. (I) Quantitative analyses of CD31‐SMA double‐positive/high‐power (630×) fields (HPF) cells (were expressed as median ± interquartile range [IQR], n = 5). (p value as indicated, Mann–Whitney test). Magnification 630×
FIGURE 5
FIGURE 5
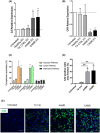
Complement activation in tubular and endothelial cells culture after AMR‐derived EV exposition. (A, B) C3 and CFH gene transcript level in RPTEC after AMR‐derived EV stimulation (5e+4 EV/cells target for 24 h). Gene expression was assessed by qPCR and compared with normal untreated RPTEC cultured for 24 h. LPS, IFNγ and H2O2 exposed cells were used as positive control of C3 complement increase (not showed). Gene expression levels were normalized to the housekeeping gene β‐actin. Data are displayed as means ± SD, n = 5, one‐way ANOVA, *p < .05. (C) Primary human endothelial cells were cultured in serum‐free media, then exposed to EV 5e+4 EV/cells target for 24 h. (C) Complement activation in cells culture, supernatants were assessed by complement functional assay with a protocol adapted for cell culture, data are displayed as mean ± SD of percentage of complement activation compared with a positive control, medians were compared with a Mann–Whitney U test **p < .01, n = 5 per group. (D, E) Immunofluorescence analysis for C4d complement fragment. Endothelial cell grown in serum‐free conditions were exposed to AMR‐derived EV for 24 h (5e+4 EV/cells target) then labeled by immunofluorescence for C4d. Scale bar: 50 μm. Magnification, 630×. (D) Data are shown as mean ± SD and were analyzed by one‐way ANOVA test (n = 3 per group), *p < .01 versus TX Ctrl group, §p < .001 versus untreated cells.
FIGURE 6
FIGURE 6
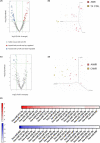
Analysis of miRNAs differentially expressed in plasma EV from patients with AMR compared to TX Control patients. (A) Volcano plot shows the relationship between fold change and statistical significance. The red and blue points in the plot represent the differentially expressed mRNAs with statistical significance. 34 miRNAs were upregulated (red points) and 42 miRNA were downregulated (blue points) in AMR patients compared with TX Control with FDR <0.05 and Fold change >2. (B) Principal component analysis (PCA) built on all expressed miRNAs among the three groups. Principal component analysis showing 76 miRNAs able to distinguish AMR‐derived EVs from EV derived from TX Ctrl. Analysis of miRNAs differentially expressed in plasma EV from patients with AAMR compared with CAMR. (C) Volcano plot showing 1 miRNA upregulated and 8 miRNAs downregulated in EV from AAMR compared with CAMR. (D) Principal component analysis showing the 9 miRNAs able to distinguish AAMR‐derived MVs from EV derived from CAMR. (E) The heatmap of the differentially expressed miRNAs in the AMR group (AAMR and CAMR) versus TX Ctrl group displayed according to fold‐changes value. The red indicated higher miRNA expression level in AMR‐derived EV compared with TX Ctrl, whereas the blue showed lower miRNA expression level. Fold change and p value details are indicated in Table 2 (n = 8 for each group).
FIGURE 7
FIGURE 7
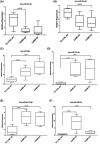
miRNA validation by qPCR. miRNA validation in EV from AAMR, CAMR, and TX Ctrl patients. Box plots representing the miRNAs that were upregulated or downregulated in AAMR and CAMR compared with TX CTRL group. Center lines show the medians; box limits indicate the 25th and 75th percentiles as determined by R software, whiskers extend from each quartile to the minimum or maximum. One‐way ANOVA, nonparametric test. Tukey test was used to correct for multiple comparisons using statistical hypothesis testing (n = 8 for each group).
FIGURE 8
FIGURE 8
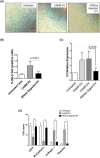
RNA digestion of AMR‐derived EV is sufficient to inhibit tubular senescence, C3 gene transcript increase and EndMT. A pull of CAMR‐derived EV was treated with RNase A at 1U/ml and saponin. Pretreatment with RNase A significantly reduced CAMR EV‐induced senescence, as observed by SA‐β GAL staining, reduced the C3 gene increased level and reverted EndMT. (A) SA‐β Gal staining in RPTEC treated with a pull of EV purified from CAMR patients plasma (5e+4 EV/cells target for 24 h). Increased SA‐β‐gal+ cells were observed after CAMR EV treatment. Compared with CAMR‐derived EV, the RNase‐digested EV‐treated cells were barely positive to SA‐β Gal. H2O2 (0.5–1 mM )‐exposed cells were used as positive control of senescence (not shown). Scale bar: 200 μm. (B) Quantification of SA‐β‐Gal+ cells. The ratio of cells positive for SA‐β‐gal activity was calculated by in five not overlapping fields per condition (six‐well plate). The results are presented as the mean ± SD of three independent experiments. p value as indicated. (C) C3 gene transcript level in RPTEC after CAMR‐derived EV untreated/treated with RNase (5e+4 EV/cells target for 24 h). Gene expression was assessed by qPCR and compared with normal untreated RPTEC cultured for 24 h. Gene expression levels were normalized to the housekeeping gene β‐actin. Data are shown as means ± SD, n = 3, p value as indicated, one‐way ANOVA nonparametric. (D) Flow cytometry analysis showed a significant abrogation of EndMT as observed by conserved expression of constitutive endothelial markers CD31 and VE‐cadherin and the lack of increased expression of dysfunctional fibroblast‐like markers collagen I and vimentin after 48 h of treatment. Results are means ± SD, n = 3, *p < .05.

Comment in

Similar articles

Cited by

References

    1. Montgomery RA, Loupy A, Segev DL. Antibody‐mediated rejection: new approaches in prevention and management. Am J Transplant. 2018;18(Suppl 3):3‐17. doi:10.1111/ajt.14584 - DOI - PubMed
    1. Sis B, Jhangri GS, Bunnag S, Allanach K, Kaplan B, Halloran PF. Endothelial gene expression in kidney transplants with alloantibody indicates antibody‐mediated damage despite lack of C4d staining. Am J Transplant. 2009;9(10):2312‐2323. doi:10.1111/j.1600-6143.2009.02761.x - DOI - PubMed
    1. Schinstock CA, Cosio F, Cheungpasitporn W, et al. The value of protocol biopsies to identify patients with de novo donor‐specific antibody at high risk for allograft loss. Am J Transplant. 2017;17(6):1574‐1584. doi:10.1111/ajt.14161 - DOI - PMC - PubMed
    1. Théry C, Witwer KW, Aikawa E, et al. Minimal information for studies of extracellular vesicles 2018 (MISEV2018): a position statement of the International Society for Extracellular Vesicles and update of the MISEV2014 guidelines. J Extracell Vesicles. 2018;7(1):1535750. doi:10.1080/20013078.2018.1535750 - DOI - PMC - PubMed
    1. Lu Y, Liu D, Feng Q, Liu Z. Diabetic nephropathy: perspective on extracellular vesicles. Front Immunol. 2020;11:943. doi:10.3389/fimmu.2020.00943 - DOI - PMC - PubMed

Publication types

MeSH terms