

Exposure and respiratory infection risk via the short-range airborne route
- PMID: 35574565
- PMCID: PMC9085449
- DOI: 10.1016/j.buildenv.2022.109166
Exposure and respiratory infection risk via the short-range airborne route
Abstract
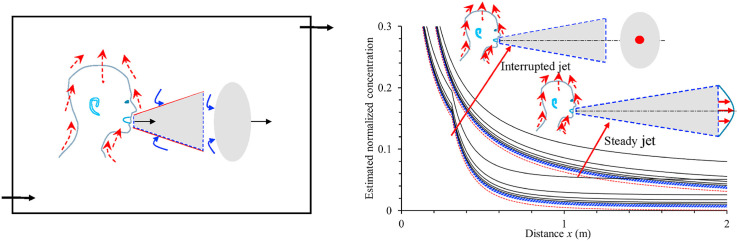
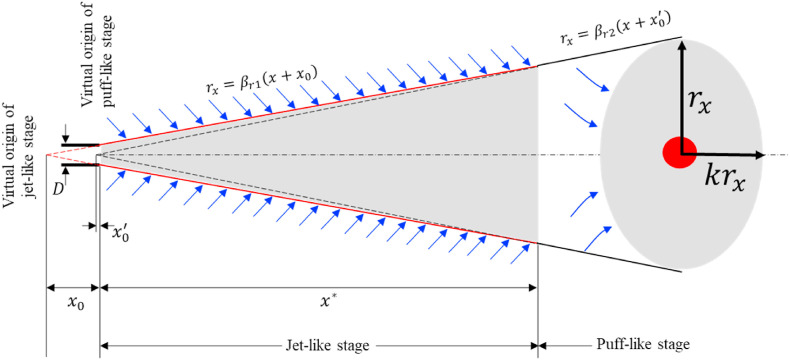
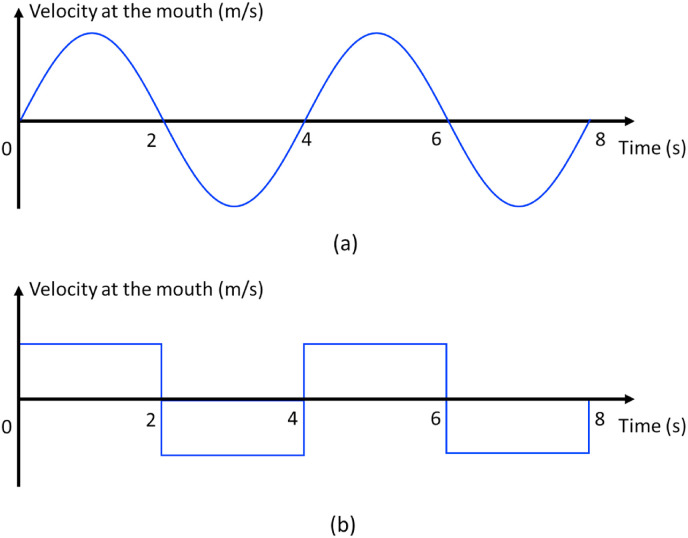
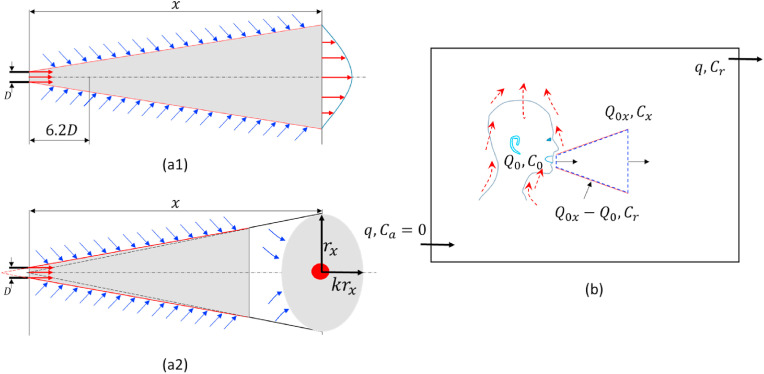
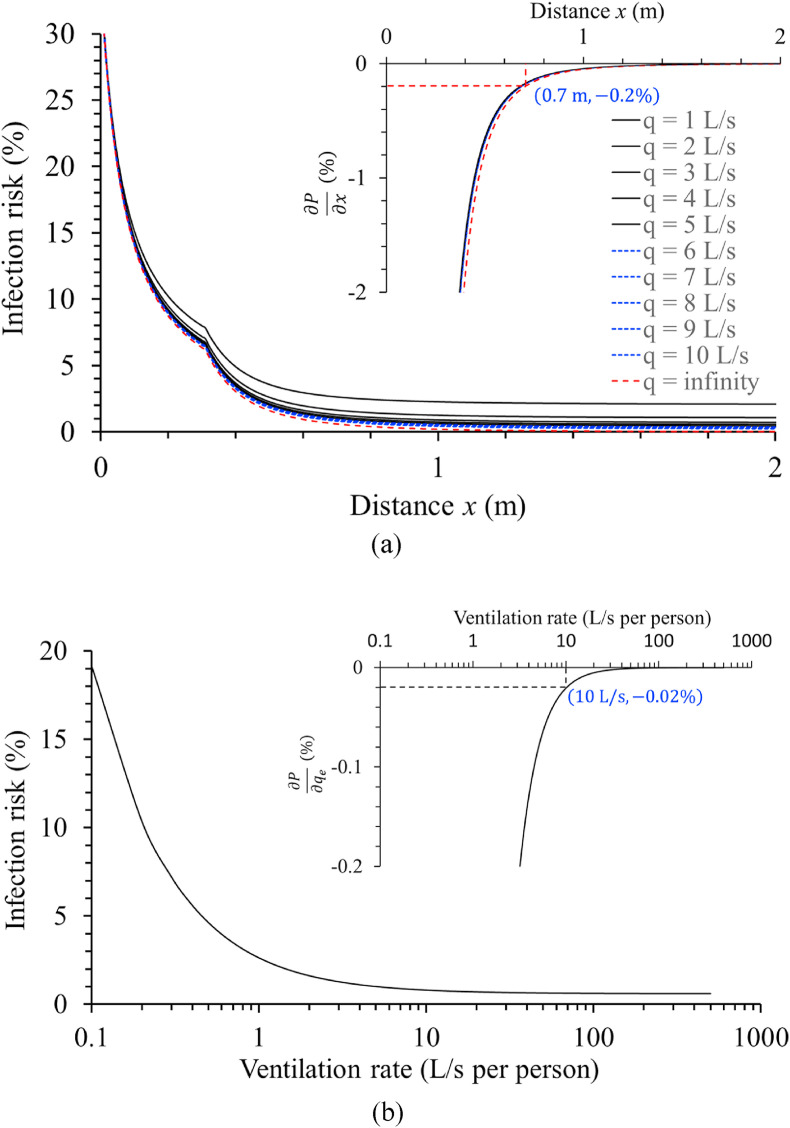
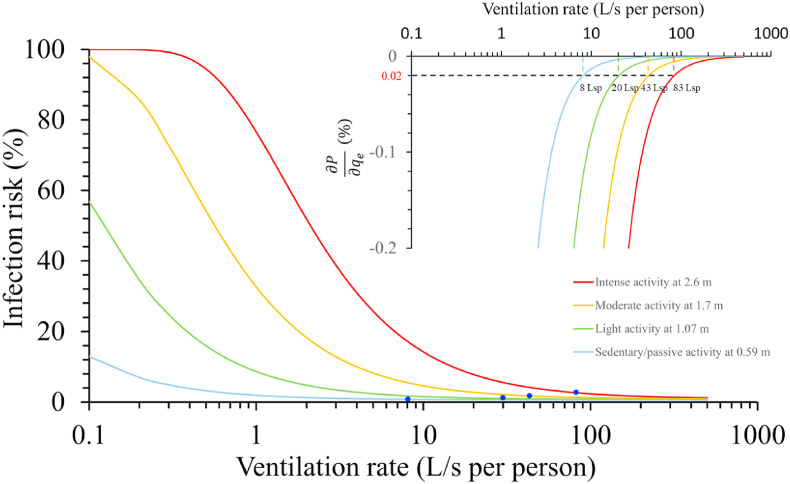
Leading health authorities have suggested short-range airborne transmission as a major route of severe acute respiratory syndrome coronavirus-2 (SARS-CoV-2). However, there is no simple method to assess the short-range airborne infection risk or identify its governing parameters. We proposed a short-range airborne infection risk assessment model based on the continuum model and two-stage jet model. The effects of ventilation, physical distance and activity intensity on the short-range airborne exposure were studied systematically. The results suggested that increasing physical distance and ventilation reduced short-range airborne exposure and infection risk. However, a diminishing return phenomenon was observed when the ventilation rate or physical distance was beyond a certain threshold. When the infectious quantum concentration was less than 1 quantum/L at the mouth, our newly defined threshold distance and threshold ventilation rate were independent of quantum concentration. We estimated threshold distances of 0.59, 1.1, 1.7 and 2.6 m for sedentary/passive, light, moderate and intense activities, respectively. At these distances, the threshold ventilation was estimated to be 8, 20, 43, and 83 L/s per person, respectively. The findings show that both physical distancing and adequate ventilation are essential for minimising infection risk, especially in high-intensity activity or densely populated spaces.
Keywords: COVID-19; Interrupted jet; Physical distance; Short-range airborne transmission; Ventilation rate; Wells-riley model.
© 2022 Elsevier Ltd. All rights reserved.
Conflict of interest statement
The authors declare that they have no known competing financial interests or personal relationships that could have appeared to influence the work reported in this paper.
Figures
Similar articles
-
Poor ventilation worsens short-range airborne transmission of respiratory infection.Indoor Air. 2022 Jan;32(1):e12946. doi: 10.1111/ina.12946. Epub 2021 Oct 27. Indoor Air. 2022. PMID: 34704625 Free PMC article.
-
Extended short-range airborne transmission of respiratory infections.J Hazard Mater. 2022 Jan 15;422:126837. doi: 10.1016/j.jhazmat.2021.126837. Epub 2021 Aug 6. J Hazard Mater. 2022. PMID: 34399209 Free PMC article.
-
A spatiotemporally resolved infection risk model for airborne transmission of COVID-19 variants in indoor spaces.Sci Total Environ. 2022 Mar 15;812:152592. doi: 10.1016/j.scitotenv.2021.152592. Epub 2021 Dec 23. Sci Total Environ. 2022. PMID: 34954184 Free PMC article.
-
Airborne transmission of COVID-19 virus in enclosed spaces: An overview of research methods.Indoor Air. 2022 Jun;32(6):e13056. doi: 10.1111/ina.13056. Indoor Air. 2022. PMID: 35762235 Free PMC article. Review.
-
Modes of Transmission of Severe Acute Respiratory Syndrome-Coronavirus-2 (SARS-CoV-2) and Factors Influencing on the Airborne Transmission: A Review.Int J Environ Res Public Health. 2021 Jan 6;18(2):395. doi: 10.3390/ijerph18020395. Int J Environ Res Public Health. 2021. PMID: 33419142 Free PMC article. Review.
Cited by
-
Safe CO2 threshold limits for indoor long-range airborne transmission control of COVID-19.Build Environ. 2023 Apr 15;234:109967. doi: 10.1016/j.buildenv.2022.109967. Epub 2022 Dec 30. Build Environ. 2023. PMID: 36597420 Free PMC article.
-
Link between SARS-CoV-2 emissions and airborne concentrations: Closing the gap in understanding.J Hazard Mater. 2022 Apr 15;428:128279. doi: 10.1016/j.jhazmat.2022.128279. Epub 2022 Jan 15. J Hazard Mater. 2022. PMID: 35063838 Free PMC article.
-
Electrospun nanofibers for medical face mask with protection capabilities against viruses: State of the art and perspective for industrial scale-up.Appl Mater Today. 2023 Jun;32:101833. doi: 10.1016/j.apmt.2023.101833. Epub 2023 May 2. Appl Mater Today. 2023. PMID: 37152683 Free PMC article. Review.
-
Role of face masks and ventilation rates in mitigating respiratory disease transmission in ICU.Sci Rep. 2023 Jul 10;13(1):11124. doi: 10.1038/s41598-023-38031-x. Sci Rep. 2023. PMID: 37429928 Free PMC article.
-
Transmission risk of viruses in large mucosalivary droplets on the surface of objects: A time-based analysis.Infect Dis Now. 2021 May;51(3):219-227. doi: 10.1016/j.idnow.2020.11.001. Epub 2020 Dec 30. Infect Dis Now. 2021. PMID: 33934808 Free PMC article. Review.
References
-
- World Health Organization (WHO) World Health Organization; 2020. Transmission of SARS-CoV-2: Implications for Infection Prevention Precautions: Scientific Brief, 09 July 2020 (No. WHO/2019-nCoV/Sci_Brief/Transmission_modes/2020.3)
-
- World Health Organization (WHO) Coronavirus disease (COVID-19): how is it transmitted? 2021. https://www.who.int/news-room/q-a-detail/coronavirus-disease-covid-19-ho... Updated on 30 April 2021.
-
- Riley E.C., Murphy G., Riley R.L. Airborne spread of measles in a suburban elementary school. Am. J. Epidemiol. 1978;107(5):421–432. - PubMed
-
- Wells W.F. Harvard University Press; Cambridge, MA: 1955. Airborne Contagion and Air Hygiene. An Ecological Study of Droplet Infections.
LinkOut - more resources
Full Text Sources
Miscellaneous