. 2022 Apr;6(4):351-371.
doi: 10.1038/s41551-022-00882-6. Epub 2022 Apr 27.

A multi-organ chip with matured tissue niches linked by vascular flow

Affiliations

A multi-organ chip with matured tissue niches linked by vascular flow

Kacey Ronaldson-Bouchard et al. Nat Biomed Eng. 2022 Apr.

Abstract

Engineered tissues can be used to model human pathophysiology and test the efficacy and safety of drugs. Yet, to model whole-body physiology and systemic diseases, engineered tissues with preserved phenotypes need to physiologically communicate. Here we report the development and applicability of a tissue-chip system in which matured human heart, liver, bone and skin tissue niches are linked by recirculating vascular flow to allow for the recapitulation of interdependent organ functions. Each tissue is cultured in its own optimized environment and is separated from the common vascular flow by a selectively permeable endothelial barrier. The interlinked tissues maintained their molecular, structural and functional phenotypes over 4 weeks of culture, recapitulated the pharmacokinetic and pharmacodynamic profiles of doxorubicin in humans, allowed for the identification of early miRNA biomarkers of cardiotoxicity, and increased the predictive values of clinically observed miRNA responses relative to tissues cultured in isolation and to fluidically interlinked tissues in the absence of endothelial barriers. Vascularly linked and phenotypically stable matured human tissues may facilitate the clinical applicability of tissue chips.


Figures

Extended Data Figure 1 |
Extended Data Figure 1 |. Platform configurability and modularity.
a, Photograph of the assembled platform. b, Top view of the platform including each compartment chamber and reservoir for circulating media. c, Bottom view of the platform. d, Configurability of the platform can be established through connecting reactors in series for scaling of engineered organs. e, Alternative platform design for single-organ culture with perfusion and vascular barrier. f, Alternative platform design for dual-organ culture with perfusion and vascular barrier. g, Platform with tubing attached to a peristaltic pump during integrated culture. h, Computational fluidic model of shear stress during perfusion with the vascular barrier, at a flow rate of 1.3 mL/min to yield a shear stress of 1.88 dyn/cm2 at the vascular barrier interface.
Extended Data Figure 2 |
Extended Data Figure 2 |. Platform design details for integration of engineered tissues.
a, Images and dimensions of the engineered transwell insert and its location within the platform. b, Top view of the platform reservoir to detail routing of fluid from the channel into the reservoir and subsequent pump driven routing into the tubing via the elbow connector. c, Schematic side view of the platform with measurements. d, Schematic images detailing fluidic routing of vascular media via the designed channel entry and exit ports. e, Platform details.
Extended Data Figure 3 |
Extended Data Figure 3 |. Characterization of tissue specific maturation.
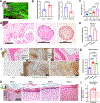
a-c, Electromechanically matured cardiac tissues show aligned alpha actinin expression (a) functional improvements in maximum capture rate and excitation threshold (b) (n=8–9 biological replicates), and increased force responses when exposed to increasing calcium concentrations (c) (n=9 biological replicates). d-e, Liver tissues are matured via co-culture of cells in 3D aggregated as detailed by immunohistochemical staining and increased albumin secretion (e) (n=6 biological replicates). f, Immunohistochemical staining of engineered bone slices stain positive for osteocalcin, TRAP and bone sialoprotein. g, micro-computed tomography imaging of bone scaffolds over time details bone remodeling during the osteoblastic and osteolytic phases of induced bone maturation (n=13 biological replicates). h, Immunohistochemical staining of engineered skin slices detail the formation of the epidermis and dermis over 4 weeks of maturation. i, TEER values detail the barrier function of the engineered skin, with reported values detailed by the red shaded region7 (n=15 biological replicates). Data is shown as mean ± SD and statistics determined by unpaired t-test (b, c, e) or one-way ANOVA (g, i).
Extended Data Figure 4 |
Extended Data Figure 4 |. Establishment of mature, selectively permeable vascular barrier.
a-b, Immunofluorescence imaging of vascular barriers and (b)FITC-Dextran transport through vascular barriers cultured on various transwell pore sizes (n=7–10 biological replicates). c-d, (c) Immunofluorescence imaging of vascular barriers and (d) FITC-Dextran transport through vascular barriers cultured under different shear stress conditions (n=7–8 biological replicates). e, Barrier function demonstrated by tracking tagged dextran molecules of different size (n=3 biological replicates). Data is shown as mean ± SD and statistics determined by two-way or mixed ANOVA.
Extended Data Figure 5 |
Extended Data Figure 5 |. Immune cell isolation, maturation, and characterization.
a, Initial cell population was made up of >98% CD14+, ITGAM+ monocytes. b, Brightfield image detailing monocyte adherence to barrier surface within platform. c, Flow cytometry characterization of monocyte viability after 3 days of culture (n=3–4 biological replicates). d, Monocyte specification and differentiation over two weeks of culture (n=3 biological replicates). Data is shown as mean ± SD and statistics determined by two-way ANOVA.
Extended Data Figure 6 |
Extended Data Figure 6 |. Immune function over four-week culture.
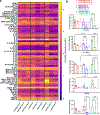
a-b, Heatmap of all measured cytokines (a) and individual cytokine expression for select cytokines (b) over 28 days of culture in the different platform configurations (InterOrgan n=5 biological replicates, Mixed and Isolated n=3 biological replicates). Data is shown as mean ± SD and statistics determined by one-way ANOVA.
Extended Data Figure 7 |
Extended Data Figure 7 |. Proteomic breakdown of bone, liver, and skin tissues studied over four weeks in (i) InterOrgan multi-tissue platform, (ii) in the Mixed media approach, and (iii) in Isolation.
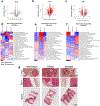
a-c, Proteomic breakdown of engineered bone (6,000+ unique proteins; a), liver (2,000+ proteins; b), and skin (2,000+ proteins; c) studied over 28 days in the (i) integrated InterOrgan multi-tissue platform, (ii) platform with mixed media, and (iii) tissues cultured in isolation. Comparison of integrated versus mixed conditions via differential protein abundances is represented by Volcano plots. d-f, PGSEA plots of the top 30 GO Biological Process pathways, with red indicating activated pathways and blue indicating suppressed pathways for bone (d), liver (e), and skin (f). g, Immunohistochemical staining for picrosirius red details collagen within liver, skin and bone tissues after 28 days.
Extended Data Figure 8 |
Extended Data Figure 8 |. Proteomic breakdown of engineered cardiac tissues studied over four weeks in (i) InterOrgan multi-tissue platform, (ii) in the Mixed media approach, and (iii) in Isolation.
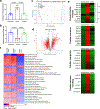
a, excitation threshold and b, maximum capture rate of cardiac tissues for each experimental condition (i-iii) (InterOrgan and Mixed n=6 biological replicates, Isolated n=3 biological replicates). c, PCA clustering of each experimental condition (i-iii). d, Comparison of integrated versus mixed conditions via differential protein abundances. e, Proteins important to cardiac tissue function, structure, energetics, and calcium handling. f, PGSEA pathway analysis showing the top 30 GO Biological Process pathways related to disease and function in integrated vs. mixed conditions, with red indicating activated and blue indicating suppressed pathways.
Extended Data Figure 9 |
Extended Data Figure 9 |. Development of a multi-compartment computational model of the multi-tissue platform.
a, Schematic of the entire mechanistic multi-compartment model. All tissue tanks have a similar configuration that is composed of a cylindrical tank divided in 3 sub-compartments (TT, MT, and BT), an endothelial membrane with 3 layers (TM, MM, and BM), a fluidic inflow segment (IFC), and a fluidic perfusion segment (FC). All the individual compartments were represented by species mass balance equations, calculated using drug flux (J) and volumetric medium flow (Qf). b, Schematic of the liver tissue chamber. c, Schematic of the heart tissue chamber. d, Schematic of the bone tissue chamber. e, Schematic of the skin tissue chamber. f, Schematic of the reservoir and tubing.
Extended Data Figure 10 |
Extended Data Figure 10 |. Comparison of the InterOrgan and Mixed computational PK models.
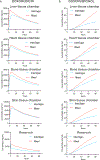
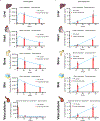
a-b, Doxorubicin (a) and doxorubicinol (b) levels over time within all tissue chambers and in the reservoir predicted by the computational PK model for the InterOrgan (blue line) and the Mixed platform (red bat).
Figure 1 |
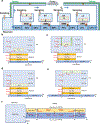
Figure 1 |. Integrated multi-organ chip enables maintenance of a tissue-specific niche while allowing for organ cross-talk.
a, Schematic detailing a side view of the multi-tissue chip where integration is enabled by a vascular barrier beneath each tissue which creates a tissue-specific niche in the above chambers for each engineered organ, while enabling cross-talk between organs within the system through the vascular chamber. Immunostain demonstrating expression of actin alpha (red) and VE-cadherin (green) by the endothelial barrier. Samples were counterstained with DAPI (blue). Scale bar, 50 μm. b, Photographs detailing that the engineered chip is easily configurable, allowing for a “plug-and-play” system for individual organ chambers and a vascular flow channel beneath each organ. Engineered tissues are shown before and after being placed into the engineered tissue chip, where the vascular barrier enables maintenance of each specific media, as detailed by the differences in media color within the photograph. c, Schematics of the experimental design for evaluating of tissue chip’s long term culture utility to validate the importance of the vascular barrier within the InterOrgan tissue chip, as compared to the lack of vascular barrier in the Mixed tissue chip, and benchmarked against the tissues cultured for the same length of time in isolation. d, Schematics of the experimental designs for evaluating tissue chip utility for drug screening of doxorubicin, where the drug responses of the engineered tissues cultured in the InterOrgan and Mixed tissue chips were compared directly, for cases where all four tissues or single tissues were cultured in either tissue chip.
Figure 2 |
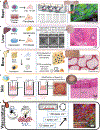
Figure 2 |. Formation, maturation, and characterization of engineered human tissues.
Schematics detailing initial tissue formation (cell types and scaffold or extracellular matrix), tissue-specific maturation protocols, and representative tissue photographs and immunofluorescence or immunohistochemical images for heart (green) (a), liver (b), bone (c), skin (d), and vasculature (e), after the maturation protocol is completed.
Figure 3 |
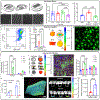
Figure 3 |. InterOrgan communication via vascularized barrier of tissue-specific niches.
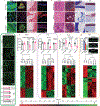
a-c, Characterization of the vascular barrier insert (a) at various pore size (b) as measured by vascular transendothelial electrical resistance (TEER) values (c). (n=7–8 biological replicates) d, TEER measurements as a function of shear stress (n=4 biological replicates). Data is shown as mean ± SD and statistics determined by one-way ANOVA. e, Cardiac tissues contain a majority of GFP+CD63+ cardiomyocytes, as indicated by expression of cardiac troponin (cTnT) and CD63 in quadrant 3 of the flow cytometry scatter plot. f-g, Average expression (f) (n=5 biological replicates) and tissue heat-map expression (g) of GFP+CD63 within all tissues cultured in the InterOrgan tissue chip for 2 weeks. h, Immunofluorescence image of GFP+CD63 expression within the vascular barrier beneath the cardiac tissue after 2 weeks. i-j, Average expression (i) and tissue heat-map expression (j) of labelled monocytes within all tissues cultured in the InterOrgan or Mixed tissue chips for 24 hours (n=3 biological replicates). k, Immunofluorescence image of CD14+ monocytes attached to the vascular barrier beneath the cardiac tissue after 24 hours. Scale bar, 10 μm. l, Cardiac troponin concentration within each tissue chamber 24 hours after cardiac cryoinjury (n=3 biological replicates). m, Monocyte infiltration over time as measured by confocal tracking of labelled monocytes (n=3 biological replicates). n, Immunofluorescence image of CD14+ monocytes (green) attached to a cryoinjured cardiac tissue counterstained with DAPI (blue) after 7 days. Scale bar, 10 μm o-p, Tissue heat-map expression (o) and average expression (p) of labelled monocytes within healthy and cryoinjured cardiac tissues after 7 days (n=4 biological replicates). Data is shown as mean ± SD and statistics determined by unpaired t-test.
Figure 4 |
Figure 4 |. InterOrgan tissue chip demonstrates maintenance of structural, functional, and molecular phenotypes for each engineered organ over 4 weeks following linking of tissues by vascular flow.
a-b, Representative immunofluorescence staining (a) and trichrome histological staining (b) displays morphological differences between groups (Scale bar, 50 μm for heart, liver, and bone; 100 μm for skin). c, Vascular stability is maintained after 4 weeks in culture as shown by VE-Cadherin expression (green). Scale bar, 50 μm. Transendothelial electrical resistance (TEER) measurements of the endothelial barrier (n=3 biological replicates). d-g, Functional (n=6 biological replicates) and overall proteomic comparison of molecular features (n=2–3 biological replicates) for each engineered organ compared in each condition. Immunostains showing the epidermal layer of the skin. Scale bar, 100 μm, Data is shown as mean ± SD and statistics determined by two-way ANOVA.
Figure 5 |
Figure 5 |. Proteomic analysis confirms biological fidelity of InterOrgan tissue chip in comparison to gold standards and adult organs.
a, When comparing all engineered organs within each experimental group, GO analysis identified gene pathways shared amongst the different organs. b, Comparison between published adult data and engineered tissues demonstrates high similarities in the shared expression of genes to native tissue (left); additional comparisons in how the expression level of these shared genes within each experimental group correlates to adult tissue is presented as well (right). c, Within each organ system, top proteins of interest were identified via the Human Protein Atlas and compared to adult tissue. d, As cardiac tissues were of highest biological fidelity, we identified a number of candidate proteins that are often found in off-target tissues, including in development of epithelial, osteochondral, and neural tissues, for example. e, GO analysis identified cardiac-specific, adult-like structural components present in the InterOrgan (dark blue) and Isolated (light blue) groups, but not at all in the Mixed condition (gray).
Figure 6 |
Figure 6 |. Experimental data and PK model of doxorubicin treatment in the InterOrgan tissue chip.
a-b, Doxorubicin (a) and doxorubicinol (b) levels, measured over time by UPLC-MSMS within all tissue chambers and in the reservoir (red bar), compared with prediction of the computational PK model (blue line). Data are mean ± SD.
Figure 7 |
Figure 7 |. PD model of doxorubicin toxicity in the multi-organ tissue chip.
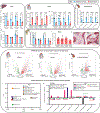
a-b, Liver specific measurements of albumin (a) and urea (b) secretion after 72 hours (n=3–5 biological replicates). c-d, Cardiac specific measurements of cardiac troponin secretion (c) and cardiac contractility (d) after 72 hours (n=3–6 biological replicates). e-g, Bone specific measurements of secreted bone sialoprotein (e), TRAP activity (f), and immunohistochemical images (g) after 72 hours (n=3–6 biological replicates). Scale bar, 100 μm. h, Vascular transendothelial electrical resistance (TEER) values as a measure of barrier integrity after 72 hours (n=3–5 biological replicates). i-k, Volcano plots detailing significant miRNA fold changes after doxorubicin treatment between the InterOrgan and Mixed tissue chips for cardiac tissues cultured in the presence of the other 3 tissues (i), in isolation as single tissues (j), or perfusate from the 4-tissue InterOrgan and Mixed conditions (k). l-m, Principal component analysis of miRNA fold changes (l) and tissue chip specific depiction of miRNA fold changes (m) after doxorubicin exposure for clinically relevant miRNAs (shaded region on graph) identified in doxorubicin induced cardiomyopathy within pediatric patients. Data is shown as mean ± SD and statistics determined by two-way ANOVA.

Comment in

Similar articles

Cited by

References

    1. Di L.et al. A perspective on the prediction of drug pharmacokinetics and disposition in drug research and development. Drug Metab. Dispos 41, 1975–1993 (2013). - PubMed
    1. Mak IW, Evaniew N.& Ghert M.Lost in translation: Animal models and clinical trials in cancer treatment. Am. J. Transl. Res 6, 114–118 (2014). - PMC - PubMed
    1. Tuntland T.et al. Implementation of pharmacokinetic and pharmacodynamic strategies in early research phases of drug discovery and development at Novartis Institute of Biomedical Research. Front. Pharmacol 5, 174 (2014). - PMC - PubMed
    1. Pound P.& Ritskes-Hoitinga M.Is it possible to overcome issues of external validity in preclinical animal research? Why most animal models are bound to fail. J. Transl. Med 16, 304 (2018). - PMC - PubMed
    1. Huh D.et al. Reconstituting organ-level lung functions on a chip. Science 328, 1662–1668 (2010). - PMC - PubMed

Publication types