. 2022 Apr 22;13(1):2206.
doi: 10.1038/s41467-022-29905-1.

A targetable CoQ-FSP1 axis drives ferroptosis- and radiation-resistance in KEAP1 inactive lung cancers

Affiliations

A targetable CoQ-FSP1 axis drives ferroptosis- and radiation-resistance in KEAP1 inactive lung cancers

Pranavi Koppula et al. Nat Commun. .

Abstract

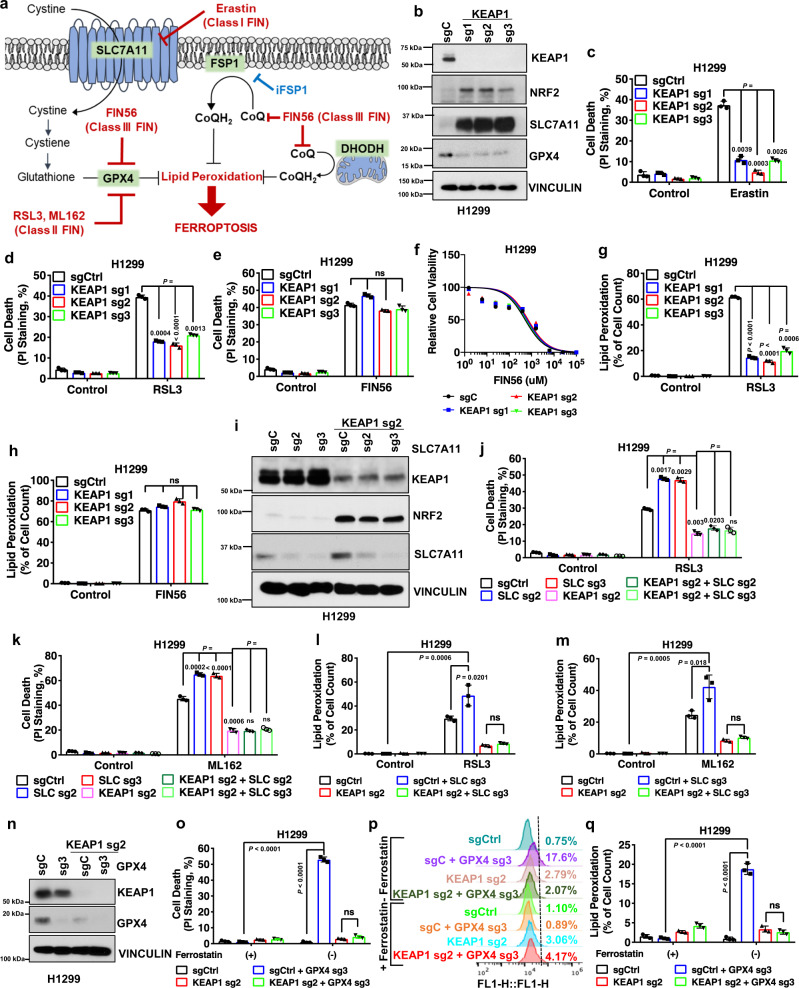
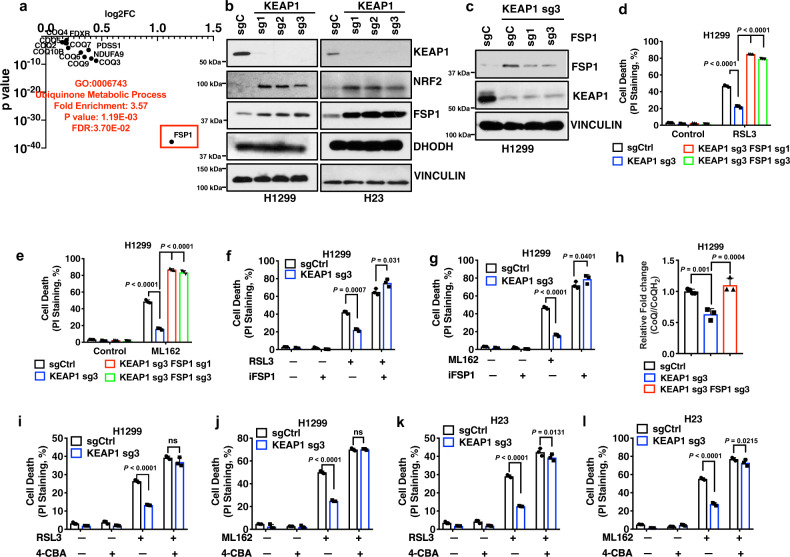
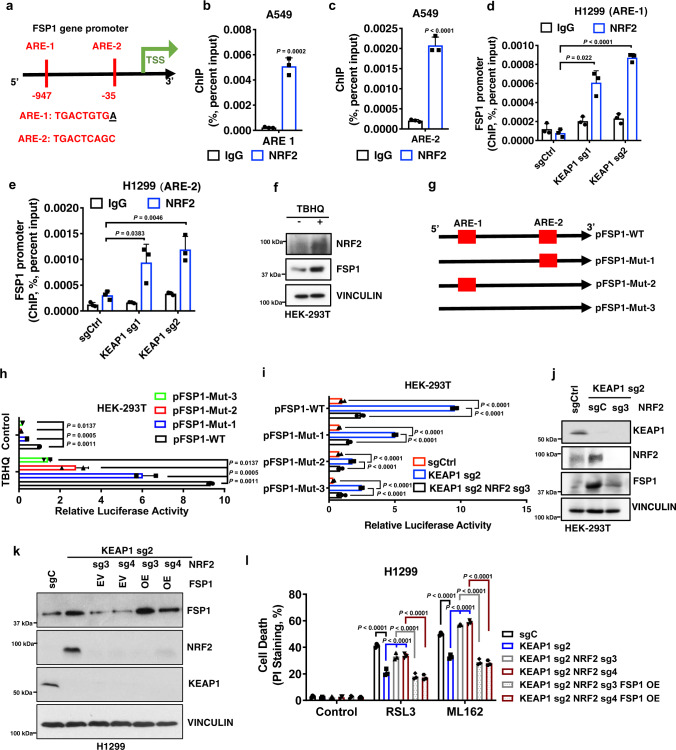
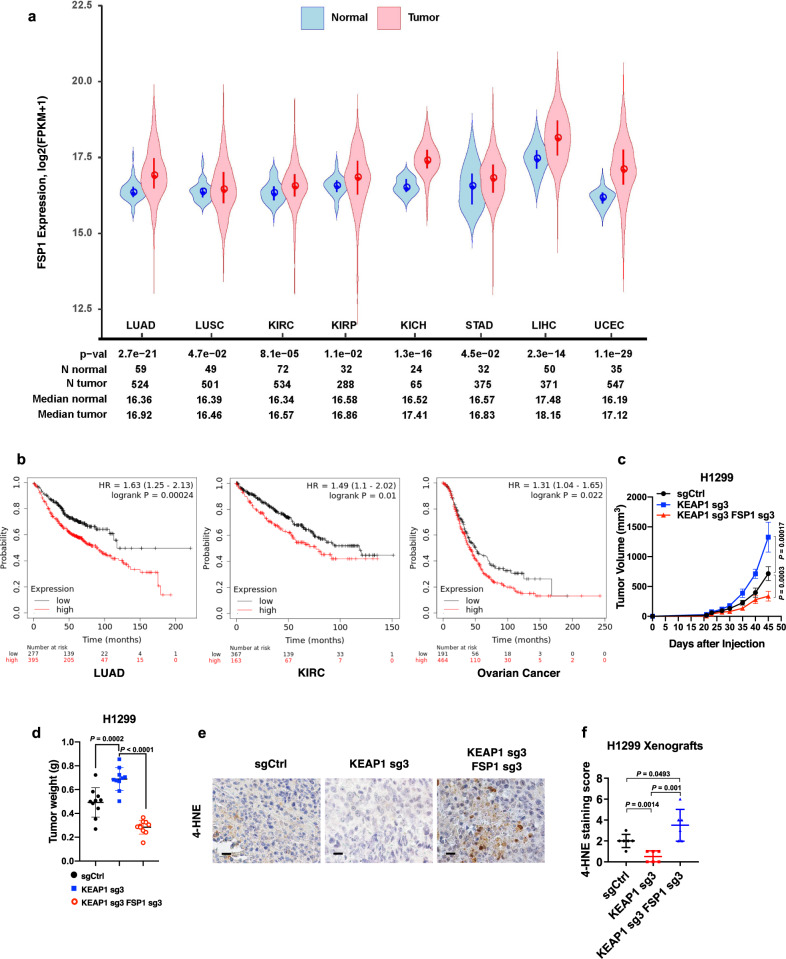
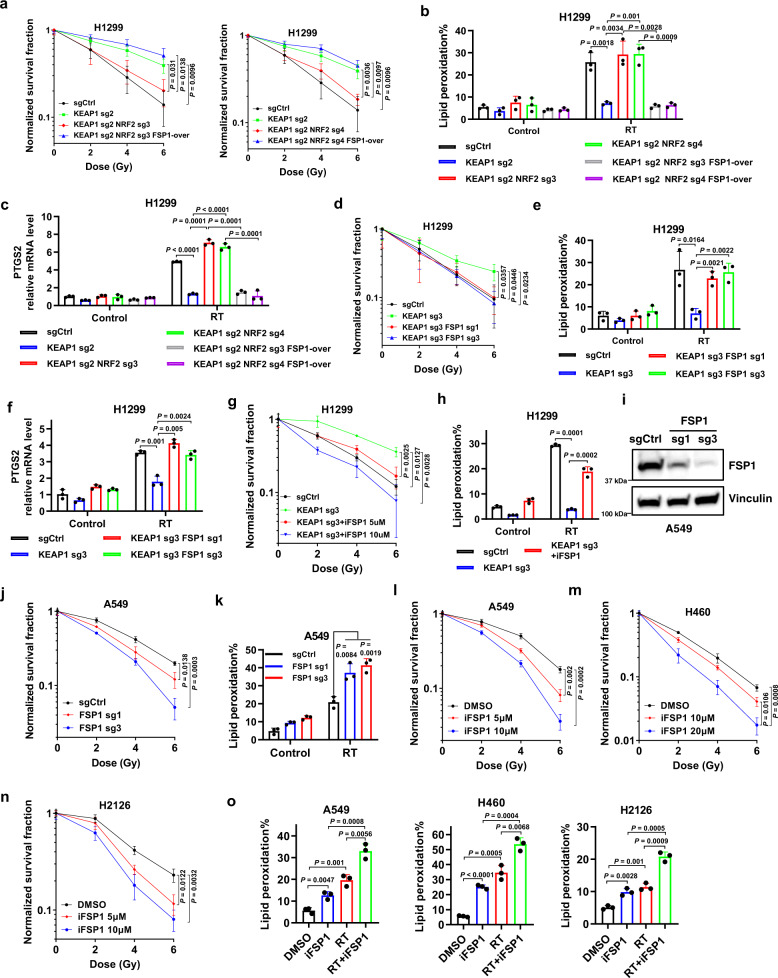
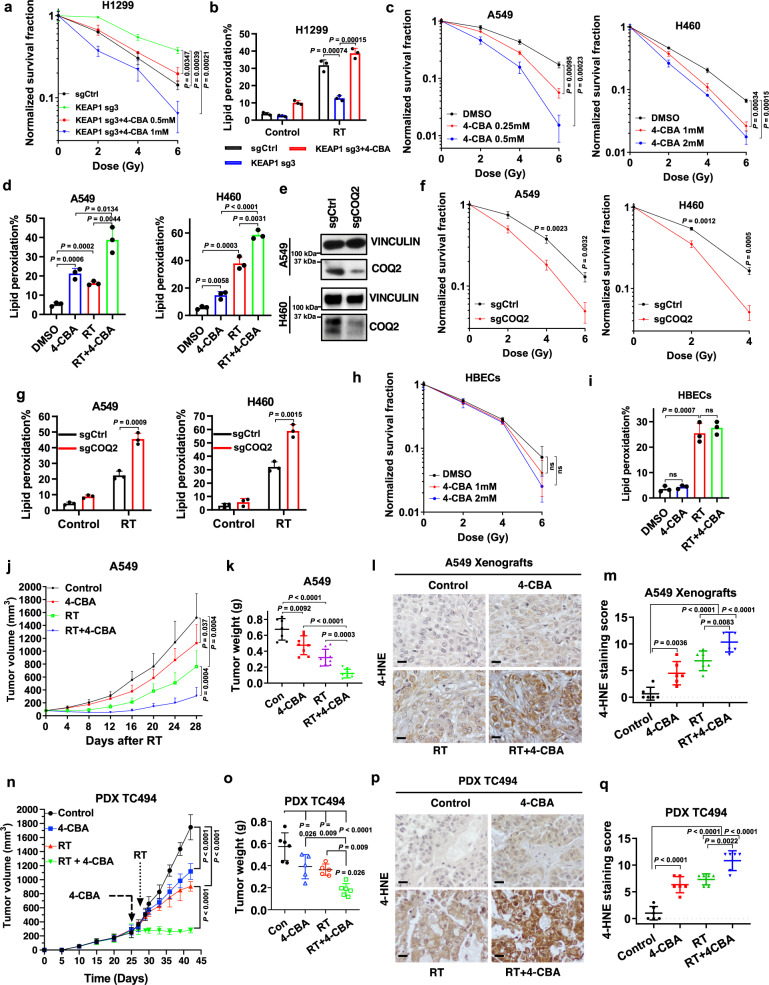
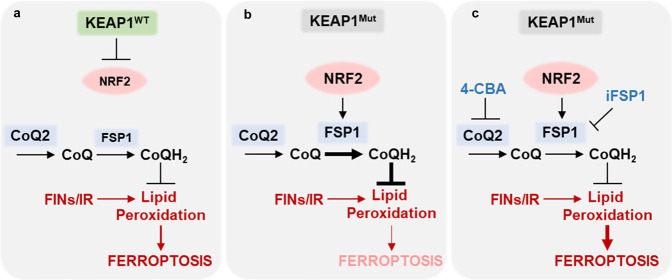
Targeting ferroptosis, a unique cell death modality triggered by unrestricted lipid peroxidation, in cancer therapy is hindered by our incomplete understanding of ferroptosis mechanisms under specific cancer genetic contexts. KEAP1 (kelch-like ECH associated protein 1) is frequently mutated or inactivated in lung cancers, and KEAP1 mutant lung cancers are refractory to most therapies, including radiotherapy. In this study, we identify ferroptosis suppressor protein 1 (FSP1, also known as AIFM2) as a transcriptional target of nuclear factor erythroid 2-related factor 2 (NRF2) and reveal that the ubiquinone (CoQ)-FSP1 axis mediates ferroptosis- and radiation- resistance in KEAP1 deficient lung cancer cells. We further show that pharmacological inhibition of the CoQ-FSP1 axis sensitizes KEAP1 deficient lung cancer cells or patient-derived xenograft tumors to radiation through inducing ferroptosis. Together, our study identifies CoQ-FSP1 as a key downstream effector of KEAP1-NRF2 pathway and as a potential therapeutic target for treating KEAP1 mutant lung cancers.


Conflict of interest statement

K.O. is a full-time employee of the Barer Institute and a former full-time employee of Kadmon Corporation. L.K. and M.V.P. are full-time employees of Kadmon Corporation.

Figures

Fig. 1
Fig. 1. KEAP1 regulates ferroptosis in a SLC7A11/GPX4-independent manner in lung cancer cells.
a Schematic overview of ferroptosis pathways and ferroptosis inducers (FINs) was used in this study. Ferroptosis is induced by lipid peroxide buildup. SLC7A11 imports extracellular cystine. Intracellular cystine then undergoes reduction to generate cysteine, which is the rate-limiting precursor required for glutathione (GSH) synthesis. GSH serves as a cofactor for GPX4 to detoxify lipid peroxides. Ubiquinol (CoQH2) can detoxify lipid peroxyl radicals and can be generated from ubiquinone (CoQ) by FSP1 and DHODH on the plasma membrane and inner mitochondrial membrane, respectively. FINs are classified into various classes depending on their targets of action. Class I FIN used in this study, erastin, targets SLC7A11-mediated cystine import. Class II FINs used in this study, RSL3, and ML162, target GPX4 activity. Class III FIN used in this study, FIN56, depletes both GPX4 protein, and CoQH2. b Protein levels of KEAP1, NRF2, SLC7A11, and GPX4 in H1299 KEAP1 KO cells were determined by western blotting. KEAP1 KO cells were generated by KEAP1 single guide RNA (sgRNA) infection. Vinculin was used as a loading control. sg sgRNA, C control. cf Cell death upon erastin (c), RSL3 (d), and FIN56 (e) treatment in H1299 KEAP1 KO cells was analyzed by PI staining and cell viability for FIN56 was estimated by CCK8 (f). Ctrl control. g, h Lipid peroxidation levels were determined for H1299 cells treated with RSL3 (g) and FIN56 (h). i, Protein levels of KEAP1, NRF2, SLC7A11 in H1299 SLC7A11 KO, KEAP1 KO, and SLC7A11-KEAP1 DKO cells. j, k Cell death was quantified by PI staining for H1299 SLC7A11 KO (SLC sg), KEAP1 KO, and SLC7A11-KEAP1 DKO (KEAP1 sg + SLC sg) cells by RSL3 (j) and ML162 (k). l, m Lipid peroxidation levels were determined for H1299 SLC7A11 KO, KEAP1 KO, and SLC7A11-KEAP1 DKO cells treated with RSL3 (l) and ML162 (m). n Protein levels of KEAP1, NRF2, GPX4 in H1299 GPX4 KO, KEAP1 KO, and GPX4-KEAP1 DKO cells. oq Cell death was quantified by PI staining upon ferrostatin-1 withdrawal for H1299 cells (o) and lipid peroxidation levels were determined (p, q). Data were presented as (if mentioned otherwise) mean ± SD; n = 3. P value was determined by two-way ANOVA; ns not significant. Source data are provided as a Source Data file.
Fig. 2
Fig. 2. KEAP1 regulates ferroptosis sensitivity through FSP1.
a Gene ontology analysis revealed ubiquinol synthesis pathway enrichment in KEAP1 mutant LUAD tumors. b Western blot analysis of KEAP1, NRF2, DHODH, and FSP1 protein levels in H1299 KEAP1 KO and H23 KEAP1 KO cells. c Western blot analysis of KEAP1, NRF2, and FSP1 protein levels in H1299 KEAP1 FSP1 DKO cells. d, e Cell death analysis of H1299 KEAP1 FSP1 DKO cells treated with RSL3 (d) and ML162 (e). f, g Cell death analysis of cotreatment of RSL3 (f) or ML162 (g) with iFSP1 in H1299 KEAP1 KO cells. h Ubiquinone/ubiquinol (CoQ/CoQH2) ratio in H1299 KEAP1 FSP1 DKO cells. il Cell death analysis of H1299 KEAP1 KO cells (i, j) and H23 KEAP1 KO cells (k, l) cotreated with RSL3 + 4-CBA or ML162 + 4-CBA. Data were presented as (if mentioned otherwise) mean ± SD; n = 3. P value was determined by two-way ANOVA; ns not significant. Source data are provided as a Source Data file.
Fig. 3
Fig. 3. KEAP1 regulates FSP1 through NRF2-mediated transcription.
a Schematic showing ARE binding sites on the FSP1 promoter region. b, c ChIP analyses of NRF2 binding on ARE1 (b) and ARE2 (c) in the FSP1 promoter in A549 cells. d, e ChIP analyses of NRF2 binding on ARE1 (d) and ARE2 (e) in the FSP1 promoter in H1299 KEAP1 KO cells. f Protein levels of KEAP1, NRF2, FSP1 in HEK-293T cells treated with TBHQ. gj FSP1 promoter-luciferase activities in response to TBHQ treatment (g, h) or in KEAP1 NRF2 DKO HEK-293T cells (i, j). k Protein levels of KEAP1, NRF2, and FSP1 in KEAP1 NRF2 DKO H1299 cells overexpressing FSP1. EV empty vector, OE overexpression. l PI staining to measure cell death upon RSL3 or ML162 treatment in KEAP1 NRF2 DKO H1299 cells overexpressing FSP1. Data were presented as (if mentioned otherwise) mean ± SD; n = 3. P value was determined by unpaired Student’s t-test (3be) and two-way ANOVA (3h, i, l); ns not significant. Source data are provided as a Source Data file.
Fig. 4
Fig. 4. FSP1 promotes tumorigenesis in KEAP1 deficient lung cancer.
a FSP1 expression in tumor samples of lung adenocarcinoma (LUAD), lung squamous cell carcinoma (LUSC), kidney renal clear cell carcinoma (KIRC), kidney chromophobe (KICH), liver hepatocellular carcinoma (LIHC), uterine corpus endometrial carcinoma (UCEC), and stomach adenocarcinoma (STAD) vs corresponding normal tissues. b Survival analysis of various cancer types with high and low expression of FSP1 in LUAD, KIRC, and ovarian cancer. c, d Measurement of tumor volumes (c) and endpoint tumor weights (d) of H1299 xenograft models with indicated genotypes. Error bars are means ± SD, n = 10 tumors. e, f Immunochemistry staining (e; scale bars, 20 μm) and scoring (f) of 4-HNE in H1299 xenograft tumors with indicated genotypes. Error bars are means ± SD, n = 6 randomly selected magnification fields. Data were presented as (if mentioned otherwise) mean ± SD; n = 3. For d, f, P value was determined by two-tailed unpaired Student’s t-test; ns not significant. Source data are provided as a Source Data file.
Fig. 5
Fig. 5. FSP1 inhibition sensitizes KEAP1 deficient lung cancer cells to radiation by inducing ferroptosis.
a Clonogenic survival curves of the indicated H1299 cells exposed to X-ray irradiation at indicated doses. b, c Lipid peroxidation levels (b) and PTGS2 mRNA levels (c) in the indicated H1299 cells at 24 h after 6 Gy X-ray irradiation. d Clonogenic survival curves of the indicated H1299 cells exposed to X-ray irradiation at indicated doses. e, f lipid peroxidation levels (e) and PTGS2 mRNA levels (f) in the indicated H1299 cells at 24 h after 6 Gy X-ray irradiation. g Clonogenic survival curves of the indicated H1299 cells exposed to X-ray irradiation at indicated doses following pretreatment with the indicated doses of iFSP1 or DMSO for 24 h. h Lipid peroxidation levels in the indicated H1299 cells at 24 h after exposure to 6 Gy X-ray irradiation following pretreatment with iFSP1 or DMSO for 24 h. i Protein levels of FSP1 in A549 FSP1 KO cells. j Clonogenic survival curves of the indicated A549 cells exposed to X-ray irradiation at indicated doses. k Lipid peroxidation levels in the indicated A549 cells at 24 h after exposure to 6 Gy X-ray irradiation. ln Clonogenic survival curves of A549 (l), H460 (m), and H2126 (n) cells exposed to X-ray irradiation at indicated doses following pretreatment with the indicated doses of iFSP1 or DMSO for 24 h. o Lipid peroxidation levels in A549, H460, and H2126 cells at 24 h after exposure to 6 Gy X-ray irradiation following pretreatment with iFSP1 or DMSO for 24 h. Data were presented as (if mentioned otherwise) mean ± SD; n = 3. P value was determined by a two-tailed unpaired Student’s t-test; ns not significant. Source data are provided as a Source Data file.
Fig. 6
Fig. 6. Inhibiting CoQ synthesis reverses radioresistance in KEAP1 deficient or mutant lung cancer cells or tumors.
a Clonogenic survival curves of the indicated H1299 cells exposed to X-ray irradiation at indicated doses following pretreatment with the indicated doses of 4-CBA or DMSO for 24 h. b Lipid peroxidation levels in the indicated H1299 cells at 24 h after exposure to 6 Gy X-ray irradiation following pretreatment with 4-CBA or DMSO for 24 h. c Clonogenic survival curves of A549 and H460 cells exposed to X-ray irradiation at indicated doses following pretreatment with the indicated doses of 4-CBA or DMSO for 24 h. d Lipid peroxidation levels in A549 and H460 cells at 24 h after exposure to 6 Gy X-ray irradiation following pretreatment with 4-CBA or DMSO for 24 h. e Protein levels of COQ2 in A549 and H460 COQ2 KO cells. f Clonogenic survival curve of the indicated A549 and H460 cells exposed to X-ray irradiation at indicated doses. g Lipid peroxidation levels in the indicated A549 or H460 cells at 24 h after exposure to 6 Gy X-ray irradiation. h Clonogenic survival curves of HBECs cells exposed to X-ray irradiation at indicated doses following pretreatment with the indicated doses of 4-CBA or DMSO for 24 h. i Lipid peroxidation levels in HBECs cells at 24 h after exposure to 6 Gy X-ray irradiation following pretreatment with 4-CBA or DMSO for 24 h. j Tumor volumes of A549 xenografts with indicated treatments at different time points (days) following exposure to 10 Gy of X-ray irradiation. Error bars are means ± SD, n = 7 or 8 tumors. k Tumor weights of A549 xenografts in the indicated treatment groups. Error bars are means ± SD, n = 7 or 8 tumors. l, m Representative images (l; scale bars, 20 μm) and scores (m) of IHC staining for 4-HNE in A549 xenograft tumors with indicated treatments. Error bars are means ± SD, n = 6 randomly selected magnification fields. n Tumor volumes of PDX TC494 in the indicated treatment groups at different time points (days) following exposure to 10 Gy of X-ray irradiation. Error bars are means ± SD, n = 5 or 6 tumors. o Tumor weights of PDX TC494 in the indicated treatment groups. Error bars are means ± SD, n = 5 or 6 tumors. p, q Representative images (p; scale bars, 20 μm) and scores (q) of IHC staining for 4-HNE in PDX TC494 tumors with indicated treatments. Error bars are means ± SD, n = 6 randomly selected magnification fields. Data were presented as (if mentioned otherwise) mean ± SD; n = 3. P value was determined by a two-tailed unpaired Student’s t-test; ns not significant. Source data are provided as a Source Data file.
Fig. 7
Fig. 7. The working model depicting that FSP1 as an NRF2 transcriptional target is governed by the KEAP1-NRF2 pathway (a, b) and that a targetable CoQ-FSP1 axis drives ferroptosis- and radiation-resistance in KEAP1 inactive lung cancers (b, c).
See Discussion for a detailed description.

Similar articles

Cited by

References

    1. Jiang X, Stockwell BR, Conrad M. Ferroptosis: mechanisms, biology and role in disease. Nat. Rev. Mol. Cell Biol. 2021;22:266–282. doi: 10.1038/s41580-020-00324-8. - DOI - PMC - PubMed
    1. Conrad M, Pratt DA. The chemical basis of ferroptosis. Nat. Chem. Biol. 2019;15:1137–1147. doi: 10.1038/s41589-019-0408-1. - DOI - PubMed
    1. Dixon SJ, et al. Ferroptosis: an iron-dependent form of nonapoptotic cell death. Cell. 2012;149:1060–1072. doi: 10.1016/j.cell.2012.03.042. - DOI - PMC - PubMed
    1. Stockwell BR, et al. Ferroptosis: a regulated cell death nexus linking metabolism, redox biology, and disease. Cell. 2017;171:273–285. doi: 10.1016/j.cell.2017.09.021. - DOI - PMC - PubMed
    1. Tang D, Chen X, Kang R, Kroemer G. Ferroptosis: molecular mechanisms and health implications. Cell Res. 2021;31:107–125. doi: 10.1038/s41422-020-00441-1. - DOI - PMC - PubMed

Publication types

MeSH terms

Substances