How HLA diversity is apportioned: influence of selection and relevance to transplantation
- PMID: 35430892
- PMCID: PMC9014195
- DOI: 10.1098/rstb.2020.0420
How HLA diversity is apportioned: influence of selection and relevance to transplantation
Abstract
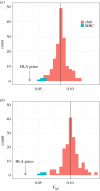
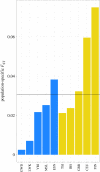
In his 1972 paper 'The apportionment of human diversity', Lewontin showed that, when averaged over loci, genetic diversity is predominantly attributable to differences among individuals within populations. However, selection can alter the apportionment of diversity of specific genes or genomic regions. We examine genetic diversity at the human leucocyte antigen (HLA) loci, located within the major histocompatibility complex (MHC) region. HLA genes code for proteins that are critical to adaptive immunity and are well-documented targets of balancing selection. The single-nucleotide polymorphisms (SNPs) within HLA genes show strong signatures of balancing selection on large timescales and are broadly shared among populations, displaying low FST values. However, when we analyse haplotypes defined by these SNPs (which define 'HLA alleles'), we find marked differences in frequencies between geographic regions. These differences are not reflected in the FST values because of the extreme polymorphism at HLA loci, illustrating challenges in interpreting FST. Differences in the frequency of HLA alleles among geographic regions are relevant to bone-marrow transplantation, which requires genetic identity at HLA loci between patient and donor. We discuss the case of Brazil's bone marrow registry, where a deficit of enrolled volunteers with African ancestry reduces the chance of finding donors for individuals with an MHC region of African ancestry. This article is part of the theme issue 'Celebrating 50 years since Lewontin's apportionment of human diversity'.
Keywords: HLA genes; MHC; population structure; population-specific FST; transplantation.
Conflict of interest statement
We declare we have no competing interests.
Figures


Similar articles
-
Differentiation between African populations is evidenced by the diversity of alleles and haplotypes of HLA class I loci.Tissue Antigens. 2004 Apr;63(4):293-325. doi: 10.1111/j.0001-2815.2004.00192.x. Tissue Antigens. 2004. PMID: 15009803
-
Absence of strong linkage disequilibrium between odorant receptor alleles and the major histocompatibility complex.Hum Immunol. 2013 Dec;74(12):1619-23. doi: 10.1016/j.humimm.2013.08.005. Epub 2013 Aug 20. Hum Immunol. 2013. PMID: 23974053
-
The Effect of Balancing Selection on Population Differentiation: A Study with HLA Genes.G3 (Bethesda). 2018 Jul 31;8(8):2805-2815. doi: 10.1534/g3.118.200367. G3 (Bethesda). 2018. PMID: 29950428 Free PMC article.
-
Forensic genetics through the lens of Lewontin: population structure, ancestry and race.Philos Trans R Soc Lond B Biol Sci. 2022 Jun 6;377(1852):20200422. doi: 10.1098/rstb.2020.0422. Epub 2022 Apr 18. Philos Trans R Soc Lond B Biol Sci. 2022. PMID: 35430883 Free PMC article. Review.
-
Human leucocyte antigen diversity: A biological gift to escape infections, no longer a barrier for haploidentical Hemopoietic Stem Cell Transplantation.Int J Immunogenet. 2020 Feb;47(1):34-40. doi: 10.1111/iji.12459. Epub 2019 Oct 27. Int J Immunogenet. 2020. PMID: 31657118 Review.
Cited by
-
Genetic history of Cambridgeshire before and after the Black Death.Sci Adv. 2024 Jan 19;10(3):eadi5903. doi: 10.1126/sciadv.adi5903. Epub 2024 Jan 17. Sci Adv. 2024. PMID: 38232165 Free PMC article.
-
[Molecular biology in a blood bank].Rev Med Inst Mex Seguro Soc. 2023 Jan 1;61(Suppl 1):S46-S51. Rev Med Inst Mex Seguro Soc. 2023. PMID: 36378106 Free PMC article. Review. Spanish.
-
A systematic review reveals that African children of 15-17 years demonstrate low hepatitis B vaccine seroprotection rates.Sci Rep. 2023 Dec 13;13(1):22182. doi: 10.1038/s41598-023-49674-1. Sci Rep. 2023. PMID: 38092870 Free PMC article.
-
Inferring Balancing Selection From Genome-Scale Data.Genome Biol Evol. 2023 Mar 3;15(3):evad032. doi: 10.1093/gbe/evad032. Genome Biol Evol. 2023. PMID: 36821771 Free PMC article. Review.
-
Celebrating 50 years since Lewontin's apportionment of human diversity.Philos Trans R Soc Lond B Biol Sci. 2022 Jun 6;377(1852):20200405. doi: 10.1098/rstb.2020.0405. Epub 2022 Apr 18. Philos Trans R Soc Lond B Biol Sci. 2022. PMID: 35430889 Free PMC article. No abstract available.
References
-
- Lewontin RC. 1972. The apportionment of human diversity. In Evolutionary biology: volume 6 (eds Dobzhansky T, Hecht MK, Steere WC), pp. 381-398. New York, NY: Springer.
-
- Jobling MA, Hollox E, Hurles M, Kivisild T, Tyler-Smith C. 2014. Human evolutionary genetics, 2nd edn. New York, NY: Garland Science.
Publication types
MeSH terms
Grants and funding
LinkOut - more resources
Full Text Sources
Research Materials
Miscellaneous

