

SARS-CoV-2 impairs the disassembly of stress granules and promotes ALS-associated amyloid aggregation
- PMID: 35384603
- PMCID: PMC8983322
- DOI: 10.1007/s13238-022-00905-7
SARS-CoV-2 impairs the disassembly of stress granules and promotes ALS-associated amyloid aggregation
Abstract
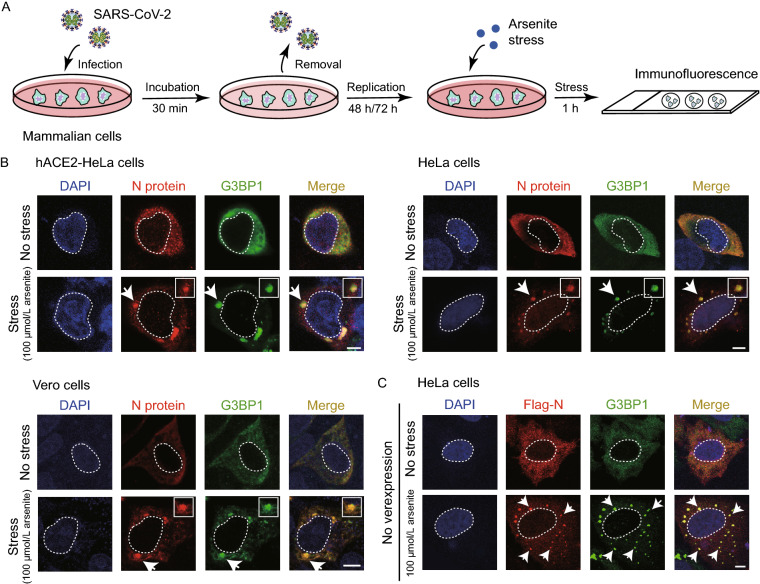
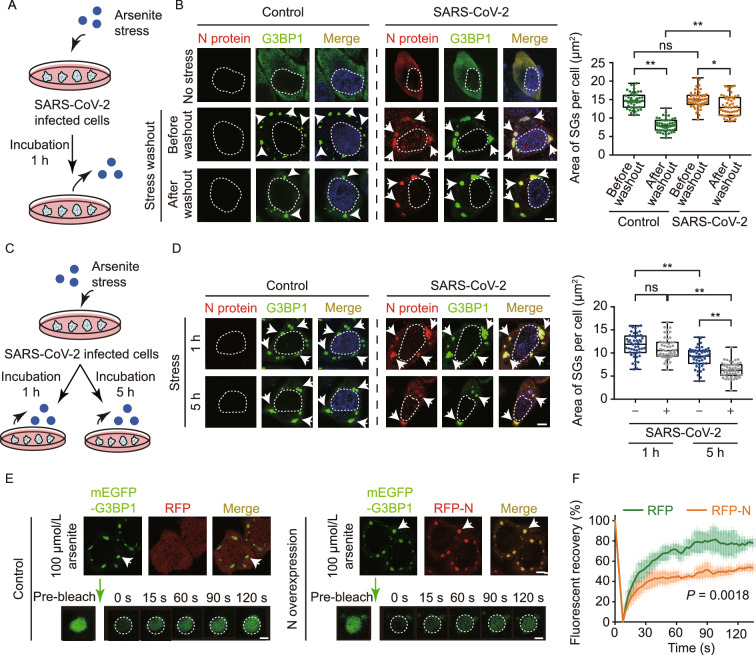
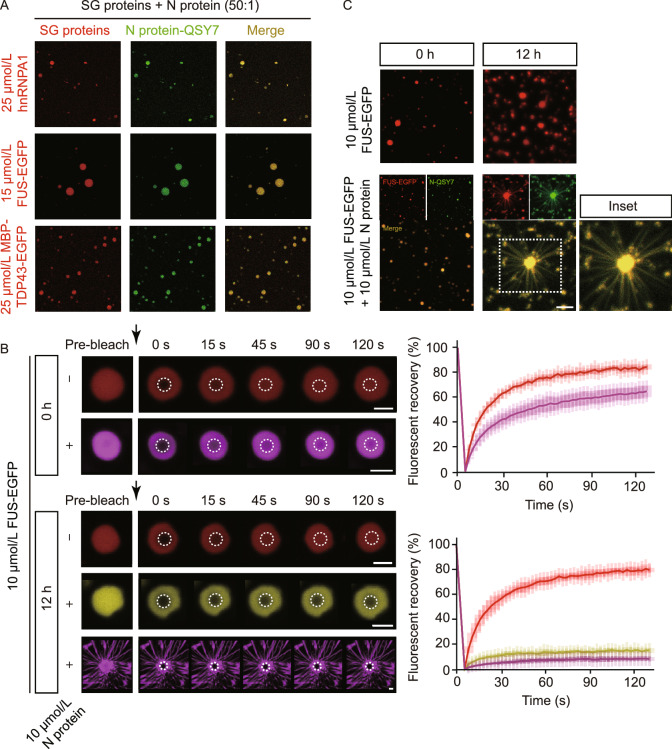
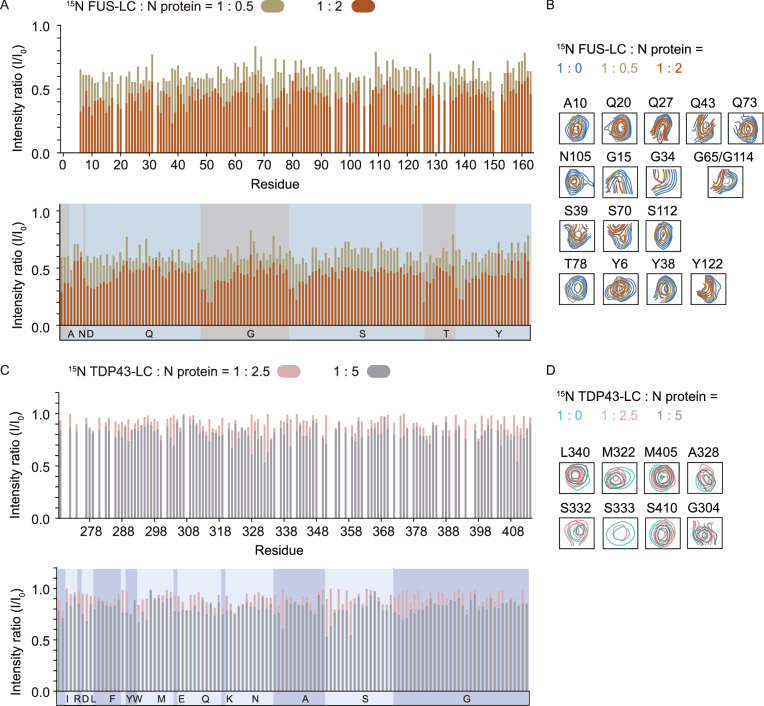
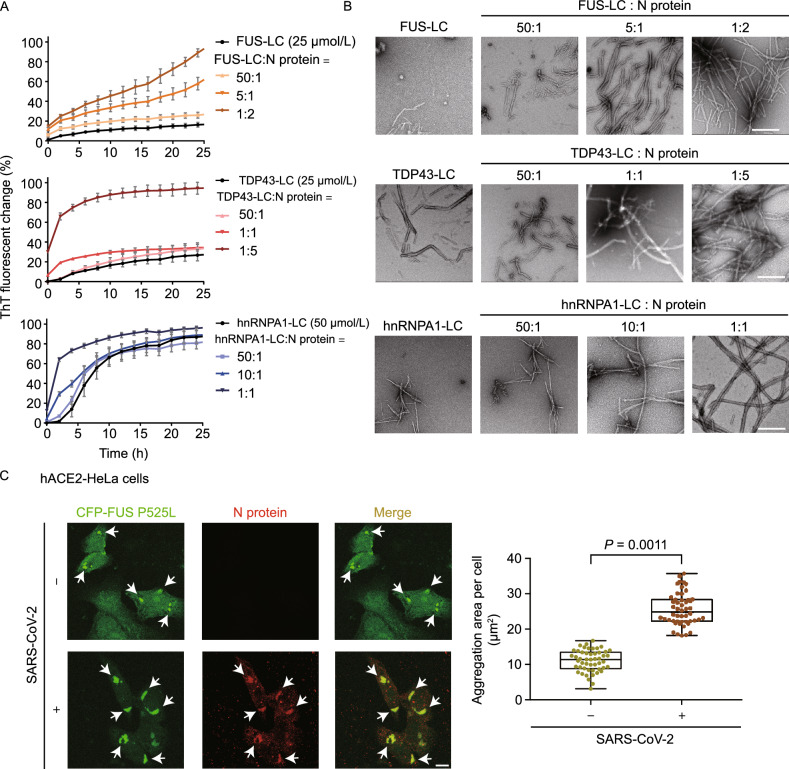
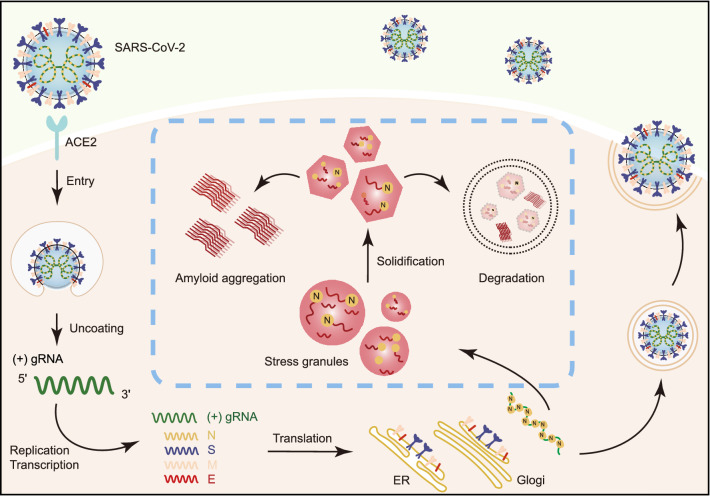
The nucleocapsid (N) protein of SARS-CoV-2 has been reported to have a high ability of liquid-liquid phase separation, which enables its incorporation into stress granules (SGs) of host cells. However, whether SG invasion by N protein occurs in the scenario of SARS-CoV-2 infection is unknow, neither do we know its consequence. Here, we used SARS-CoV-2 to infect mammalian cells and observed the incorporation of N protein into SGs, which resulted in markedly impaired self-disassembly but stimulated cell cellular clearance of SGs. NMR experiments further showed that N protein binds to the SG-related amyloid proteins via non-specific transient interactions, which not only expedites the phase transition of these proteins to aberrant amyloid aggregation in vitro, but also promotes the aggregation of FUS with ALS-associated P525L mutation in cells. In addition, we found that ACE2 is not necessary for the infection of SARS-CoV-2 to mammalian cells. Our work indicates that SARS-CoV-2 infection can impair the disassembly of host SGs and promote the aggregation of SG-related amyloid proteins, which may lead to an increased risk of neurodegeneration.
Keywords: SARS-CoV-2; nucleocapsid protein; stress granule.
© 2022. The Author(s).
Figures
Similar articles
-
Stress Granule Homeostasis, Aberrant Phase Transition, and Amyotrophic Lateral Sclerosis.ACS Chem Neurosci. 2022 Aug 17;13(16):2356-2370. doi: 10.1021/acschemneuro.2c00262. Epub 2022 Jul 29. ACS Chem Neurosci. 2022. PMID: 35905138 Review.
-
Spatiotemporal Proteomic Analysis of Stress Granule Disassembly Using APEX Reveals Regulation by SUMOylation and Links to ALS Pathogenesis.Mol Cell. 2020 Dec 3;80(5):876-891.e6. doi: 10.1016/j.molcel.2020.10.032. Epub 2020 Nov 19. Mol Cell. 2020. PMID: 33217318 Free PMC article.
-
ALS-linked cytoplasmic FUS assemblies are compositionally different from physiological stress granules and sequester hnRNPA3, a novel modifier of FUS toxicity.Neurobiol Dis. 2022 Jan;162:105585. doi: 10.1016/j.nbd.2021.105585. Epub 2021 Dec 14. Neurobiol Dis. 2022. PMID: 34915152 Free PMC article.
-
An aberrant phase transition of stress granules triggered by misfolded protein and prevented by chaperone function.EMBO J. 2017 Jun 14;36(12):1669-1687. doi: 10.15252/embj.201695957. Epub 2017 Apr 4. EMBO J. 2017. PMID: 28377462 Free PMC article.
-
Stress granules in neurodegeneration--lessons learnt from TAR DNA binding protein of 43 kDa and fused in sarcoma.FEBS J. 2013 Sep;280(18):4348-70. doi: 10.1111/febs.12287. Epub 2013 May 9. FEBS J. 2013. PMID: 23587065 Review.
Cited by
-
SARS-CoV-2, aging, and Post-COVID-19 neurodegeneration.J Neurochem. 2023 Apr;165(2):115-130. doi: 10.1111/jnc.15736. Epub 2022 Dec 11. J Neurochem. 2023. PMID: 36458986 Free PMC article. Review.
-
Amyloidogenic proteins in the SARS-CoV and SARS-CoV-2 proteomes.Nat Commun. 2023 Feb 20;14(1):945. doi: 10.1038/s41467-023-36234-4. Nat Commun. 2023. PMID: 36806058 Free PMC article.
-
LINE1-Mediated Reverse Transcription and Genomic Integration of SARS-CoV-2 mRNA Detected in Virus-Infected but Not in Viral mRNA-Transfected Cells.Viruses. 2023 Feb 25;15(3):629. doi: 10.3390/v15030629. Viruses. 2023. PMID: 36992338 Free PMC article.
-
Hsp70 exhibits a liquid-liquid phase separation ability and chaperones condensed FUS against amyloid aggregation.iScience. 2022 May 5;25(6):104356. doi: 10.1016/j.isci.2022.104356. eCollection 2022 Jun 17. iScience. 2022. PMID: 35620440 Free PMC article.
-
Impact of the Renin-Angiotensin System on the Pathogeny and Pharmacotherapeutics of Neurodegenerative Diseases.Biomolecules. 2022 Oct 6;12(10):1429. doi: 10.3390/biom12101429. Biomolecules. 2022. PMID: 36291638 Free PMC article. Review.
References
-
- Bellmann J, Monette A, Tripathy V, Sojka A, Abo-Rady M, Janosh A, Bhatnagar R, Bickle M, Mouland AJ, Sterneckert J. Viral infections exacerbate FUS-ALS phenotypes in iPSC-derived spinal neurons in a virus species-specific manner. Front Cell Neurosci. 2019;13:480. doi: 10.3389/fncel.2019.00480. - DOI - PMC - PubMed
-
- Bostanciklioglu M (2020) Severe acute respiratory syndrome coronavirus 2 is penetrating to dementia research. Curr Neurovasc Res. - PubMed
Publication types
MeSH terms
Substances
LinkOut - more resources
Full Text Sources
Medical
Miscellaneous
