. 2022 Mar 14;19(1):67.
doi: 10.1186/s12974-022-02428-8.

Homer1 promotes the conversion of A1 astrocytes to A2 astrocytes and improves the recovery of transgenic mice after intracerebral hemorrhage

Affiliations

Homer1 promotes the conversion of A1 astrocytes to A2 astrocytes and improves the recovery of transgenic mice after intracerebral hemorrhage

Xiaowei Fei et al. J Neuroinflammation. .

Abstract

Background: Inflammation induced by intracerebral hemorrhage (ICH) is one of the main causes of the high mortality and poor prognosis of patients with ICH. A1 astrocytes are closely associated with neuroinflammation and neurotoxicity, whereas A2 astrocytes are neuroprotective. Homer scaffolding protein 1 (Homer1) plays a protective role in ischemic encephalopathy and neurodegenerative diseases. However, the role of Homer1 in ICH-induced inflammation and the effect of Homer1 on the phenotypic conversion of astrocytes remain unknown.

Methods: Femoral artery autologous blood from C57BL/6 mice was used to create an ICH model. We use the A1 phenotype marker C3 and A2 phenotype marker S100A10 to detect astrocyte conversion after ICH. Homer1 overexpression/knock-down mice were constructed by adeno-associated virus (AAV) infection to explore the role of Homer1 and its mechanism of action after ICH. Finally, Homer1 protein and selumetinib were injected into in situ hemorrhage sites in the brains of Homer1flox/flox/Nestin-Cre+/- mice to study the efficacy of Homer1 in the treatment of ICH by using a mouse cytokine array to explore the potential mechanism.

Results: The expression of Homer1 peaked on the third day after ICH and colocalized with astrocytes. Homer1 promotes A1 phenotypic conversion in astrocytes in vivo and in vitro. Overexpression of Homer1 inhibits the activation of MAPK signaling, whereas Homer1 knock-down increases the expression of pathway-related proteins. The Homer1 protein and selumetinib, a non-ATP competitive MEK1/2 inhibitor, improved the outcome in ICH in Homer1flox/flox/Nestin-Cre+/- mice. The efficacy of Homer1 in the treatment of ICH is associated with reduced expression of the inflammatory factor TNFSF10 and increased expression of the anti-inflammatory factors activin A, persephin, and TWEAK.

Conclusions: Homer1 plays an important role in inhibiting inflammation after ICH by suppressing the A1 phenotype conversion in astrocytes. In situ injection of Homer1 protein may be a novel and effective method for the treatment of inflammation after ICH.

Keywords: Astrocytes; Homer1; Inflammation; Intracerebral hemorrhage; Phenotype.


Conflict of interest statement

The authors declared that they have no competing interests.

Figures
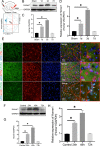
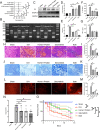
Fig. 1
Fig. 1
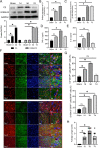
Protein and mRNA expression levels of Homer1 after ICH. A Schematic diagram of ICH modeling. B Homer1 protein expression in vivo after ICH. The blots are representative of other replicates in those groups. C Quantification of result in panel B [F (3, 16) = 283.4, P < 0.0001]. D Homer1 mRNA expression in vivo after ICH [F (3, 16) = 417.4 P < 0.0001]. E Immunofluorescence was used to detect the co-localization of Homer1 with neurons, microglia, and astrocytes. F Expression of Homer1 protein in a cellular ICH model. The blots are representative of other replicates in those groups. G Quantification of result in panel F [F (3, 8) = 197.5, P < 0.0001]. H Expression of Homer1 mRNA in a cellular ICH model [F (3, 8) = 875.4, P < 0.0001]. The data were analyzed using one-way analysis of variance and all data are expressed as the mean 66262 ± standard deviation. *P < 0.05 represents a statistically significant difference between the two groups. Each experiment was repeated three times
Fig. 2
Fig. 2
Transcription and translation levels of C3 and S100A10 after ICH in mice. A Protein expression of C3 and S100A10 in hemorrhagic tissues after ICH [C3: F (3, 16) = 509.4, P < 0.0001; S100A10: F (3, 16) = 936.0, P < 0.0001]. The blots are representative of other replicates in those groups. B mRNA level of C3 [F (3, 16) = 93.73, P < 0.0001]. C mRNA level of S100A10 [F (3, 16) = 974.1, P < 0.0001). D expression of TNF-α [F (3, 16) = 133.8, P < 0.0001]. E expression of IL-1β [F (3, 16) = 63.40, P = 0.0001]. F Representative photographs of C3, S100A10 and GFAP co-staining of frozen sections of brain tissue at different time points after ICH. G Quantification of result in panel F [C3: F (3, 16) = 206.6, P < 0.0001; S100A10: F (3, 16) = 188.3, P < 0.0001]. H Longa scores of mice at different time points after ICH [F (3, 36) = 40.47, P < 0.0001]. The data were analyzed using one-way analysis of variance and all data are expressed as the mean ± standard deviation. *P < 0.05 represents a statistically significant difference between the two groups. Each experiment was repeated three times
Fig. 3
Fig. 3
Transcription and translation levels of C3 and S100A10 after erythrocyte lysate stimulation in primary astrocytes. A Protein expression of C3 and S100A10 in primary astrocytes after erythrocyte lysate stimulation [C3: F (3, 8) = 74.4, P < 0.0001; S100A10: F (3, 8) = 519.8, P < 0.0001]. The blots are representative of other replicates in those groups. B mRNA level of C3 [F (3, 8) = 272.9, P < 0.0001). C mRNA level of S100A10 [F (3, 8) = 293, P < 0.0001). D expression of TNF-α [F (3, 8) = 37.69, P < 0.0001]. E expression of IL-1β [F (3, 8) = 20.16, P = 0.0004]. The data were analyzed using one-way analysis of variance and all data are expressed as the mean ± standard deviation. *P < 0.05 represents a statistically significant difference between the two groups. Each experiment was repeated three times
Fig. 4
Fig. 4
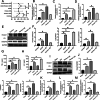
Effects of Homer1-OE and Homer1-KD on transcription and translation level of C3 and S100A10 in vivo and in vitro. A Effects of Homer1-OE and Homer1-KD on cell activity. the modified cells were replaced with ACM medium and cultured for 48 h to reach the most serious state of inflammation [normal medium: F (2, 6) = 1.760, P = 0.2504; ACM medium: F (2, 6) = 0.6375, P = 0.5610]. qPCR was used to detect the transcription levels of Homer1 (B) [F (3, 8) = 146.5, P < 0.0001], C3 (C) [F (3, 8) = 179.6, P < 0.0001) and S100A10 (D) [F (3, 8) = 196.7, P < 0.0001] in each group; WB was used to detect the translation level of Homer1, C3 and S100A10 (E) in each group and quantify the results (F) [Homer1: F (3, 8) = 334.0, P < 0.0001; C3: F (3, 8) = 136.7, P < 0.0001; S100A10: F (3, 8) = 146.1, P < 0.0001]; The blots are representative of other replicates in those groups. ELISA was used to detect the secretion levels of TNF-α (G) [F (3, 8) = 56.76, P < 0.0001] and IL-1β (H) [F (3, 8) = 140.1, P < 0.0001] in cell supernatant of each group. In vivo, WB was used to detect the translation levels of Homer1, C3 and S100A10 in the brain tissue of mice in each group on the 3rd day after ICH (I), and the results were quantified (J) [Homer1: F (3, 16) = 103.3, P < 0.0001; C3: F (3, 16) = 170.8, P < 0.0001; S100A10: F (3, 16) = 106.2, P < 0.0001]; The blots are representative of other replicates in those groups. qPCR was used to detect the transcriptional levels of Homer1 (K) [F (3, 16) = 157.3, P < 0.0001], C3 (L) [F (3, 16) = 389.2, P < 0.0001] and S100A10 (M) [F (3, 16) = 581.7, P < 0.0001] in the brain of mice 3 days after ICH. The data were analyzed using one-way analysis of variance and all data are expressed as the mean ± standard deviation. *P < 0.05 represents a statistically significant difference between the two groups. ns: no statistical difference. Each experiment was repeated three times
Fig. 5
Fig. 5
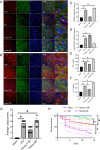
Homer1-OE increased the proportion of S100A10+GFAP+ cells and improved behavioral score and survival time. A Representative photographs of C3 and GFAP co-staining of frozen sections of brain tissue in different groups 3 days after intracerebral hemorrhage. B Representative photographs of S100A10 and GFAP co-staining of frozen sections of brain tissue in different groups 3 days after intracerebral hemorrhage. C Quantification of result in panel A [F (3, 16) = 167.3, P < 0.0001]. D Quantification of result in panel B [F (3, 16) = 122.0, P < 0.0001]. E expression of TNF-α [F (3, 16) = 223.6, P < 0.0001]. F expression of IL-1β [F (3, 16) = 352.4, P < 0.0001]. G Longa scores of different groups on the 3rd day after ICH [F (3, 36) = 69.85, P < 0.0001]. H Survival curve of mice in each group (n = 20) after ICH operation [log-rank (Mantel–Cox) test: Chi-square = 40.81; df = 3; P < 0.0001]. The data were analyzed using one-way analysis of variance and all data are expressed as the mean ± standard deviation. *P < 0.05 represents a statistically significant difference between the two groups
Fig. 6
Fig. 6
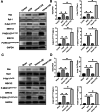
Effects of Home1-OE and Homer-KD on MAPK signaling. A WB was performed to examine the effect of Homer1-OE and Homer1-KD on MAPK signaling-related protein expression in primary astrocytes in vitro. The blots are representative of other replicates in those groups. B Quantification of result in panel A [Ras: F (3, 8) = 92.21, P < 0.0001; P-Raf-1Ser338/Raf-1: F (3, 8) = 57.06, P < 0.0001; P-MEK1/2/MEK1/2: F (3, 8) = 132.8, P < 0.0001; P-ERK1/2/ERK1/2: F (3, 8) = 278.4, P < 0.0001]. C WB was performed to examine the effect of Homer1-OE and Homer1-KD on MAPK signaling-related protein expression in cerebral hemorrhage site in vivo. The blots are representative of other replicates in those groups. D Quantification of result in panel C [Ras: F (3, 16) = 316.7, P < 0.0001; P-Raf-1Ser338/Raf-1: F (3, 16) = 376, P < 0.0001; P-MEK1/2/MEK1/2: F (3, 16) = 882.1, P < 0.0001; P-ERK1/2/ERK1/2: F (3, 16) = 1579, P < 0.0001]. The data were analyzed using one-way analysis of variance and all data are expressed as the mean ± standard deviation. *P < 0.05 represents a statistically significant difference between the two groups. Each experiment was repeated three times
Fig. 7
Fig. 7
Homer1 protein and Selumetinib improve the pathological indexes and prognosis of ICH. A Effects of Homer1 protein and Selumetinib on cell activity [normal medium: F (3, 8) = 0.3731 P = 0.7748; ACM medium: F (3, 8) = 0.5067, P = 0.6885]. B Genotype identification of Homer1flox/flox/Nestin-Cre+/− mice. C WB was used to detect the translation levels of C3 and S100A10 in the brain tissue of mice in each group on the 3rd day after ICH and the results were quantified in D [F (4, 20) = 72.42, P < 0.0001] and E [F (4, 20) = 183.6, P < 0.0001]. The blots are representative of other replicates in those groups. F expression of IL-1β [F (4, 20) = 99.59, P < 0.0001]. G expression of TNF-α [F (4, 20) = 98.31, P < 0.0001]. H Representative photographs of HE staining of brain tissue in each group. I Quantification of result in panel H [F (4, 20) = 279, P < 0.0001]. J Representative photographs of Nissl staining of brain tissue in each group. K Quantification of result in panel J [F (4, 20) = 196.6, P < 0.0001]. L Representative photographs of TUNEL staining of brain tissue in each group. M Quantification of result in panel L [F (4, 20) = 159.6, P < 0.0001]. N Longa scores of different groups on the 3rd day after ICH [F (4, 45) = 34.68, P < 0.0001]. O Survival curve of mice in each group (n = 20) after ICH operation [Log-rank (Mantel–Cox) test: Chi-square = 21.4; df = 4; P = 0.0003]. The data were analyzed using one-way analysis of variance and all data are expressed as the mean ± standard deviation. *P < 0.05 represents a statistically significant difference between the two groups. ns no statistical difference
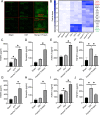
Fig. 8
Fig. 8
The inflammatory indexes in brain tissue and cerebrospinal fluid were detected by protein chip. A Representative experimental diagram of chip slide carrier. B Heat map of protein chip results. C Expression level of TWEAK in hemorrhagic tissue [F (2, 6) = 125.5, P < 0.0001]. D Expression level of Persephin in hemorrhagic tissue [F (2, 6) = 20.94, P = 0.002]. E Expression level of Activin A in hemorrhagic tissue [F (2, 6) = 107.2, P < 0.0001]. F Expression level of TNFSF10 in hemorrhagic tissue [F (2, 6) = 19.22, P = 0.0025]. G Expression level of TWEAK in CSF [F (2, 6) = 12.99, P = 0.0066]. H Expression level of Persephin in CSF [F (2, 6) = 5.736, P = 0.0405]. I Expression level of Activin A in CSF [F (2, 6) = 70.95, P < 0.0001]. J Expression level of TNFSF10 in CSF [F (2, 6) = 18.82, P = 0.0026]. The data were analyzed using one-way analysis of variance and all data are expressed as the mean ± standard deviation. *P < 0.05 represents a statistically significant difference between the two groups

Similar articles

Cited by

References

    1. Ma Z, et al. Neuromodulators signal through astrocytes to alter neural circuit activity and behaviour. Nature. 2016;539(7629):428–432. - PMC - PubMed
    1. Jackson D, et al. ATP and potassium ions: a deadly combination for astrocytes. Sci Rep. 2014;4:4576. - PMC - PubMed
    1. Spagnuolo M, et al. Brain-derived neurotrophic factor modulates cholesterol homeostasis and Apolipoprotein E synthesis in human cell models of astrocytes and neurons. J Cell Physiol. 2018;233(9):6925–6943. - PubMed
    1. Bijelić D, et al. Central nervous system-infiltrated immune cells induce calcium increase in astrocytes via astroglial purinergic signaling. J Neurosci Res. 2020;98(11):2317–2332. - PubMed
    1. Bowen K, et al. A novel ligand on astrocytes interacts with natural cytotoxicity receptor NKp44 regulating immune response mediated by NK cells. PLoS ONE. 2018;13(2):e0193008. - PMC - PubMed

Substances