. 2022 Mar 8;13(1):1217.
doi: 10.1038/s41467-022-28872-x.

Arabidopsis RBV is a conserved WD40 repeat protein that promotes microRNA biogenesis and ARGONAUTE1 loading

Affiliations

Arabidopsis RBV is a conserved WD40 repeat protein that promotes microRNA biogenesis and ARGONAUTE1 loading

Chao Liang et al. Nat Commun. .

Abstract

MicroRNAs (miRNAs) play crucial roles in gene expression regulation through RNA cleavage or translation repression. Here, we report the identification of an evolutionarily conserved WD40 domain protein as a player in miRNA biogenesis in Arabidopsis thaliana. A mutation in the REDUCTION IN BLEACHED VEIN AREA (RBV) gene encoding a WD40 domain protein led to the suppression of leaf bleaching caused by an artificial miRNA; the mutation also led to a global reduction in the accumulation of endogenous miRNAs. The nuclear protein RBV promotes the transcription of MIR genes into pri-miRNAs by enhancing the occupancy of RNA polymerase II (Pol II) at MIR gene promoters. RBV also promotes the loading of miRNAs into AGO1. In addition, RNA-seq revealed a global splicing defect in the mutant. Thus, this evolutionarily conserved, nuclear WD40 domain protein acts in miRNA biogenesis and RNA splicing.


Conflict of interest statement

The authors declare no competing interests.

Figures

Fig. 1
Fig. 1. Isolation of the silencing suppressor mutant rbv-1 from an amiR-SUL line.
a Phenotypes of 1-month-old amiR-SUL rbv-1 and amiR-SUL plants. Bar = 1 cm. b Images of rosette leaves from 1-month-old plants grown under long-day conditions. c 14-day-old seedlings showing reduced root length in amiR-SUL rbv-1. Bar = 1 cm. d RNA gel analysis showing reduced accumulation of amiR-SUL and endogenous miRNAs in the amiR-SUL rbv-1 mutant. U6 was used as an internal control. The numbers represent relative abundance. Two independent repeats gave similar results. e A scatter plot showing the abundance of miRNAs in amiR-SUL rbv-1 and amiR-SUL as determined by small RNA-seq with 14-day-old seedlings. miRNA abundance was calculated as reads per million mapped reads (RPM) and miRNAs with RPM > 10 in either genotype are shown. The red dots indicate miRNAs with higher levels in amiR-SUL rbv-1, and the blue dots indicate miRNAs with lower levels in amiR-SUL rbv-1. (Student’s t test, *P < 0.05). f Determination of miRNA target mRNA levels in amiR-SUL and amiR-SUL rbv-1 in 14-day-old seedlings by RT-qPCR. UBQUITIN5 (UBQ5) was used as the internal control. The values were relative to those in amiR-SUL. Error bars represent standard deviation from three technical replicates. Asterisks indicate a significant difference between amiR-SUL and amiR-SUL rbv-1 (Student’s t test, *P < 0.05). Source data are provided as a Source Data file.
Fig. 2
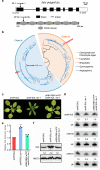
Fig. 2. Identification of AT5G64730 as RBV.
a Diagrams of the RBV (AT5G64730) gene (upper panel) and protein (lower panel). Rectangles and lines represent exons and introns, respectively. Black and white rectangles represent the coding region and the UTRs, respectively. The point mutation in rbv-1 and the corresponding change at the amino acid level are indicated (arrows). The protein domains were predicted (http://smart.embl-heidelberg.de/). b A phylogenetic tree of RBV and its paralog At5g50230 in plants. The colors of the branches represent different lineages of plant species. All genes used in the analysis are listed in Supplementary Data 2. The detailed phylogenetic tree is shown in Supplementary Fig. 4a. c Three-week-old plants of the indicated genotypes. pRBV:RBV-eYFP was introduced into amiR-SUL rbv-1. Bar = 1 cm. d RNA gel blot analysis of miRNAs from amiR-SUL, amiR-SUL rbv-1, and the complementation line pRBV:RBV-eYFP amiR-SUL rbv-1 using 14-day-old seedlings. U6 was used as an internal control. The numbers represent relative abundance. e RT-qPCR to determine RNA levels of the amiR-SUL target gene SUL in the indicated genotypes. Three independent biological replicates were used for the calculation of standard deviation. (two-tailed Student’s t test, **P < 0.01). f Protein gel blot analysis to determine the protein levels of the amiR-SUL target gene SUL in the indicated genotypes. Two independent repeats gave similar results. Source data are provided as a Source Data file.
Fig. 3
Fig. 3. RBV promotes the transcription of MIR genes.
a Three-week-old plants of the indicated genotypes. Bar = 1 cm. b Levels of seven pri-miRNAs in 14-day-old seedlings of rbv-1 and the complementation line pRBV:RBV-eYFP rbv-1 as determined by RT-qPCR. UBQ5 was used as the internal control. Error bars represent standard deviation calculated from three independent replicates. (Student’s t test, **P < 0.01). c Representative images of GUS staining of pMIR167a:GUS and pMIR167a:GUS rbv-1 inflorescences. Bars = 2 mm. d Transcript levels of GUS from the two genotypes as determined by RT-qPCR. The expression values were relative to pMIR167a:GUS. Error bars represent standard deviation calculated from three independent replicates. (two-tailed Student’s t test, *P < 0.05). e RBV is required for the recruitment of Pol II to MIR166a and MIR167a promoters. The occupancy of Pol II at various regions was determined by ChIP with rbv-1 and Col using an antibody that recognizes the C-terminal repeat (YSPTSPS) of the largest subunit of Pol II. ChIP performed without the antibody served as a negative control. A genomic region between the genes AT2G17460 and AT2G17470 named Pol II C1 was also used as a negative control. Mean and standard deviation from three independent replicates are presented. (Student’s t test, **P < 0.01). Source data are provided as a Source Data file.
Fig. 4
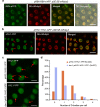
Fig. 4. RBV is required for the proper localization of HYL1 in D-bodies.
a RBV is localized in the nucleoplasm. eYFP and mRuby3 signals were detected in root cells (n = 100) from pRBV:RBV-eYFP pSE:SE-mRuby3 transgenic plants. Bar = 10 μm. b HYL1 and SE protein localization in roots of pHYL1:HYL1-YFP pSE:SE-mRuby3 plants. Both proteins show nucleoplasmic localization while HYL1 also shows D-body localization. In total 100 cells were observed. Bar = 10 μm. c Representative images of pHYL1:HYL1-YFP signals in root cells from the meristematic zone in the two genotypes. Arrows indicate D-bodies. Bars = 5 μm. d The percentage of cells with 1–4 D-bodies per cell in wild type and rbv-1. The x-axis represents the number of D-bodies per cell, and the y-axis represents the percentage of cells with the corresponding number of D-bodies. “N” means the numbers of total root cells examined. Source data are provided as a Source Data file.
Fig. 5
Fig. 5. Mutation of RBV leads to a defect of miRNA loading into AGO1.
a A scatter plot of miRNA abundance in rbv-1 input vs. Col input. All miRNAs were normalized by total reads, and those with RPM > 10 in either genotype are shown. The red dots indicate miRNAs showing increased abundance in rbv-1, and the blue dots indicate miRNAs with reduced abundance in rbv-1 (Student’s t test, *P < 0.05). b A scatter plot showing the AGO1 loading efficiency of miRNAs in rbv-1 vs. Col as determined by AGO1 IP small RNA-seq. AGO1 loading efficiency is represented by the ratio of miRNA abundance in AGO1 IP vs. input. All miRNAs with RPM value > 10 in either genotype in the input samples (as in a) are shown here. The red dots indicate miRNAs with increased AGO1 association in rbv-1, and the blue dots indicate miRNAs with reduced AGO1 association in rbv-1 (Student’s t test, *P < 0.05). c RNA gel blots analysis of three miRNAs before (input) and after AGO1 IP. U6 was used as an internal control for the input samples. For the IP samples, a portion was used for protein gel blot analysis to quantify AGO1 protein levels. The levels of miRNAs in the IP samples were normalized against AGO1 protein levels. No matter whether the assayed miRNAs were increased or reduced in abundance in input samples, they all showed reduced AGO1 association. Three independent repeats gave similar results. d Western blots to determine the nucleocytoplasmic partitioning of AGO1 in Col and rbv-1. T total extract, C cytoplasmic fraction, N nuclear fraction. Blots were analyzed using AGO1, GAPDH, and H3 antibodies, respectively. H3 was used as a nuclear marker in the quantification of AGO1 in the T and N samples. GAPDH was used as a cytoplasmic marker in the quantification of AGO1 in the T and C samples. Three independent repeats gave similar results. e Small-RNA gel blot analysis to determine the levels of miRNAs from total extract (T) and from the cytoplasmic (C) and nuclear (N) fractions in Col and rbv-1. U6 and tRNAMet served as nuclear and cytoplasmic RNA markers, respectively. They also served as the loading controls for the nuclear and cytoplasmic fractions for the quantification of miRNA levels. Two independent repeats gave similar results. f Small RNA gel blot analysis of miRNAs in AGO1 IP from the cytoplasmic (C) and nuclear (N) fractions. NE, normal exposure; LE long exposure. Two independent repeats gave similar results. g Size exclusion chromatography with pRBV:RBV-eYFP rbv-1 and rbv-1 samples followed by western blotting to detect AGO1 and northern blotting to detect miR159. The upper panel indicates the distribution of AGO1 while the lower panel represents the distribution of miR159 among the fractions. The numbers above the AGO1 blots indicate those of the fractions. Note that no AGO1 or miR159 was detected in fractions 1–7 (not shown). The positions of the molecular weight standards are shown above the AGO1 blots. Two independent repeats gave similar results. Source data are provided as a Source Data file.
Fig. 6
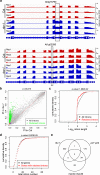
Fig. 6. RBV function is required in the splicing of short introns in certain pre-mRNAs.
a Examples of two genes with intron retention defects in the rbv-1 mutant. RNA-seq reads are shown against the gene models below. In the gene models, rectangles and lines represent exons and introns, respectively. The black rectangles indicate retained introns in the rbv-1 mutant. b A scatter plot showing percent retained introns (PI) in wild type and the rbv-1 mutant. The green dots represent introns with statistically significant retention defects in the mutant (Wilcoxon test, P = 0). c Cumulative density plots of intron length for all introns and for retained introns in the rbv-1 mutant (Wilcoxon test, P = 1.984E−22). d Cumulative density plots of intron number in all genes and for genes with retained introns in the rbv-1 mutant. (Wilcoxon test, P = 2.823E−05). e Venn diagrams showing the numbers of retained introns in rbv-1, prl1 prl2 and mac3a mac3b mutants, and the overlaps among the introns retained in these mutants.
Fig. 7
Fig. 7. A model for the role of RBV in miRNA biogenesis.
A pathway of miRNA biogenesis entailing MIR gene transcription, pri-miRNA processing, miRNA methylation, and miRISC formation is shown. Key protein players in each step are depicted as ovals. RBV promotes miRNA biogenesis at the MIR gene transcription and AGO1 loading steps and may also enhance pri-miRNA processing.

Similar articles

Cited by

References

    1. Yu Y, Jia T, Chen X. The ‘how’ and ‘where’ of plant microRNAs. N. Phytol. 2017;216:1002–1017. - PMC - PubMed
    1. Song X, Li Y, Cao X, Qi Y. MicroRNAs and their regulatory roles in plant-environment interactions. Annu. Rev. Plant Biol. 2019;70:489–525. - PubMed
    1. Xie Z, et al. Expression of Arabidopsis MIRNA genes. Plant Physiol. 2005;138:2145–2154. - PMC - PubMed
    1. Zheng B, et al. Intergenic transcription by RNA polymerase II coordinates Pol IV and Pol V in siRNA-directed transcriptional gene silencing in Arabidopsis. Genes Dev. 2009;23:2850–2860. - PMC - PubMed
    1. Kim YJ, et al. The role of mediator in small and long noncoding RNA production in Arabidopsis thaliana. EMBO J. 2011;30:814–822. - PMC - PubMed

Publication types

MeSH terms

LinkOut - more resources