

Targeted Metabolomic Analysis in Alzheimer's Disease Plasma and Brain Tissue in Non-Hispanic Whites
- PMID: 35253754
- PMCID: PMC9108583
- DOI: 10.3233/JAD-215448
Targeted Metabolomic Analysis in Alzheimer's Disease Plasma and Brain Tissue in Non-Hispanic Whites
Abstract
Background: Metabolites are biological compounds reflecting the functional activity of organs and tissues. Understanding metabolic changes in Alzheimer's disease (AD) can provide insight into potential risk factors in this multifactorial disease and suggest new intervention strategies or improve non-invasive diagnosis.
Objective: In this study, we searched for changes in AD metabolism in plasma and frontal brain cortex tissue samples and evaluated the performance of plasma measurements as biomarkers.
Methods: This is a case-control study with two tissue cohorts: 158 plasma samples (94 AD, 64 controls; Texas Alzheimer's Research and Care Consortium - TARCC) and 71 postmortem cortex samples (35 AD, 36 controls; Banner Sun Health Research Institute brain bank). We performed targeted mass spectrometry analysis of 630 compounds (106 small molecules: UHPLC-MS/MS, 524 lipids: FIA-MS/MS) and 232 calculated metabolic indicators with a metabolomic kit (Biocrates MxP® Quant 500).
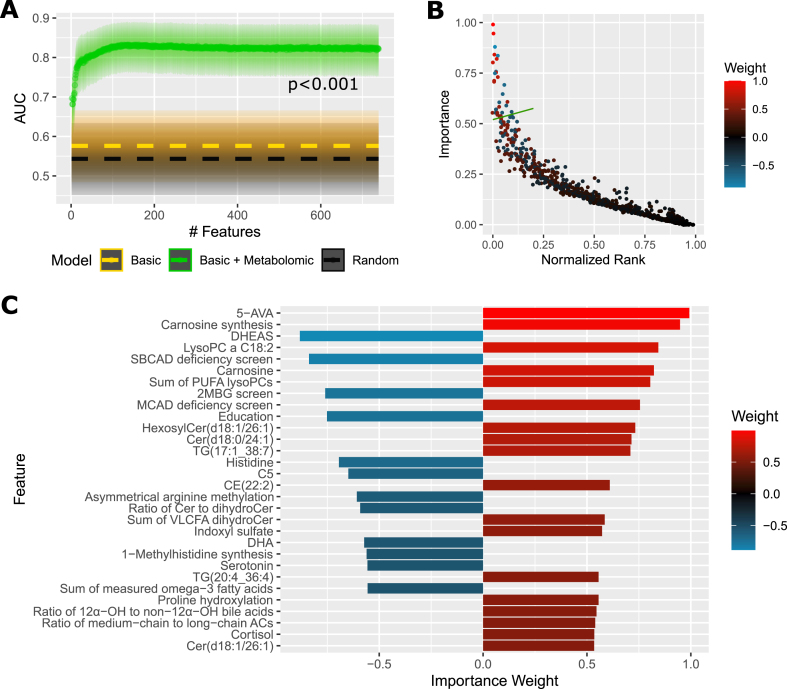
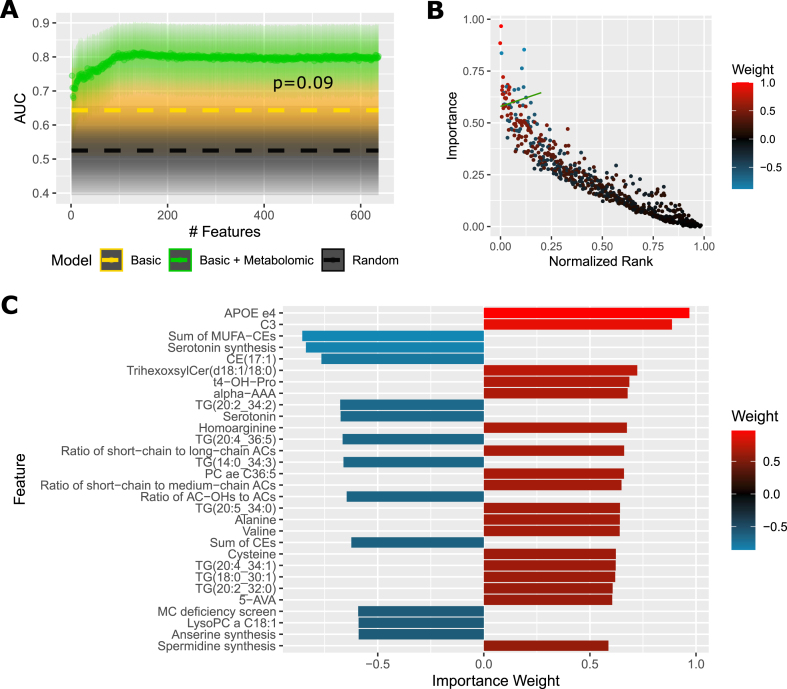
Results: We discovered disturbances (FDR≤0.05) in multiple metabolic pathways in AD in both cohorts including microbiome-related metabolites with pro-toxic changes, methylhistidine metabolism, polyamines, corticosteroids, omega-3 fatty acids, acylcarnitines, ceramides, and diglycerides. In AD, plasma reveals elevated triglycerides, and cortex shows altered amino acid metabolism. A cross-validated diagnostic prediction model from plasma achieves AUC = 82% (CI95 = 75-88%); for females specifically, AUC = 88% (CI95 = 80-95%). A reduced model using 20 features achieves AUC = 79% (CI95 = 71-85%); for females AUC = 84% (CI95 = 74-92%).
Conclusion: Our findings support the involvement of gut environment in AD and encourage targeting multiple metabolic areas in the design of intervention strategies, including microbiome composition, hormonal balance, nutrients, and muscle homeostasis.
Keywords: Alzheimer’s disease; antioxidants; bacterial toxins; biomarkers; human microbiome; hyperlipidemia; lipidomics; metabolic pathways; metabolomics; polyamines.
Conflict of interest statement
Authors’ disclosures available online (
Figures

Similar articles
-
Dysregulation of multiple metabolic networks related to brain transmethylation and polyamine pathways in Alzheimer disease: A targeted metabolomic and transcriptomic study.PLoS Med. 2020 Jan 24;17(1):e1003012. doi: 10.1371/journal.pmed.1003012. eCollection 2020 Jan. PLoS Med. 2020. PMID: 31978055 Free PMC article.
-
Unbiased Metabolomic Investigation of Alzheimer's Disease Brain Points to Dysregulation of Mitochondrial Aspartate Metabolism.J Proteome Res. 2016 Feb 5;15(2):608-18. doi: 10.1021/acs.jproteome.5b01020. Epub 2016 Jan 12. J Proteome Res. 2016. PMID: 26717242 Free PMC article.
-
Widely targeted metabolomics of Alzheimer's disease postmortem cerebrospinal fluid based on 9-fluorenylmethyl chloroformate derivatized ultra-high performance liquid chromatography tandem mass spectrometry.J Chromatogr B Analyt Technol Biomed Life Sci. 2018 Aug 1;1091:53-66. doi: 10.1016/j.jchromb.2018.05.031. Epub 2018 May 23. J Chromatogr B Analyt Technol Biomed Life Sci. 2018. PMID: 29852382
-
Translational Metabolomics of Head Injury: Exploring Dysfunctional Cerebral Metabolism with Ex Vivo NMR Spectroscopy-Based Metabolite Quantification.In: Kobeissy FH, editor. Brain Neurotrauma: Molecular, Neuropsychological, and Rehabilitation Aspects. Boca Raton (FL): CRC Press/Taylor & Francis; 2015. Chapter 25. In: Kobeissy FH, editor. Brain Neurotrauma: Molecular, Neuropsychological, and Rehabilitation Aspects. Boca Raton (FL): CRC Press/Taylor & Francis; 2015. Chapter 25. PMID: 26269925 Free Books & Documents. Review.
-
Metabolomic Alterations in the Blood and Brain in Association with Alzheimer's Disease: Evidence from in vivo to Clinical Studies.J Alzheimers Dis. 2021;84(1):23-50. doi: 10.3233/JAD-210737. J Alzheimers Dis. 2021. PMID: 34511504 Review.
Cited by
-
A Perspective: Challenges in Dementia Research.Medicina (Kaunas). 2022 Sep 28;58(10):1368. doi: 10.3390/medicina58101368. Medicina (Kaunas). 2022. PMID: 36295529 Free PMC article.
-
In vivo neuroprotective capacity of a Dunaliella salina extract - comprehensive transcriptomics and metabolomics study.NPJ Sci Food. 2024 Jan 10;8(1):4. doi: 10.1038/s41538-023-00246-7. NPJ Sci Food. 2024. PMID: 38200022 Free PMC article.
-
Comparing Symmetric Dimethylarginine and Amyloid-β42 as Predictors of Alzheimer's Disease Development.J Alzheimers Dis Rep. 2023 Dec 29;7(1):1427-1444. doi: 10.3233/ADR-230054. eCollection 2023. J Alzheimers Dis Rep. 2023. PMID: 38225970 Free PMC article.
-
Metabolic and Transcriptomic Signatures of the Acute Psychological Stress Response in the Mouse Brain.Metabolites. 2023 Mar 20;13(3):453. doi: 10.3390/metabo13030453. Metabolites. 2023. PMID: 36984893 Free PMC article.
-
The potential of the gut microbiome for identifying Alzheimer's disease diagnostic biomarkers and future therapies.Front Neurosci. 2023 Apr 27;17:1130730. doi: 10.3389/fnins.2023.1130730. eCollection 2023. Front Neurosci. 2023. PMID: 37179559 Free PMC article. Review.
References
-
- World Health Organization (2021) Dementia. https://www.who.int/news-room/fact-sheets/detail/dementia, Last updated 2 September 2021, Accessed on October 5, 2021.
-
- Hersi M, Irvine B, Gupta P, Gomes J, Birkett N, Krewski D (2017) Risk factors associated with the onset and progression of Alzheimer’s disease: A systematic review of the evidence. Neurotoxicology 61, 143–187. - PubMed
-
- Sancesario GM, Bernardini S (2018) Alzheimer’s disease in the omics era. Clin Biochem 59, 9–16. - PubMed
-
- Sriwichaiin S, Chattipakorn N, Chattipakorn SC (2021) Metabolomic alterations in the blood and brain in association with Alzheimer’s disease: Evidence from in vivo to clinical studies. J Alzheimers Dis 84, 23–50. - PubMed
Publication types
MeSH terms
Grants and funding
LinkOut - more resources
Full Text Sources
Medical
