Prognostic Implications of Pyroptosis-Related Gene Signatures in Lung Squamous Cell Carcinoma
- PMID: 35153782
- PMCID: PMC8829032
- DOI: 10.3389/fphar.2022.806995
Prognostic Implications of Pyroptosis-Related Gene Signatures in Lung Squamous Cell Carcinoma
Abstract
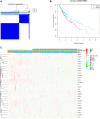
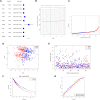
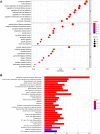
Background: Lung squamous cell carcinoma (LUSC) has been a highly malignant tumor with very poor prognosis. It is confirmed that pyroptosis refers to the deaths of cells in a programmed and inflammatory manner. Nevertheless, the correlation between expression of genes related with pyroptosis and their prognosis remains uncertain in LUSC. Methods: Utilization of The Cancer Genome Atlas (TCGA) cohort has been done for evaluating the prognostics of pyroptosis-related genes for survival and constructing a signature with multiple genes. The least absolute shrinkage and selection operator (LASSO) Cox regression was performed for establishing such pyroptosis-related gene signature. Results: Eventually, identification of 28 genes in relation to pyroptosis was made in LUSC and healthy lung tissues. Upon the basis of these differentially-expressed genes (DEGs), the patients of LUSC can be divided into two subtypes. Nine gene signatures were established using LASSO. The surviving rate for low-risk group was apparently greater in contrast with the high-risk group (p < .001). According to our finding, risk score worked as an independent predictive factor of OS among LUSC sufferers in combination with clinical characteristics. In line with Gene Ontology (GO) and Kyoto Encyclopedia of Genes and Genomes (KEGG) analyses, the enrichment of immunity-related genes and decreasing immunity status among the high-risk group. Conclusion: Genes in relation with pyroptosis played an essential role in tumor immunity, which is capable of predicting the prognosis for LUSCs.
Keywords: TCGA; immune microenvironment; lung squamous cell carcinoma; prognosis; pyroptosis.
Copyright © 2022 Li, Liu, Dong and Lyu.
Conflict of interest statement
The authors declare that the research was conducted in the absence of any commercial or financial relationships that could be construed as a potential conflict of interest.
Figures


Similar articles
-
A Novel Pyroptosis-Related Gene Signature for Early-Stage Lung Squamous Cell Carcinoma.Int J Gen Med. 2021 Oct 5;14:6439-6453. doi: 10.2147/IJGM.S331975. eCollection 2021. Int J Gen Med. 2021. PMID: 34675612 Free PMC article.
-
A novel defined pyroptosis-related gene signature for predicting the prognosis of ovarian cancer.Cell Death Discov. 2021 Apr 7;7(1):71. doi: 10.1038/s41420-021-00451-x. Cell Death Discov. 2021. PMID: 33828074 Free PMC article.
-
Analysis of Pyroptosis-Related Immune Signatures and Identification of Pyroptosis-Related LncRNA Prognostic Signature in Clear Cell Renal Cell Carcinoma.Front Genet. 2022 Jun 29;13:905051. doi: 10.3389/fgene.2022.905051. eCollection 2022. Front Genet. 2022. PMID: 35846134 Free PMC article.
-
A pyroptosis-associated signature plays a role in prognosis prediction in clear cell renal cell carcinoma.BMC Med Genomics. 2022 Sep 26;15(1):204. doi: 10.1186/s12920-022-01339-0. BMC Med Genomics. 2022. PMID: 36163033 Free PMC article.
-
Pyroptosis: A new insight of non-small-cell lung cancer treatment.Front Oncol. 2022 Nov 29;12:1013544. doi: 10.3389/fonc.2022.1013544. eCollection 2022. Front Oncol. 2022. PMID: 36523974 Free PMC article. Review.
Cited by
-
A pyroptosis expression pattern score predicts prognosis and immune microenvironment of lung squamous cell carcinoma.Front Genet. 2022 Nov 10;13:996444. doi: 10.3389/fgene.2022.996444. eCollection 2022. Front Genet. 2022. PMID: 36437960 Free PMC article.
-
Pyroptosis and Inflammasome-Related Genes-NLRP3, NLRC4 and NLRP7 Polymorphisms Were Associated with Risk of Lung Cancer.Pharmgenomics Pers Med. 2023 Aug 25;16:795-804. doi: 10.2147/PGPM.S424326. eCollection 2023. Pharmgenomics Pers Med. 2023. PMID: 37650010 Free PMC article.
-
Construction of a redox-related gene signature for overall survival prediction and immune infiltration in non-small-cell lung cancer.Front Mol Biosci. 2022 Aug 16;9:942402. doi: 10.3389/fmolb.2022.942402. eCollection 2022. Front Mol Biosci. 2022. PMID: 36052170 Free PMC article.
-
Determination of a prediction model for therapeutic response and prognosis based on chemokine signaling-related genes in stage I-III lung squamous cell carcinoma.Front Genet. 2022 Aug 31;13:921837. doi: 10.3389/fgene.2022.921837. eCollection 2022. Front Genet. 2022. PMID: 36118890 Free PMC article.
-
A newly identified pyroptosis-related gene signature for predicting prognosis of patients with hepatocellular cancer.Transl Cancer Res. 2022 Sep;11(9):3175-3186. doi: 10.21037/tcr-22-366. Transl Cancer Res. 2022. PMID: 36237236 Free PMC article.
References
LinkOut - more resources
Full Text Sources

