. 2022 Jan 24:12:753412.
doi: 10.3389/fimmu.2021.753412. eCollection 2021.

Everolimus Alleviates Renal Allograft Interstitial Fibrosis by Inhibiting Epithelial-to-Mesenchymal Transition Not Only via Inducing Autophagy but Also via Stabilizing IκB-α

Affiliations

Everolimus Alleviates Renal Allograft Interstitial Fibrosis by Inhibiting Epithelial-to-Mesenchymal Transition Not Only via Inducing Autophagy but Also via Stabilizing IκB-α

Zeping Gui et al. Front Immunol. .

Abstract

Chronic allograft dysfunction (CAD) is the major cause of late graft loss in long-term renal transplantation. In our previous study, we found that epithelial-mesenchymal transition (EMT) is a significant event in the progression of renal allograft tubulointerstitial fibrosis, and impaired autophagic flux plays a critical role in renal allograft fibrosis. Everolimus (EVR) has been reported to be widely used to prevent the progression of organ fibrosis and graft rejection. However, the pharmacological mechanism of EVR in kidney transplantation remains to be determined. We used CAD rat model and the human kidney 2 (HK2) cell line treated with tumor necrosis factor-α (TNF-α) and EVR to examine the role of EVR on TNF-α-induced EMT and transplanted renal interstitial fibrosis. Here, we found that EVR could attenuate the progression of EMT and renal allograft interstitial fibrosis, and also activate autophagy in vivo. To explore the mechanism behind it, we detected the relationship among EVR, autophagy level, and TNF-α-induced EMT in HK2 cells. Our results showed that autophagy was upregulated upon mTOR pathway inhibition by EVR, which could significantly reduce expression of TNF-α-induced EMT. However, the inhibition of EVR on TNF-α-induced EMT was partly reversed following the addition of autophagy inhibitor chloroquine. In addition, we found that TNF-α activated EMT through protein kinase B (Akt) as well as nuclear factor kappa B (NF-κB) pathway according to the RNA sequencing, and EVR's effect on the EMT was only associated with IκB-α stabilization instead of the Akt pathway. Together, our findings suggest that EVR may retard impaired autophagic flux and block NF-κB pathway activation, and thereby prevent progression of TNF-α-induced EMT and renal allograft interstitial fibrosis.

Keywords: EMT; autophagy; chronic renal graft dysfunction; everolimus; renal allograft interstitial fibrosis.


Conflict of interest statement

The authors declare that the research was conducted in the absence of any commercial or financial relationships that could be construed as a potential conflict of interest.

Figures
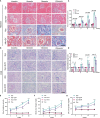
Figure 1
Figure 1
EVR prevented allograft renal function impairment and renal interstitial fibrosis in CAD rat model. (A, B) Representative images (n = 6) of Masson’s trichrome staining and PAS staining (scale bar: 25 μm) from kidneys of different treatment group rats. (C) Semi-quantitative analyses results of Masson’s trichrome staining positive area that represented the area of the renal interstitial fibrosis from kidneys of different treatment group rats. Values represented the mean ± SD (n = 6, ***p < 0.001). (D) The statistical analyses of tubulointerstitial damage scores in different treatment group rats. Values represented the mean ± SD (n = 6, *p < 0.05, **p < 0.01, ***p < 0.001). (E–G) Changes of renal function parameters—serum Cr, BUN, and 24-h urine protein of different treatment group rats. Values represented the mean ± SD (n = 6, ***p < 0.001 compared with control group, # P < 0.05, ## P < 0.01, ### p < 0.001 compared with Allo group); EVR, everolimus; PAS, periodic acid–Schiff; Cr, creatinine; BUN, blood urea nitrogen.
Figure 2
Figure 2
EVR alleviated the progression of renal tubular EMT in CAD rat model. (A) Representative IHC images of EMT markers (E-cadherin, α-SMA, and FN) in kidney sections from different treatment group rats (scale bar: 20 μm). (B) Semi-quantitative analyses results of IHC positive area in kidney sections from different treatment group rats. Values represented the mean ± SD (n = 6, **p < 0.01, ***p < 0.001). (C) Representative Western blotting results of EMT markers (E-cadherin, α-SMA, and FN) in kidney tissues from different treatment group rats. (D) Semi-quantitative analyses results of relative protein abundances of E-cadherin, α-SMA, and FN in kidney tissues from different treatment group rats. Values represented the mean ± SD (n = 6, **p < 0.01, ***p < 0.001); IHC, immunohistochemistry; α-SMA, α-smooth muscle actin; EVR, everolimus; EMT, epithelial–mesenchymal transition; FN, fibronectin.
Figure 3
Figure 3
EVR activated autophagy in CAD rat model. (A) Representative IHC images of LC3-II in kidney sections from different treatment group rats (scale bar: 15 μm). (B) Semi-quantitative analyses results of IHC positive area in kidney sections from different treatment group rats. Values represented the mean ± SD (n = 6, ***p < 0.001). (C) Representative Western blotting results of autophagy markers (SQSTM1 and LC3-II) in kidney sections from different treatment group rats at 8 and 20 weeks. (D) Semi-quantitative analyses results of relative protein abundances of SQSTM1 and LC3-II in kidney sections from different treatment group rats at 8 and 20 weeks. Values represented the mean ± SD (n = 6, ***p < 0.001). EVR, everolimus.
Figure 4
Figure 4
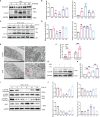
EVR activated autophagic flux through mTOR/ULK1 pathway in HK2 cells. (A) Representative Western blotting results of the expressions of SQSTM1 and LC3-II in HK2 cells after EVR treatment for different dosages. (B) Semi-quantitative analyses results of relative protein abundances of SQSTM1 and LC3-II in HK2 cells after EVR treatment for different dosage. Values represented the mean ± SD (n = 6, *p < 0.05, ***p < 0.001). (C) Representative Western blotting results of the expressions of SQSTM1 and LC3-II in HK2 cells after EVR treatment for different times. (D) Semi-quantitative analyses results of relative protein abundances of SQSTM1 and LC3-II in HK2 cells after EVR treatment for different times. Values represented the mean ± SD (n = 6, ***p < 0.001). (E) Representative TEM images of autophagosomes (red double arrow) and autolysosomes (red single arrow) in HK2 cells treated with or without EVR (10 nM) for 24 h (scale bar: 2 and 500 μm). (F) Qualitative analyses results of the number of autophagic vacuoles in control and EVR treatment groups under TEM. Values represented the mean ± SD (n = 6, ***p < 0.001). (G) Representative Western blotting results of the expression of LC3-II in HK2 cells treated with EVR (10 nM) and/or CQ (20 μM) for 24 h. (H) Semi-quantitative analyses results of relative protein abundance of LC3-II in HK2 cells treated with EVR and/or CQ for 24 h. Values represented the mean ± SD (n = 6, ***p < 0.001). (I) Representative Western blotting results of the expressions of p-mTOR, mTOR, p-70S6K, 70S6K, p-4E-BP1, 4E-BP1, and ULK1 in HK2 cells after EVR treatment for different times. (J) Semi-quantitative analyses results of relative protein abundances of p-mTOR, mTOR, p-70S6K, 70S6K, p-4E-BP1, 4E-BP1, and ULK1 in HK2 cells after EVR treatment for different times. Values represented the mean ± SD (n = 6, *p < 0.05, **p < 0.01, ***p < 0.001). TEM, transmission electron microscope; IF, immunofluorescence; EVR, everolimus; CQ, chloroquine.
Figure 5
Figure 5
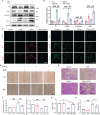
EVR alleviated the TNF-α‐mediated EMT, cell migration, and invasion in HK2 cells. (A) Representative Western blotting results of EMT markers (E-cadherin, α-SMA, and FN) and LC3-II in HK-2 cells treated with TNF-α (50 ng/ml) and/or EVR (10 nM) for 48 h. (B) Semi-quantitative analyses results of relative protein abundances of E-cadherin, α-SMA, FN, and LC3-II in HK-2 cells treated with TNF-α and/or EVR for 48 h. Values represented the mean ± SD (n = 6, **p < 0.01, ***p < 0.001). (C) Representative IF staining images of E-cadherin and FN in HK-2 cells treated with TNF-α (50 ng/ml) and/or EVR (10 nM) for 24 h (scale bar: 20 μm). (D) Representative wound healing test images on HK-2 cells treated with TNF-α (50 ng/ml) and/or EVR (10 nM) for 48 h (scale bar: 20 μm). (E) Representative transwell assay images on HK-2 cells treated with TNF-α (50 ng/ml) and/or EVR (10 nM) for 48 h (scale bar: 20 μm). (F) Semi-quantitative analyses results of relative IF staining intensity of E-cadherin and FN in HK-2 cells treated with TNF-α (50 ng/ml) and/or EVR (10 nM) for 24 h. Values represented the mean ± SD (n = 3, **p < 0.01, ***p < 0.001). (G) Quantitative analyses results of the motility index of HK-2 cells treated with TNF-α and/or EVR for 48 h; the motility index has determined by the formula “migration cell number of control group/migration cell number of the other treatment group”. Values represented the mean ± SD (n = 3, *p < 0.05). (H) Quantitative analyses results of the migration index of HK-2 cells treated with TNF-α and/or EVR for 48 h; the migration index as determined by the formula “migration cell number of the other treatment group/migration cell number of control group”. Values represented the mean ± SD (n = 3, *p < 0.05, ***p < 0.001). α-SMA, α-smooth muscle actin; EVR, everolimus; EMT, epithelial–mesenchymal transition; FN, fibronectin; TNF-α, tumor necrosis factor-α.
Figure 6
Figure 6
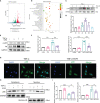
EVR suppressed TNF-α-mediated EMT via blocking NF–κB instead of Akt signaling pathway in HK-2 cells. (A) The RNA sequencing results of differential genes in HK-2 cells treated with or without TNF-α (50 ng/ml) for 24 h (n = 5). (B) KEGG pathway analyses results of the top 20 KEGG enriched gene pathways base on RNA sequencing results. (C) Representative Western blotting results of the expression of p-p65 in HK2 cells after TNF-α (50 ng/ml) treatment for different times. (D) Semi-quantitative analyses results of relative protein abundance of p-p65 in HK2 cells after TNF-α treatment for different times. Values represented the mean ± SD (n = 6, ***p < 0.001). (E) Representative Western blotting results of the expressions of p-p65 and FN in HK2 cells treated with TNF-α (50 ng/ml) and/or QNZ (20 nM) for 24 h. (F) Semi-quantitative analyses results of relative protein abundances of p-p65 and FN in HK2 cells treated with TNF-α and/or QNZ for 24 h. Values represented the mean ± SD (n = 6, ***p < 0.001). (G) Representative IF staining images of p65 in HK-2 cells treated with TNF-α (50 ng/ml) and/or EVR (10 nM) for 24 h (scale bar: 50 μm). (H) Representative Western blotting results of p65 in cytoplasmic and nuclear fractions of HK-2 cells treated with TNF-α (50 ng/ml) and/or EVR (10 nM) for 24 h. (I) Semi-quantitative analyses results of relative protein abundance of p65 in HK-2 cells treated with TNF-α and/or EVR for 24 h. Values represented the mean ± SD (n = 6, *p < 0.05, ***p < 0.001). TNF-α, tumor necrosis factor-α; KEGG, Kyoto Encyclopedia of Genes and Genomes; FN, fibronectin; QNZ, NF−κB inhibitor quinazoline; IF, immunofluorescence; EVR, everolimus.
Figure 7
Figure 7
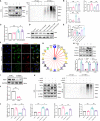
EVR inhibited TNF-α-induced EMT by inhibiting degradation of IκB-α in HK-2 cells, and Skp2 played an essential role in this process. (A) Representative Western blotting results f p-IKK-α, IKK-α, IκB-α, p-p65, and p65 in WCL of HK-2 cells treated with TNF-α (50 ng/ml) and/or EVR (10 nM) for 24 h. In addition, immunoprecipitation was performed with a IκB-α antibody, and Western blot assays were used to examine the ubiquitin conjugation among the indicated groups. (B) Semi-quantitative analyses results of relative protein abundances of p-IKK-α, IKK-α, IκB-α, p-p65, and p65 in WCL of HK-2 cells treated with TNF-α and/or EVR for 24 h. Values represented the mean ± SD (n = 6, ns, not significant, ***p < 0.001). (C) Relative expression of the NFKBIA in HK-2 cells treated with TNF-α (50 ng/ml) and/or EVR (10 nM) for 24 h. Values represented the mean ± SD (n = 6, ns, not significant, **p < 0.01). (D) Representative Western blotting results of IκB-α in HK2 cells treated with TNF-α (50 ng/ml) and different concentrations of CQ (20 and 40 μM)/MG132 (10 and 20 μM) for 24 h. (E) Semi-quantitative analyses results of relative protein abundance of IκB-α in HK-2 cells treated with TNF-α and CQ/MG132 for 24 h. Values represented the mean ± SD (n = 6, ns, not significant, ***p < 0.001). (F) Representative IF co-localization staining images of IκB-α and ubiquitin in HK-2 cells treated with TNF-α for 4 or 8 h (scale bar: 50 μm). (G) The network map of E3 ubiquitin ligase related to IκB-α predicted by UbiBrowser. (H) Representative Western blotting results of Skp2, Smurf1, and Smurf2 in HK2 cells treated with TNF-α (50 ng/ml) and/or EVR (10 nM) for 24 h. (I, J) Representative Western blotting results of negative control (NC) and small interfering RNA (si-Skp2) transfection efficiency in HK2 cells. (K, L) Representative Western blotting results of IκB-α, E-cadherin, α-SMA and FN in WCL of HK-2 cells treated with TNF-α (50 ng/ml) after transfecting si-Skp2 or si-NC. Immunoprecipitation was also performed with an IκB-α antibody, and Western blot assays were used to examine the ubiquitin conjugation among the indicated groups. Values represented the mean ± SD (n = 6, *p < 0.05, ***p < 0.001). WCL, whole-cell lysates; IF, immunofluorescence; EVR, everolimus; CQ, chloroquine; α-SMA, α-smooth muscle actin; FN, fibronectin.
Figure 8
Figure 8
EVR upregulated IκB-α protein and downregulated Skp2 and p-p65 in the CAD rat model. (A) Representative Western blotting results of Skp2, IκB-α, and p-p65 in kidney tissues from different treatment group rats. (B) Semi-quantitative analyses results of relative protein abundances of Skp2, IκB-α, and p-p65 in kidney tissues from different treatment group rats. Values represented the mean ± SD (n = 6, ***p < 0.001). (C) Representative IHC images of Skp2, IκB-α, and p-p65 in kidney sections from different treatment group rats (scale bar: 10 μm). (D) Semi-quantitative analyses results of IHC positive staining of Skp2, IκB-α, and p-p65 in kidney sections from different treatment group rats. Values represented the mean ± SD (n = 6, ***p < 0.001).
Figure 9
Figure 9
A model is proposed to illustrate the protective mechanisms of EVR on the pathogenesis of transplanted renal tubular EMT and interstitial fibrosis in CAD. TNF-α could induce renal tubular EMT and then promote transplanted renal interstitial fibrosis through Akt and NF-κB signaling pathway activation in CAD recipients. Of these, NF-κB signaling pathway activation was due to IκB-α decrease and p-p65 increase. On the one hand, EVR could inhibit progression of renal tubular EMT via blocking the mTOR/ULK1 pathway to activate autophagy flux directly. On the other hand, EVR could also affect Skp2 (a E3 ubiquitin ligase) activity and inhibit IκB-α ubiquitin degradation, and thus restrain progression of renal tubular EMT through impacting NF-κB pathway activation. Red arrows represent the effect of TNF-α and dark blue arrows represent the effect of EVR.

Similar articles

Cited by

References

    1. Carney EF. Transplantation: Survival Benefit of Accepting a Diabetic Deceased Donor Kidney. Nat Rev Nephrol (2017) 13(8):444. doi: 10.1038/nrneph.2017.88 - DOI - PubMed
    1. El-Husseini A, Aghil A, Ramirez J, Sawaya B, Rajagopalan N, Baz M, et al. . Outcome of Kidney Transplant in Primary, Repeat, and Kidney-After-Nonrenal Solid-Organ Transplantation: 15-Year Analysis of Recent UNOS Database. Clin Transplant (2017) 31(11):e13108. doi: 10.1111/ctr.13108 - DOI - PubMed
    1. Schinstock CA, Stegall M, Cosio F. New Insights Regarding Chronic Antibody-Mediated Rejection and Its Progression to Transplant Glomerulopathy. Curr Opin Nephrol Hypertens (2014) 23(6):611–8. doi: 10.1097/MNH.0000000000000070 - DOI - PubMed
    1. Goldberg RJ, Weng FL, Kandula P. Acute and Chronic Allograft Dysfunction in Kidney Transplant Recipients. Med Clin North Am (2016) 100(3):487–503. doi: 10.1016/j.mcna.2016.01.002 - DOI - PubMed
    1. Wang Z, Han Z, Tao J, Wang J, Liu X, Zhou W, et al. . Role of Endothelial-to-Mesenchymal Transition Induced by TGF-Beta1 in Transplant Kidney Interstitial Fibrosis. J Cell Mol Med (2017) 21(10):2359–69. doi: 10.1111/jcmm.13157 - DOI - PMC - PubMed

Publication types

MeSH terms