. 2022 Apr 1;132(7):e154422.
doi: 10.1172/JCI154422.

The HIV-1 proviral landscape reveals that Nef contributes to HIV-1 persistence in effector memory CD4+ T cells

Affiliations

The HIV-1 proviral landscape reveals that Nef contributes to HIV-1 persistence in effector memory CD4+ T cells

Gabriel Duette et al. J Clin Invest. .

Abstract

Despite long-term antiretroviral therapy (ART), HIV-1 persists within a reservoir of CD4+ T cells that contribute to viral rebound if treatment is interrupted. Identifying the cellular populations that contribute to the HIV-1 reservoir and understanding the mechanisms of viral persistence are necessary to achieve an effective cure. In this regard, through Full-Length Individual Proviral Sequencing, we observed that the HIV-1 proviral landscape was different and changed with time on ART across naive and memory CD4+ T cell subsets isolated from 24 participants. We found that the proportion of genetically intact HIV-1 proviruses was higher and persisted over time in effector memory CD4+ T cells when compared with naive, central, and transitional memory CD4+ T cells. Interestingly, we found that escape mutations remained stable over time within effector memory T cells during therapy. Finally, we provided evidence that Nef plays a role in the persistence of genetically intact HIV-1. These findings posit effector memory T cells as a key component of the HIV-1 reservoir and suggest Nef as an attractive therapeutic target.

Keywords: AIDS/HIV; Adaptive immunity; Infectious disease; Molecular genetics; T cells.


Figures

Figure 1
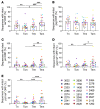
Figure 1. The HIV-1 proviral landscape is different between Tn and memory CD4+ T cell subsets isolated from ART-suppressed individuals.
Near-full-length HIV-1 proviral sequences were obtained by FLIPS from Tn and memory CD4+ T cell subsets of participants on suppressive ART. Genetically intact HIV-1 proviral sequences were identified and the intact infection frequency was calculated using a mixed logistic model for each cell subset: (A) including all intact sequences and (B) counting identical intact proviral sequences only once for each cell subset. Data represent average genetically intact proviruses per 106 cells ± 95% CIs. P values were calculated with a likelihood ratio test. (C) Proviral sequences were classified as full length (>8800 bp) or deleted (<8800 bp) and further categorized according to their predominant characteristic. In each cell subset, the percentage of each type of provirus was calculated: (D) intact; (E) full-length; (F) cis-acting defect; (G) hypermutated; (H) 5′ deleted; (I) 3′ deleted; and (J) 75% deleted. Genetically identical sequences were counted only once for each subset. Data represent the adjusted overall percentage ± 95% CI. P values were calculated with a likelihood ratio test. Tn, naive; Tcm, central memory; Ttm, transitional memory; Tem, effector memory. *P ≤ 0.05, **P ≤ 0.01, ***P ≤ 0.001.
Figure 2
Figure 2. The HIV-1 proviral landscape of memory CD4+ T cell subsets is similar after 1 round of viral replication.
Memory CD4+ T cells obtained from 3 HIV-1 donors were infected in vitro with HIV-1, and proviral sequences were obtained by FLIPS. (A) HIV-1 proviral sequence length in CD4+ T cell memory subsets. Each data point represents a single proviral sequence. (B) The percentage of full-length sequences in each CD4+ T cell subset is shown. Each data point represents a single donor. Data represent the mean ± SD. Statistical significance was determined by Kruskal-Wallis followed by Dunn’s post test. Tcm, central memory; Ttm, transitional memory; Tem, effector memory.
Figure 3
Figure 3. The HIV-1 proviral landscape changes over time in Tn and memory CD4+ T cell subsets.
Correlation analysis of the relationship between the percentage of (A) intact HIV-1 proviral sequences; (B) 3′ deleted HIV-1 proviral sequences; (C) HIV-1 proviral sequences with an intact gag ORF; and (D) HIV-1 proviral sequences with an intact pol ORF within each participant and time on ART (years) across Tn, Tcm, Ttm, and Tem cells. Each data point represents the percentage of sequences obtained per participant. Statistical significance was calculated by Spearman’s correlation test. P ≤ 0.05 values are shown in red. Tn, naive; Tcm, central memory; Ttm, transitional memory; Tem, effector memory; ORF, open reading frame.
Figure 4
Figure 4. Proportion of HIV-1 proviral sequences expressing CTL WT and unrecognizable epitopes for Gag correlates with time on ART in Tcm CD4+ T cells.
Correlation analysis of the relationship between the percentage of HIV-1 proviral sequences harboring WT epitopes, escape variants, and unrecognizable epitopes and time on ART (years) for the viral proteins Gag, across Tn, Tcm, Ttm, and Tem cells. Each data point represents the percentage of sequences obtained per participant. Statistical significance was calculated by Spearman’s correlation test. P ≤ 0.05 values are shown in red. Tn, naive; Tcm, central memory; Ttm, transitional memory; Tem, effector memory.
Figure 5
Figure 5. Proportion of HIV-1 proviral sequences expressing CTL WT and unrecognizable epitopes for Pol correlates with time on ART in Tcm CD4+ T cells.
Correlation analysis of the relationship between the percentage of HIV-1 proviral sequences harboring WT epitopes, escape variants, and unrecognizable epitopes and time on ART (years) for the viral proteins Pol, across Tn, Tcm, Ttm, and Tem cells. Each data point represents the percentage of sequences obtained per participant. Statistical significance was calculated by Spearman’s correlation test. P ≤ 0.05 values are shown in red. Tn, naive; Tcm, central memory; Ttm, transitional memory; Tem, effector memory.
Figure 6
Figure 6. The proportion of HIV-1 proviral sequences with intact nef ORFs is higher in Tem cells.
The percentage of sequences carrying genetically intact ORFs for (A) nef; (B) gag; and (C) pol was quantified across Tn and memory CD4+ T cells using a mixed logistic model. The percentage of HIV-1 proviral sequences harboring genetically intact gag (D) or pol (E) in combination with genetically intact nef within Tn and memory CD4+ T cells is shown. Data represent the adjusted overall percentage ± 95% CI. P values were calculated with a likelihood ratio test. Tn, naive; Tcm, central memory; Ttm, transitional memory; Tem, effector memory; ORF, open reading frame. *P ≤ 0.05, **P ≤ 0.01, ***P ≤ 0.001.
Figure 7
Figure 7. Defective proviruses can express Gag and functional Nef.
(A) Schematic representing deletions in HIV-1 proviral sequences obtained from Tem CD4+ T cells from HIV-1+ participants (brown) and deletions generated in NL4-3-eGFP constructs (blue). The full-length HIV-1 NL4-3 construct is represented in black (NL-FL). HEK293T cells were transfected with HIV-1 NL constructs. (B) Representative Western blot of 2 independent experiments showing Nef (green) and Gag (top-red) expression. β-Actin was used as a protein loading control (bottom-red). (C) Representative flow cytometry of 2 independent experiments showing eGFP and p24 expression in transfected HEK293T cells. (D) Representative histograms of 2 independent experiments showing HLA-A*02 gMFI in eGFP and eGFP+ cells.
Figure 8
Figure 8. Nef HIV-1 induces higher CD8+ T cell activity.
CD4+ T cells isolated from HIV-1+ donors were infected with HIV-WT or HIV-ΔNef and cocultured with autologous CD8+ T cells. (A) Timeline illustrating the experimental procedure, as described in Methods. (B) Flow cytometry of CD107a/b expression in CD8+ T cells from a representative experiment. (C) Expression of CD107a/b relative to values obtained from CD8+ T cells cocultured with HIV-WT–infected cells. Data represent mean ± SD. Statistical significance was determined by 2-tailed Student’s t test. Each experiment was performed in triplicate. **P ≤ 0.01. (D) Representative flow cytometry of 2 independent experiments showing p24 expression of cells infected with HIV-WT or HIV-ΔNef with or without coculture with autologous CD8+ T cells. (E) p24 values of cells infected with HIV-WT or HIV-ΔNef after 6 and 24 hours of coculture with CD8+ T cells relative to p24 expression in the CD4+ T cell–only condition.
Figure 9
Figure 9. The proportion of HIV-1 proviruses containing nef increases after CD8+ T cell clearance.
(A) Timeline illustrating the experimental procedure for the viral competition assay, as described in Methods. (B) Representative flow cytometry of 3 independent experiments showing p24 values from cells infected with HIV-WT or HIV-ΔNef after the coculture with CD8+ T cells. (C) Proportion of HIV-1 sequences containing gag+nef or pol+nef+ in infected cells in the presence and absence of CD8+ T cell coculture. Results obtained from 3 independent donors are shown. Statistical significance was determined by paired 2-tailed t test. *P ≤ 0.05.
Figure 10
Figure 10. Nef activity is higher in HIV-1–infected CD4+ Tem cells.
Memory CD4+ T cells from HIV-1 donors were sorted and infected with (A and B) HIV-BaL or (CE) HIV-NL4-3-eGFP for 5 days. (A) Representative dot plots (top) and histograms (bottom) of 10 independent experiments showing CD4 geometric mean fluorescence intensity (gMFI) in uninfected p24 and HIV-1–infected p24+ cells. (B) CD4 expression in HIV-1–infected cells was calculated as CD4 gMFI in p24+ cells relative to CD4 gMFI in p24 cells. (C) Representative dot plots (top) and histograms (bottom) of 4 independent experiments showing HLA-A*02 gMFI in uninfected eGFP and HIV-1–infected eGFP+ cells. (D) HLA-A*02 downmodulation in HIV-1–infected cells was calculated as HLA-A*02 gMFI in eGFP+ cells relative to HLA-A*02 gMFI in eGFP cells. (E) eGFP MFI relative to Tcm values. Data represent the mean ± SD (B) or median ± 95% CI (D and E). One-way ANOVA followed by the (B) Tukey’s HSD post test or (D and E) Kruskal-Wallis followed by Dunn’s post test were performed to determine statistical significance. Each data point represents a single donor. Tcm, central memory; Ttm, transitional memory; Tem, effector memory. *P ≤ 0.05, **P ≤ 0.01.

Comment in

Similar articles

Cited by

References

    1. Ho YC, et al. Replication-competent noninduced proviruses in the latent reservoir increase barrier to HIV-1 cure. Cell. 2013;155(3):540–551. doi: 10.1016/j.cell.2013.09.020. - DOI - PMC - PubMed
    1. Bruner KM, et al. Defective proviruses rapidly accumulate during acute HIV-1 infection. Nat Med. 2016;22(9):1043–1049. doi: 10.1038/nm.4156. - DOI - PMC - PubMed
    1. Imamichi H, et al. Defective HIV-1 proviruses produce novel protein-coding RNA species in HIV-infected patients on combination antiretroviral therapy. Proc Natl Acad Sci U S A. 2016;113(31):8783–8788. doi: 10.1073/pnas.1609057113. - DOI - PMC - PubMed
    1. Hiener B, et al. Identification of genetically intact HIV-1 proviruses in specific CD4+ T cells from effectively treated participants. Cell Rep. 2017;21(3):813–822. doi: 10.1016/j.celrep.2017.09.081. - DOI - PMC - PubMed
    1. Horsburgh BA, et al. High levels of genetically intact HIV in HLA-DR+ memory T cells indicates their value for reservoir studies. AIDS. 2020;34(5):659–668. doi: 10.1097/QAD.0000000000002465. - DOI - PMC - PubMed

Publication types

MeSH terms

Substances