

2',3'-cAMP treatment mimics the stress molecular response in Arabidopsis thaliana
- PMID: 35043968
- PMCID: PMC8968299
- DOI: 10.1093/plphys/kiac013
2',3'-cAMP treatment mimics the stress molecular response in Arabidopsis thaliana
Abstract
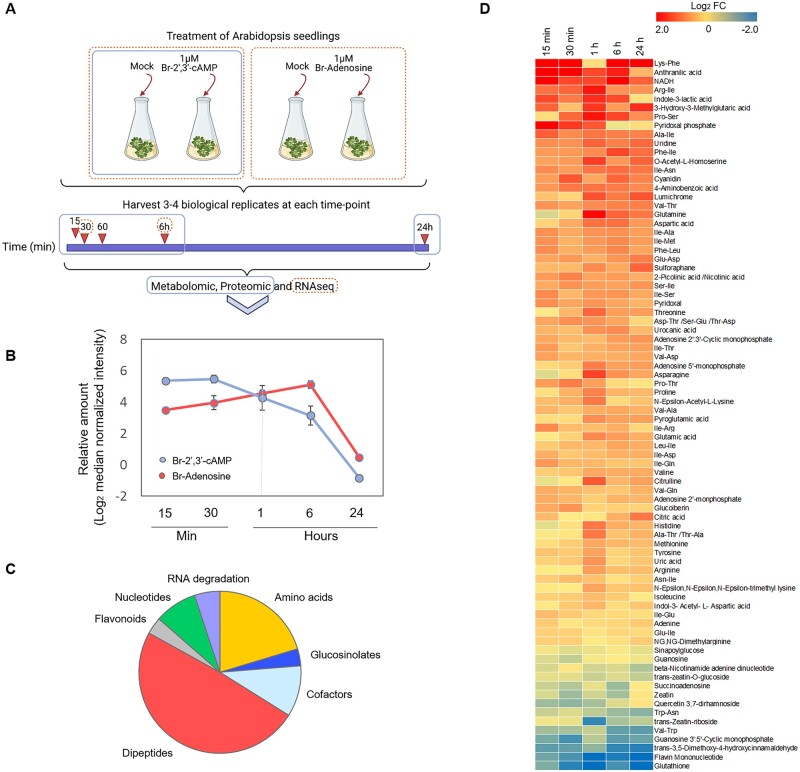
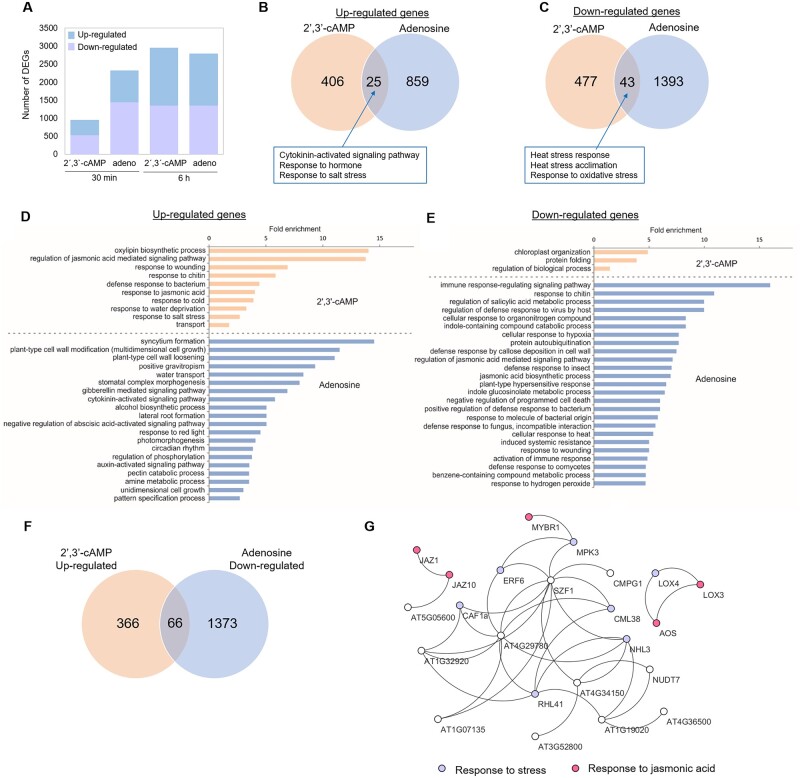
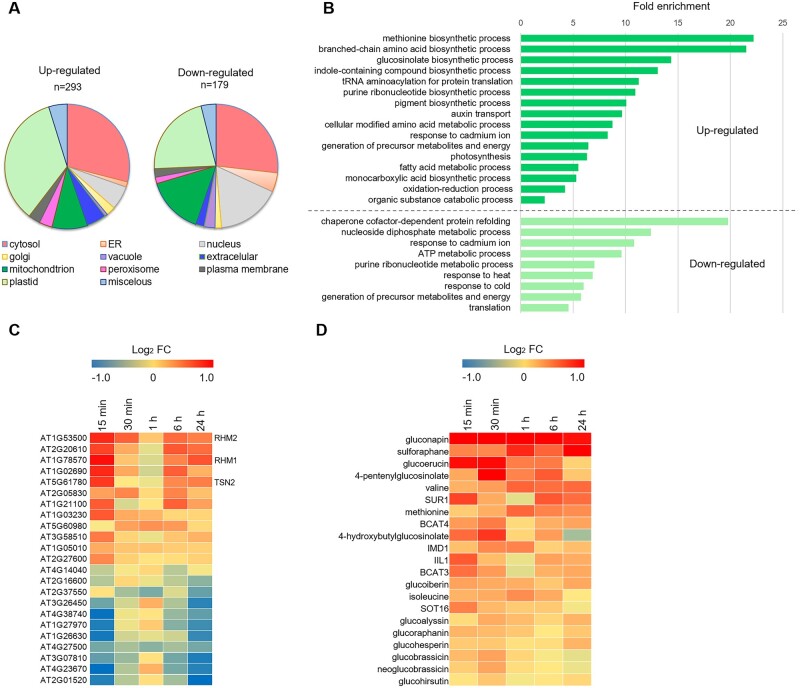
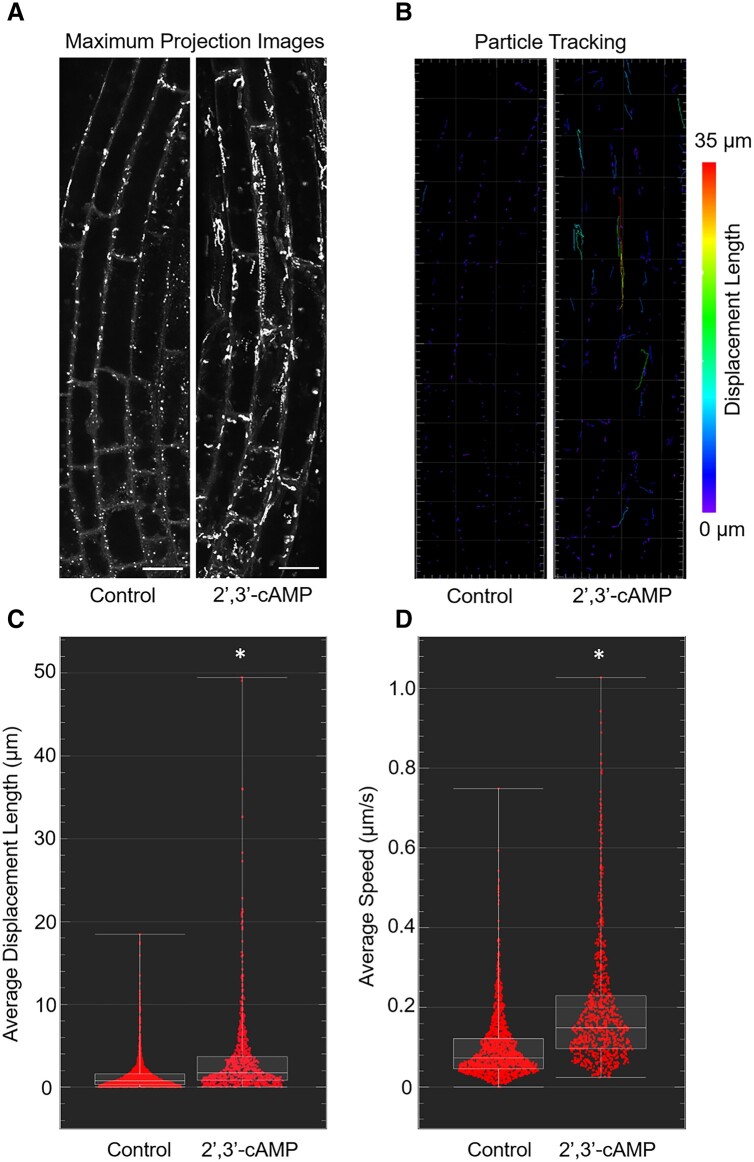
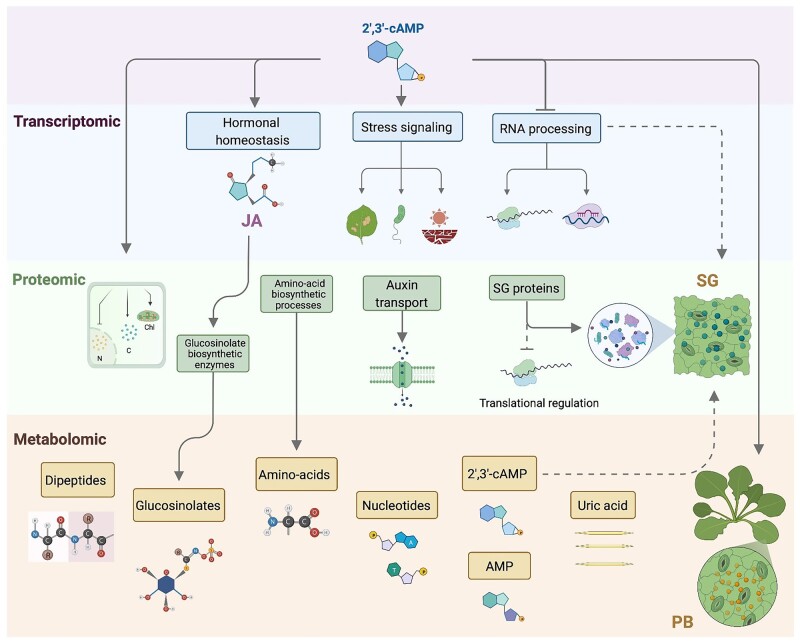
The role of the RNA degradation product 2',3'-cyclic adenosine monophosphate (2',3'-cAMP) is poorly understood. Recent studies have identified 2',3'-cAMP in plant material and determined its role in stress signaling. The level of 2',3'-cAMP increases upon wounding, in the dark, and under heat, and 2',3'-cAMP binding to an RNA-binding protein, Rbp47b, promotes stress granule (SG) assembly. To gain further mechanistic insights into the function of 2',3'-cAMP, we used a multi-omics approach by combining transcriptomics, metabolomics, and proteomics to dissect the response of Arabidopsis (Arabidopsis thaliana) to 2',3'-cAMP treatment. We demonstrated that 2',3'-cAMP is metabolized into adenosine, suggesting that the well-known cyclic nucleotide-adenosine pathway of human cells might also exist in plants. Transcriptomics analysis revealed only minor overlap between 2',3'-cAMP- and adenosine-treated plants, suggesting that these molecules act through independent mechanisms. Treatment with 2',3'-cAMP changed the levels of hundreds of transcripts, proteins, and metabolites, many previously associated with plant stress responses, including protein and RNA degradation products, glucosinolates, chaperones, and SG components. Finally, we demonstrated that 2',3'-cAMP treatment influences the movement of processing bodies, confirming the role of 2',3'-cAMP in the formation and motility of membraneless organelles.
© The Author(s) 2022. Published by Oxford University Press on behalf of American Society of Plant Biologists.
Figures
Similar articles
-
Both cyclic-AMP and cyclic-GMP can act as regulators of the phenylpropanoid pathway in Arabidopsis thaliana seedlings.Plant Physiol Biochem. 2013 Sep;70:142-9. doi: 10.1016/j.plaphy.2013.05.029. Epub 2013 May 31. Plant Physiol Biochem. 2013. PMID: 23774376
-
Interaction of 2',3'-cAMP with Rbp47b Plays a Role in Stress Granule Formation.Plant Physiol. 2018 May;177(1):411-421. doi: 10.1104/pp.18.00285. Epub 2018 Apr 4. Plant Physiol. 2018. PMID: 29618637 Free PMC article.
-
Proteomic signatures implicate cAMP in light and temperature responses in Arabidopsis thaliana.J Proteomics. 2013 May 27;83:47-59. doi: 10.1016/j.jprot.2013.02.032. Epub 2013 Mar 18. J Proteomics. 2013. PMID: 23517717
-
A Comprehensive Gene Inventory for Glucosinolate Biosynthetic Pathway in Arabidopsis thaliana.J Agric Food Chem. 2020 Jul 15;68(28):7281-7297. doi: 10.1021/acs.jafc.0c01916. Epub 2020 Jul 1. J Agric Food Chem. 2020. PMID: 32551569 Review.
-
cAMP Is a Promising Regulatory Molecule for Plant Adaptation to Heat Stress.Life (Basel). 2022 Jun 14;12(6):885. doi: 10.3390/life12060885. Life (Basel). 2022. PMID: 35743916 Free PMC article. Review.
Cited by
-
A proxitome-RNA-capture approach reveals that processing bodies repress coregulated hub genes.Plant Cell. 2024 Feb 26;36(3):559-584. doi: 10.1093/plcell/koad288. Plant Cell. 2024. PMID: 37971938 Free PMC article.
-
Stress-related biomolecular condensates in plants.Plant Cell. 2023 Sep 1;35(9):3187-3204. doi: 10.1093/plcell/koad127. Plant Cell. 2023. PMID: 37162152 Free PMC article.
-
Round and round it goes: a cyclic nucleotide modulates stress responses in plants.Plant Physiol. 2022 Mar 28;188(4):1942-1943. doi: 10.1093/plphys/kiac004. Plant Physiol. 2022. PMID: 35355054 Free PMC article. No abstract available.
-
Landscape of biomolecular condensates in heat stress responses.Front Plant Sci. 2022 Oct 6;13:1032045. doi: 10.3389/fpls.2022.1032045. eCollection 2022. Front Plant Sci. 2022. PMID: 36311142 Free PMC article. Review.
-
Plant adenylate cyclases have come full circle.Nat Plants. 2023 Sep;9(9):1389-1397. doi: 10.1038/s41477-023-01486-x. Epub 2023 Sep 14. Nat Plants. 2023. PMID: 37709954 Review.
References
-
- Anderson P, Kedersha N (2009) RNA granules: post-transcriptional and epigenetic modulators of gene expression. Nat Rev Mol Cell Biol 10: 430–436 - PubMed
-
- Azarashvili T, Krestinina O, Galvita A, Grachev D, Baburina Y, Stricker R, Evtodienko Y, Reiser G (2009) Ca2+-dependent permeability transition regulation in rat brain mitochondria by 2',3'-cyclic nucleotides and 2',3'-cyclic nucleotide 3'-phosphodiesterase. Am J Physiol Cell Physiol 296: C1428–C1439 - PubMed
-
- Buchan JR, Capaldi AP, Parker R (2012) TOR-tured yeast find a new way to stand the heat. Mol Cell 47: 155–157 - PubMed
Publication types
MeSH terms
Substances
LinkOut - more resources
Full Text Sources
Molecular Biology Databases
