. 2022 Jan 15;14(1):3.
doi: 10.1186/s13321-022-00582-y.

LEADD: Lamarckian evolutionary algorithm for de novo drug design

Affiliations

LEADD: Lamarckian evolutionary algorithm for de novo drug design

Alan Kerstjens et al. J Cheminform. .

Abstract

Given an objective function that predicts key properties of a molecule, goal-directed de novo molecular design is a useful tool to identify molecules that maximize or minimize said objective function. Nonetheless, a common drawback of these methods is that they tend to design synthetically unfeasible molecules. In this paper we describe a Lamarckian evolutionary algorithm for de novo drug design (LEADD). LEADD attempts to strike a balance between optimization power, synthetic accessibility of designed molecules and computational efficiency. To increase the likelihood of designing synthetically accessible molecules, LEADD represents molecules as graphs of molecular fragments, and limits the bonds that can be formed between them through knowledge-based pairwise atom type compatibility rules. A reference library of drug-like molecules is used to extract fragments, fragment preferences and compatibility rules. A novel set of genetic operators that enforce these rules in a computationally efficient manner is presented. To sample chemical space more efficiently we also explore a Lamarckian evolutionary mechanism that adapts the reproductive behavior of molecules. LEADD has been compared to both standard virtual screening and a comparable evolutionary algorithm using a standardized benchmark suite and was shown to be able to identify fitter molecules more efficiently. Moreover, the designed molecules are predicted to be easier to synthesize than those designed by other evolutionary algorithms.

Keywords: De novo drug design; Evolutionary algorithm; Fragment-based; Graph-based; Synthetic accessibility.


Conflict of interest statement

Not applicable.

Figures
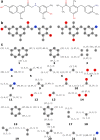
Fig. 1
Fig. 1
Fragmentation example of two molecules. The input molecules (A) are assigned MMFF94 atom types (B). Ring systems and all possible subgraphs from the remaining linkers and side chains of a given size (in this example s ϵ [0 .. 1]) are extracted as fragments (C). The bonds that were cut to extract fragments become connectors, and are represented as three-membered tuples in parenthesis. The number in bold below each fragment is its ID
Fig. 2
Fig. 2
Connection compatibilities of the connections in Fig. 1 according to the strict (A) and lax (B) compatibility definitions. Since in the lax definition the end atom type is irrelevant it is omitted
Fig. 3
Fig. 3
Chromosomal representation of a molecule created through combination of fragments in Fig. 1 using the lax compatibility definition. a Chromosomal meta-graph. Numbered vertices correspond to fragment IDs. Numbers between parenthesis represent connector tuples. Bonds between connectors are represented as rectangles. b The chromosome with fragments shown as their molecular graphs. c Translation of the chromosome to the molecule seen by the user
Fig. 4
Fig. 4
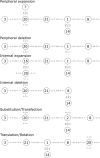
Illustration of the resulting chromosomes after applying each of the eight genetic operators to the chromosome given in Fig. 3a
Fig. 5
Fig. 5
MBPM constructed to query whether a hypothetical fragment with a given set of connectors (left) is compatible with a combination of fragments (right). Black and orange edges represent compatibility relationships. The solution to the MBPM (i.e. the matching) is shown as the orange highlighted edges. Since the cardinality of the matching is equal to the number of flanking fragments our hypothetical fragment is compatible
Fig. 6
Fig. 6
Connection-fragment compatibilities of the fragments in Fig. 1 according to (a) the strict compatibility rules and (b) lax compatibility rules, as described in Fig. 2. Fragment weights are omitted for clarity purposes (Additional file 1: Fig. S2). Fragments are stratified according to their cyclicity, and in the case of the strict compatibility definition (a) also according to how many instances (n) of the connection the fragment has. In (b), “e” denotes any ending atom type. Note that in (a) higher strata are subsets of the lower strata, and that (a) is a subset of (b)
Fig. 7
Fig. 7
Venn diagram of the multiple intersection result for acyclic fragments compatible with the connections combination [(1,1,1), (1,1,1), (7,3,2), (37,3,1)], using the precalculated compatible fragments according to the strict compatibility definition (Fig. 6a)
Fig. 8
Fig. 8
Comparison of designed molecules’ SAScore distributions using different atom typing schemes. Includes molecules of all benchmarks and replicas. Molecules with lower SAScores are predicted to be easier to synthesize
Fig. 9
Fig. 9
LEADD optimization power comparison between atom typing schemes. Benchmark scores range between 0 and 1, with higher scores being better. Boxes represent interquartile ranges (IQR), the black line within them medians and the whiskers Q ± 1.5IQR. Data beyond the whiskers are considered outliers and represented as dots. Colored dots represent maximum benchmark scores
Fig. 10
Fig. 10
Comparison of designed molecules’ SAScore distributions using different atom typing schemes. Includes molecules of all benchmarks and replicas. Molecules with lower SAScores are predicted to be easier to synthesize
Fig. 11
Fig. 11
LEADD optimization power comparison between different combinations of atom typing and fragmentation schemes. Benchmark scores range between 0 and 1, with higher scores being better. Boxes represent interquartile ranges (IQR), the black line within them medians and the whiskers Q ± 1.5IQR. Data beyond the whiskers are considered outliers and represented as dots. Colored dots represent maximum benchmark scores
Fig. 12
Fig. 12
Comparison of designed molecules’ SAScore distributions using different SA optimization strategies. Includes molecules of all benchmarks and replicas. Molecules with lower SAScores are predicted to be easier to synthesize
Fig. 13
Fig. 13
LEADD optimization power comparison using different SA optimization strategies. Benchmark scores range between 0 and 1, with higher scores being better. Boxes represent interquartile ranges (IQR), the black line within them medians and the whiskers Q ± 1.5IQR. Data beyond the whiskers are considered outliers and represented as dots. Colored dots represent maximum benchmark scores
Fig. 14
Fig. 14
Comparison of SAScore distributions between molecules designed by LEADD and GB-GA and those found through a VS. Includes molecules of all benchmarks and replicas. Molecules with lower SAScores are predicted to be easier to synthesize
Fig. 15
Fig. 15
Fraction of top-10 scored molecules per replica synthesizable by LEADD (with different settings), GB-GA and VS in N or less steps using ZINC reactants and USPTO reaction templates, as assessed by AiZynthFinder. Molecules requiring more than 8 synthetic steps are considered not synthesizable
Fig. 16
Fig. 16
Optimization power comparison between LEADD, GB-GA and a VS. Benchmark scores range between 0 and 1, with higher scores being better. Boxes represent interquartile ranges (IQR), the black line within them medians and the whiskers Q ± 1.5IQR. Data beyond the whiskers are considered outliers and represented as dots. Colored dots represent maximum benchmark scores. Note that VS results are deterministic and have null variability
Fig. 17
Fig. 17
Score of best found molecule as a function of the number of scored molecules. For LEADD and GB-GA each line represents a replica. VS results were shuffled 100 times and averaged to account for the effects of molecule screening order. Note that these are individual molecule scores and not population/benchmark scores and therefore don’t correspond to the values in Fig. 16.

Similar articles

Cited by

References

    1. Sterling T, Irwin JJ. ZINC 15—ligand discovery for everyone. J Chem Inf Model. 2015;55:2324–2337. doi: 10.1021/acs.jcim.5b00559. - DOI - PMC - PubMed
    1. Hu Q, Peng Z, Sutton SC, et al. Pfizer global virtual library (PGVL): a chemistry design tool powered by experimentally validated parallel synthesis information. ACS Comb Sci. 2012;14:579–589. doi: 10.1021/co300096q. - DOI - PubMed
    1. Chevillard F, Kolb P. SCUBIDOO: a Large yet screenable and easily searchable database of computationally created chemical compounds optimized toward high likelihood of synthetic tractability. J Chem Inf Model. 2015;55:1824–1835. doi: 10.1021/acs.jcim.5b00203. - DOI - PubMed
    1. Ruddigkeit L, Van Deursen R, Blum LC, Reymond JL. Enumeration of 166 billion organic small molecules in the chemical universe database GDB-17. J Chem Inf Model. 2012;52:2864–2875. doi: 10.1021/ci300415d. - DOI - PubMed
    1. Ertl P. Cheminformatics analysis of organic substituents: identification of the most common substituents, calculation of substituent properties, and automatic identification of drug-like bioisosteric groups. J Chem Inf Comput Sci. 2003;34:374–380. doi: 10.1002/chin.200321198. - DOI - PubMed

LinkOut - more resources