. 2022 Jan 10;20(1):13.
doi: 10.1186/s12915-021-01213-y.

The interactome of CLUH reveals its association to SPAG5 and its co-translational proximity to mitochondrial proteins

Affiliations

The interactome of CLUH reveals its association to SPAG5 and its co-translational proximity to mitochondrial proteins

Mickaële Hémono et al. BMC Biol. .

Abstract

Background: Mitochondria require thousands of proteins to fulfill their essential function in energy production and other fundamental biological processes. These proteins are mostly encoded by the nuclear genome, translated in the cytoplasm before being imported into the organelle. RNA binding proteins (RBPs) are central players in the regulation of this process by affecting mRNA translation, stability, or localization. CLUH is an RBP recognizing specifically mRNAs coding for mitochondrial proteins, but its precise molecular function and interacting partners remain undiscovered in mammals.

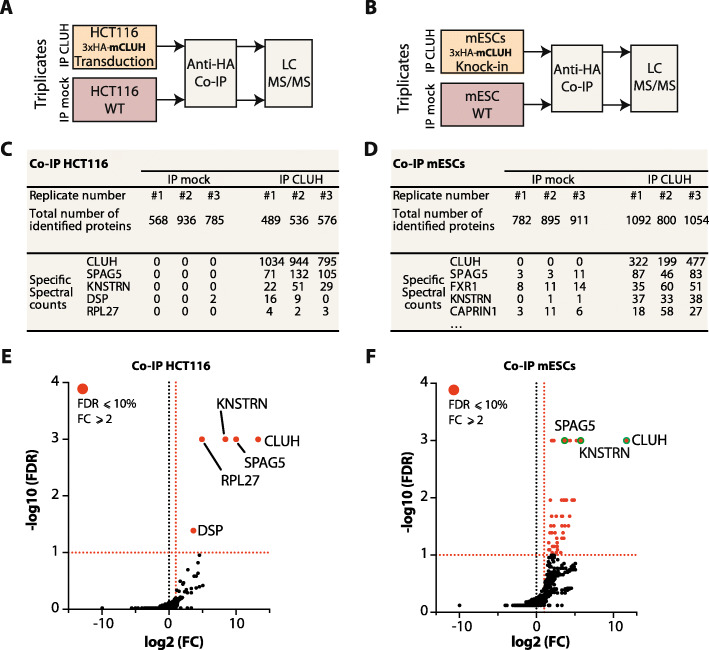
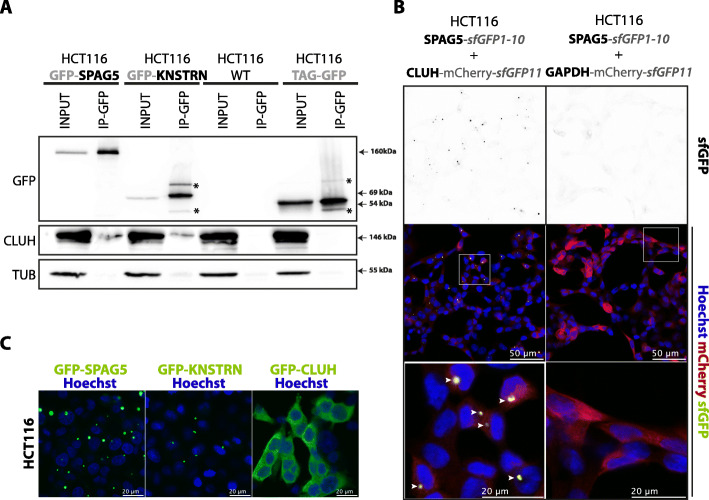
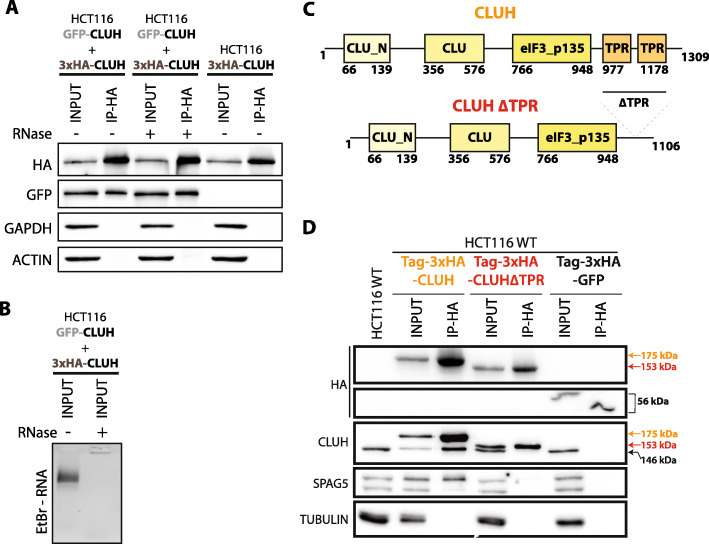
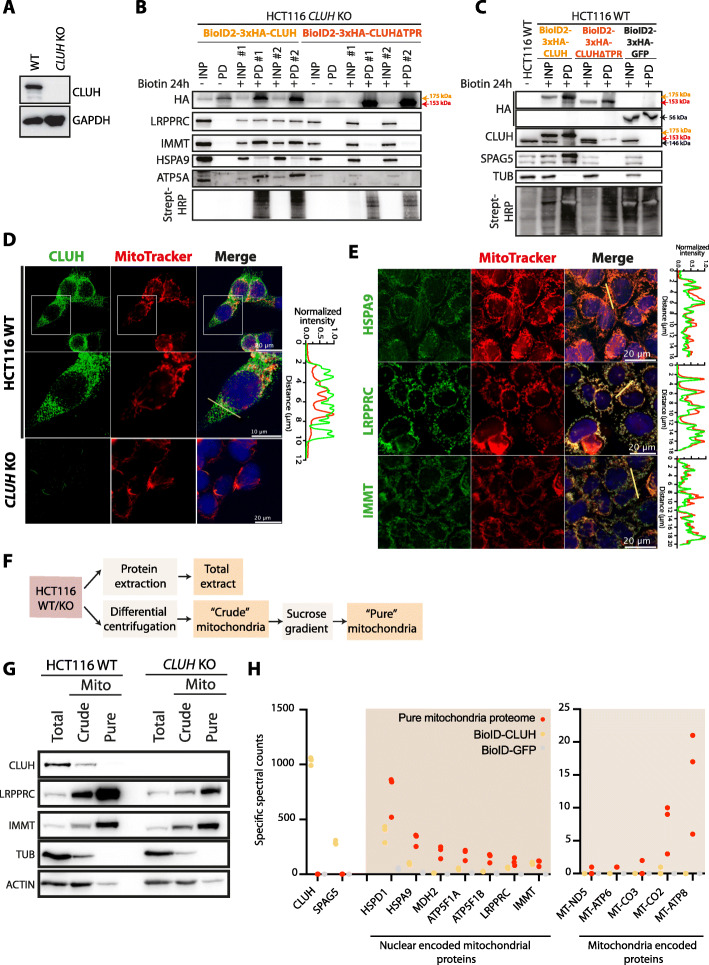
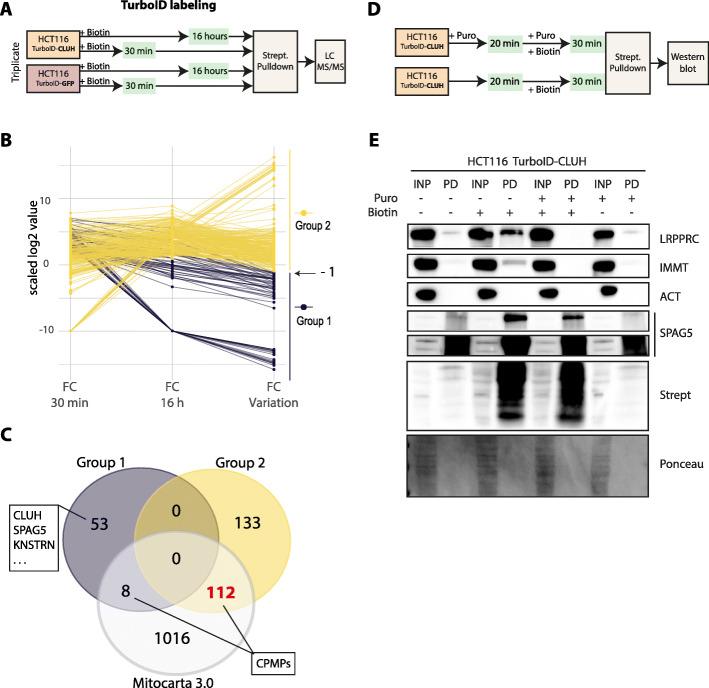
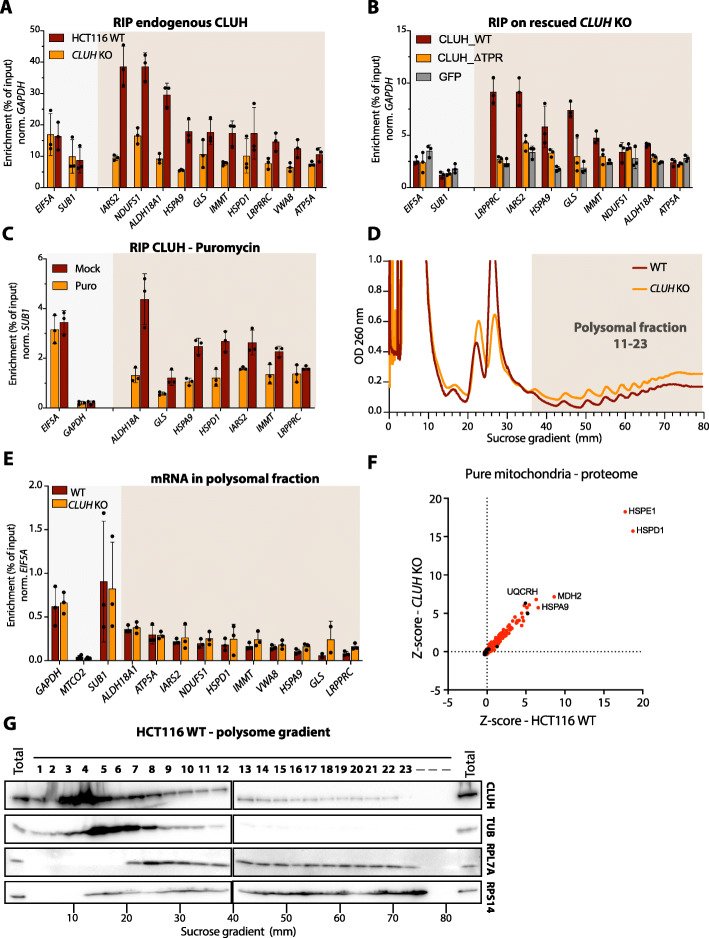
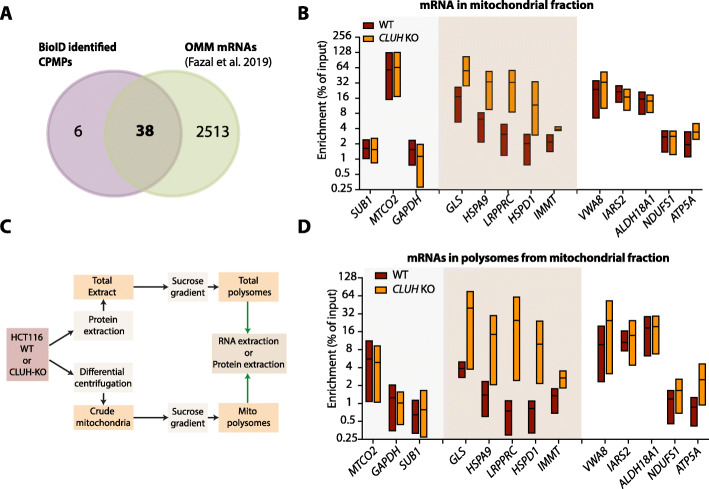
Results: Here we reveal for the first time CLUH interactome in mammalian cells. Using both co-IP and BioID proximity-labeling approaches, we identify novel molecular partners interacting stably or transiently with CLUH in HCT116 cells and mouse embryonic stem cells. We reveal stable RNA-independent interactions of CLUH with itself and with SPAG5 in cytosolic granular structures. More importantly, we uncover an unexpected proximity of CLUH to mitochondrial proteins and their cognate mRNAs in the cytosol. We show that this interaction occurs during the process of active translation and is dependent on CLUH TPR domain.

Conclusions: Overall, through the analysis of CLUH interactome, our study sheds a new light on CLUH molecular function by revealing new partners and by highlighting its link to the translation and subcellular localization of some mRNAs coding for mitochondrial proteins.

Keywords: BioID; CLUH; Localized translation; Nuclear encoded mitochondrial proteins; Proximity labeling; RNA binding proteins; SPAG5; Translation; TurboID.


Conflict of interest statement

The authors declare that they have no competing interests.

Figures

Fig. 1
Fig. 1
Identification of CLUH interactome by co-immunoprecipitation in both HCT116 cells and mESCs. AB Schematic representation of the co-IP experimental design. Co-immunoprecipitated proteins from 3xHA-mCLUH sample (IP CLUH) and control sample (IP mock) are identified by LC-MS/MS. A HCT116 cells are transduced with a lentivirus to express the 3xHA-mCLUH protein. B mESCs are genome-edited to express an endogenous 3xHA-CLUH protein. The mESCs knock-in clone G12 is used (see Fig. S1C). CD Tables summarizing the MS protein identification in HCT116 cells (C) and mESCs (D). Total number of proteins identified by Mascot software with a false discovery rate (FDR) below 1% in IP mock and IP CLUH samples. The five proteins with the highest specific spectral counts in the IP CLUH are shown. Biological replicate samples are numbered from #1 to #3. EF Volcano plots showing the global enrichment of proteins in IP CLUH versus the IP mock. The x-axis shows the log2 fold change (FC) and the y-axis shows the −log10 of the FDR (n=3), obtained using SAINTexpress software [26]. Significantly enriched proteins are shown in red and are defined by a fold change greater than two and a FDR < 0.1 (shown as dashed red line). Selected proteins with the highest spectral count (shown in D) are labeled and identified with a green circle. The full datasets and analysis are available in Table S1 and S2
Fig. 2
Fig. 2
Endogenous CLUH interacts with both SPAG5 and KNSTRN and the CLUH-SPAG5 interaction occurs in cytoplasmic granular structures. A Western blot analysis of co-IP between GFP-tagged KNSTRN or SPAG5 proteins and the endogenous CLUH protein and in HCT116 cells. The co-IP is performed using magnetic beads coupled with anti-GFP antibodies (IP-GFP) on total extracts (INPUT) from cells stably expressing the tagged proteins. Wild-type HCT116 and cells expressing BirA*HA-GFP (TAG-GFP) are used as negative controls. The loaded samples correspond to 1% of the input and 20% of the pulled-down samples. The proteins are revealed using GFP-, CLUH-, and TUBULIN-specific antibodies. TUBULIN is used to control nonspecific binding. Non-specific bands are marked by asterisk (*). B Split-GFP analysis of SPAG5 and CLUH interaction. HCT116 stably expressing SPAG5 fused with sfGFP-1-10 together with CLUH or GAPDH fused with mCherry-sfGFP11 are fixed and analyzed by confocal fluorescent microscopy. Reconstituted sfGFP signal is shown in black (upper panel) and in green (lower panels). The mCherry signal is shown in red and nuclei, stained with Hoechst, are in blue. The colocalization of green and red signal is shown in yellow and indicated with arrows. Scale bar is indicated in white. C Confocal fluorescent microscopy images of HCT116 cells stably expressing GFP fused to SPAG5, KNSTRN, or CLUH. GFP signal is shown in green and nuclei, stained with Hoechst, in blue. Scale bar is indicated in white
Fig. 3
Fig. 3
The TPR domain facilitates CLUH self-interaction and its interaction with SPAG5. A Western blot analysis of co-IP, between GFP- and 3xHA-tagged CLUH proteins stably expressed in HCT116 cells. The IP is performed using magnetic beads coupled with anti-HA antibodies (IP-HA) with protein extracts treated (+) or not (−) with RNaseA/T1. The proteins are detected using anti-HA and anti-GFP antibodies. GAPDH and ACTIN are used as specificity controls. The loaded samples correspond to 0.5% of the input and 20% of the pulled-down samples. B Ethidium bromide-stained agarose gel loaded with RNase treated (+) or non-treated (−) total protein extracts used for the IP showing the presence of ribosomal RNA. C Scheme showing the human CLUH protein domains identified using Pfam database. The amino acid positions of each domain are indicated. The mutant protein CLUH∆TPR has been generated by deleting the TPR domains. D Western blot analysis of co-IP, between 3xHA-tagged wildtype CLUH (in orange) or the CLUH∆TPR mutant (in red) with the endogenous CLUH and SPAG5 proteins. A 30-kDa tag corresponding to the BioID2 protein followed by 3xHA peptide is added in N-terminal (Tag-3xHA) of each transgene. A GFP tagged construct is used as a specificity control. The co-IP is performed on total extracts (INPUT) from HCT116 cells stably expressing the different constructs using magnetic beads coupled with anti-HA antibodies (IP-HA). The size of the endogenous CLUH (black), wildtype transgene (orange), and the delta-TPR mutant (red) is indicated. The indicated proteins are revealed using specific antibodies. TUBULIN Is used as a loading control. The loaded samples correspond to 0.5% of the input and 20% of the pulled-down samples
Fig. 4
Fig. 4
Identification of CLUH proximal proteins using BioID in HCT116 cells. A Schematic representation of the BioID experimental design using HCT116 cells stably expressing the BioID2 protein fused to the mouse CLUH (mCLUH) or GFP proteins. The proximity labeling is performed for 24 h in the presence of 50 μM biotin in the culture medium. Biotinylated proteins, from both the specific (BioID2-CLUH) and control (GFP-BioID2) samples, are isolated using streptavidin-coupled magnetic beads and identified by LC MS/MS. B Table summarizing the MS protein identification from the BioID experiment in HCT116 cells. Total number of proteins identified by Mascot software with a FDR below 1%. The five proteins with the highest specific spectral counts in the BioID2-mCLUH sample are shown. Biological replicate samples are numbered from #1 to #3. The full datasets and analysis are available in Table S3. C Volcano plot showing the global enrichment of proteins in BioID2-CLUH versus the GFP-BioID2 control. The x-axis shows the log2 fold change (FC), and the y-axis shows the −log10 of the false discovery rate (n=3), obtained using SAINTexpress software [26]. Significantly enriched proteins are shown in red and are defined by a fold change greater than two and a FDR < 0.1 (shown as dashed red lines). The five proteins with the highest spectral count (shown in B) are labeled and identified with a green circle. D Manhattan plot illustrating the gene ontology and pathway enrichment analysis of proteins identified in BioID experiment, generated using G:profiler tool [32]. The functional terms, associated with the protein list, are grouped in four categories: GO: MF (Molecular Function), GO: CC (Cellular Component), GO: BP (Biological Process), and KEGG pathways. The y-axis shows the adjusted enrichment p values in the negative log10 scale. The circle sizes are in accordance with the corresponding term size (i.e. larger terms have larger circles) and terms from the same GO subtree are located close to each other on the x-axis. The most significantly enriched terms are labeled. E Visualization of the functional interaction network of CLUH proximal proteins identified by BioID, generated with the Cytoscape StringApp [33]. The proteins have been grouped according to three most represented functional categories: “Cytoskeleton related”, “Translation” and “Mitochondrial proteins”. The confidence score of each interaction is mapped to the edge thickness and opacity. The size of the node relates to the enrichment in log2 fold change (log2FC) over the BioID-GFP background control. The protein abundance in the BioID2-CLUH sample is illustrated by a color scale and corresponds to the specific spectral count normalized to the protein size. Proteins with mitochondrial targeting sequences (MTS) according to Uniprot database are highlighted in red
Fig. 5
Fig. 5
CLUH proximity to mitochondrial proteins occurs in the cytosol and requires the TPR domain. A Western blot showing the expression of CLUH in HCT116 cells wild type (WT) and knockout for CLUH (CLUH KO). Indicated proteins are revealed using specific antibodies. B, C Western blot analysis of BioID experiments performed on CLUH KO cells (B) and on WT HCT116 cells (C) transduced to stably express BioID2-3xHA-CLUH, BioID-3xHA-CLUH∆TPR, or BioID2-3xHA-GFP proteins. The proximity labeling is performed for 24 h in the presence of 50 μM biotin in the culture medium. Biotinylated proteins are pulled down (PD) from total input extracts (INP) using streptavidin-coupled magnetic beads. The loaded samples correspond to 0.5% of the input and 20% of the pulled-down samples. Replicate experiments are identified with #1 and #2. The constructs are revealed with anti-HA antibody (HA). CPMPs (LRPPRC, IMMT, HSPA9 and ATP5A) and other indicated proteins are revealed using specific antibodies. The size of the endogenous CLUH (black), wildtype transgene (orange) and the delta-TPR mutant (red) is indicated. Biotinylated proteins are revealed using HRP-coupled streptavidin. D, E Immunofluorescence confocal imaging on HCT116 fixed cells showing the subcellular localization of CLUH (D) and three CLUH proximal proteins (E). The endogenous proteins are detected using specific primary antibodies and revealed using Alexa488-coupled secondary antibodies (green). Mitochondria (red) are labeled using MitoTracker™ Red CMXRos. Nuclei (blue) are stained with Hoechst. CLUH KO cells are used as control. The fluorescence profile of the red and green channel over the indicated pixel lines are shown on the right. The fluorescence signal is normalized to the highest value for each channel. F Schematic representation of the experimental workflow to obtain both “crude” and “pure” mitochondria. G Western blot on total “crude” and “pure” mitochondrial fractions from wild-type and CLUH KO HCT116 cells. Indicated proteins are revealed using specific antibodies. H Scatter plot showing the abundance (specific spectral counts) of nuclear and mitochondrial encoded proteins identified by MS from pure mitochondrial fraction (red), BioID2-CLUH (orange) and GFP-BioID2 (gray) samples. Each dot represents a biological replicate sample. The full datasets are available in Table S6
Fig. 6
Fig. 6
CLUH-proximal mitochondrial proteins accumulate overtime in a translation-dependent manner. A Schematic representation of the TurboID experimental design using HCT116 cells stably expressing the TurboID protein fused to CLUH or GFP proteins. The proximity labeling is performed for 30 min or 16 h in the presence of 50 μM biotin in the culture medium. Biotinylated proteins, from both the specific (TurboID-CLUH) and control (TurboID-GFP-BioID2) samples, are isolated using streptavidin-coupled magnetic beads and identified by LC-MS/MS. B Parallel coordinates plot comparing the fold change (FC) enrichment of TurboID identified proteins at 30 min and 16 h (n=3 and threshold: FDR<0.1 and FC >2, Fig. S5 C and D). The FC variation corresponds to the ratio of FC between 30 min and 16h. The y-axis corresponds to the log2 transformed values. Group 1 (purple) is defined as containing proteins with a FC ratio < 0.5 and group 2 (yellow) as protein with FC variation >=0.5. The full datasets and analysis are available in Table S7. C Venn diagram showing the intersection between group 1 (purple), group 2 (yellow), and human mitochondrial proteins (gray) listed in Mitocarta 3.0 database. D Schematic representation of the TurboID experimental design using HCT116 cells stably expressing the TurboID protein fused to CLUH in translation inhibition conditions. Cells are pre-treated with 100μg/mL of puromycin for 20 min prior to biotin pulse labeling. The proximity labeling is performed for 30 min in the presence of 50 μM biotin in the culture medium. E Streptavidin enriched proteins are analyzed by western blot. Biotinylated proteins are pulled down (PD) from total input extracts (INP) using streptavidin-coupled magnetic beads. The loaded samples correspond to 0.5% of the input and 20% of the pulled-down samples. The CPMPs (LRPPRC, IMMT) and other indicated proteins are revealed using specific antibodies. Two different exposures for SPAG5 are shown. Biotinylated proteins are revealed using HRP-coupled streptavidin
Fig. 7
Fig. 7
CLUH requires active translation to bind mRNAs coding for mitochondrial proteins and does not affect their translation efficiency. A RT-qPCR analysis of RNA immunoprecipitation (RIP) experiments performed on the endogenous CLUH protein in wild-type HCT116 (red) and CLUH KO (orange) cells. B RT-qPCR analysis of RIP experiments performed on rescued HCT116 CLUH KO cells. The cells are transduced to stably express either the tagged wildtype CLUH (CLUH_WT, red) or the tagged mutant CLUH (CLUH_∆TPR, yellow). Cells expressing a tagged GFP protein (GFP, gray) are used as background control. C RT-qPCR analysis of RIP experiment performed on wild-type HCT116 cells in translation inhibition conditions. Cells are treated with 100μg/mL of puromycin (Puro) or not (mock). AC The CLUH associated mRNAs are enriched using CLUH-specific antibodies and measured by RT-qPCR. The enrichment of specific mRNA (normalized to GAPDH or SUB1 levels) is calculated relative to the input sample (% of input). mRNAs coding for CPMPs are highlighted by the orange shadow. The error bars correspond to the standard deviation of three independent experiments. The average value for each replicate is indicated by a dot. D Representative graphs of polysome profilings of WT and CLUH KO HCT116 cells. The y-axis corresponds to the absorbance at 260 nm and the x-axis to the distance in the sucrose gradient. The polysomal fractions used for further experiments are highlighted by the orange shadow. E RT-qPCR analysis of mRNA in polysomal fractions from the WT and CLUH KO cells. The enrichment of specific mRNA (normalized to EIF5A levels) is calculated relative to the input sample (% of input). The error bars correspond to the standard deviation of three independent experiments. The average value for each replicate is indicated by a dot. mRNAs coding for CPMPs are highlighted in orange. F Scatter plot comparing the abundance of all proteins identified by mass spectrometry in pure mitochondrial fraction (see Fig. 4F) of CLUH KO and WT HCT1116 cells. The x-axis and the y-axis show to the Z-score of the mean abundance of each protein in the WT HCT116 and CLUH KO samples, respectively. The abundance of each protein is calculated by dividing the mean spectral count of three replicate samples by the protein size. Proteins found in the Mitocarta 3.0 database are shown in red. The full dataset is available in Table S6. (G) Representative western blot analysis of polysome profiling of WT HCT116 cells. Each fraction corresponds to 3.3 mm of the sucrose gradient and fractions are numbered from 1 to 23. Total protein extracts are used as controls. Indicated proteins are revealed using specific antibodies
Fig. 8
Fig. 8
CLUH affects the subcellular distribution of some mRNAs coding for mitochondrial proteins. A Venn diagram depicting the intersection between mitochondrial CPMPs (purple) (see Fig. 4E) and the mRNAs identified by APEX-seq at the mitochondrial outer membrane (OMM) (green) [6]. Mitochondrial proteins are selected according to their presence in the Mitocarta 3.0 database. The OMM localized mRNAs correspond to OMM biotinylated mRNA in the presence of cycloheximide significantly enriched above the background (FDR < 10%) and positively enriched (log2FC >0) over non-specific cytosolic biotinylation. B Graph showing RT-qPCR analysis of mRNA enrichment in crude mitochondrial fraction from CLUH KO (orange) and WT HCT116 cells (red). The enrichment of specific mRNA (normalized to EIF5A levels) is calculated relative to the total RNA from non-fractionated input sample (% of input) and shown on log2 scaled y-axis. The box summarizes triplicate experiments, showing the upper, the lowest, and mean enrichment values. mRNAs showing the highest variation between WT and CLUH KO are highlighted by the orange shadow. C Schematic representation of the experimental workflow to extract RNA and proteins from polysomal fractions from both total and “crude” mitochondrial fractions. D Graph showing RT-qPCR analysis of mRNA enrichment in the polysomes from crude mitochondrial fraction in CLUH KO (orange) and WT HCT116 cells (red). The enrichment of specific mRNA (normalized to EIF5A levels) is calculated relative the total RNA from non-fractionated input sample (% of input) and shown on log2 scaled y-axis. The box summarizes triplicate experiments, showing the upper, the lowest, and mean enrichment values. mRNAs showing the highest variation between WT and CLUH KO are highlighted by the orange shadow

Similar articles

Cited by

References

    1. Friedman JR, Nunnari J. Mitochondrial form and function. Nature. 2014;505(7483):335–343. doi: 10.1038/nature12985. - DOI - PMC - PubMed
    1. Rath S, Sharma R, Gupta R, Ast T, Chan C, Durham TJ, et al. MitoCarta3.0: an updated mitochondrial proteome now with sub-organelle localization and pathway annotations. Nucleic Acids Res. 2021;49:D1541–D1547. doi: 10.1093/nar/gkaa1011. - DOI - PMC - PubMed
    1. Bykov YS, Rapaport D, Herrmann JM, Schuldiner M. Cytosolic Events in the Biogenesis of Mitochondrial Proteins. Trends Biochem Sci. 2020;45(8):650–667. doi: 10.1016/j.tibs.2020.04.001. - DOI - PubMed
    1. Béthune J, Jansen R-P, Feldbrügge M, Zarnack K. Membrane-Associated RNA-Binding Proteins Orchestrate Organelle-Coupled Translation. Trends Cell Biol. 2019;29(2):178–188. doi: 10.1016/j.tcb.2018.10.005. - DOI - PubMed
    1. Lesnik C, Golani-Armon A, Arava Y. Localized translation near the mitochondrial outer membrane: An update. RNA Biol. 2015;12(8):801–809. doi: 10.1080/15476286.2015.1058686. - DOI - PMC - PubMed

Publication types

LinkOut - more resources