Differential Co-Expression Network Analysis Reveals Key Hub-High Traffic Genes as Potential Therapeutic Targets for COVID-19 Pandemic
- PMID: 34975885
- PMCID: PMC8714803
- DOI: 10.3389/fimmu.2021.789317
Differential Co-Expression Network Analysis Reveals Key Hub-High Traffic Genes as Potential Therapeutic Targets for COVID-19 Pandemic
Abstract
Background: The recent emergence of COVID-19, rapid worldwide spread, and incomplete knowledge of molecular mechanisms underlying SARS-CoV-2 infection have limited development of therapeutic strategies. Our objective was to systematically investigate molecular regulatory mechanisms of COVID-19, using a combination of high throughput RNA-sequencing-based transcriptomics and systems biology approaches.
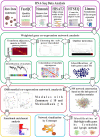
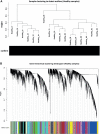
Methods: RNA-Seq data from peripheral blood mononuclear cells (PBMCs) of healthy persons, mild and severe 17 COVID-19 patients were analyzed to generate a gene expression matrix. Weighted gene co-expression network analysis (WGCNA) was used to identify co-expression modules in healthy samples as a reference set. For differential co-expression network analysis, module preservation and module-trait relationships approaches were used to identify key modules. Then, protein-protein interaction (PPI) networks, based on co-expressed hub genes, were constructed to identify hub genes/TFs with the highest information transfer (hub-high traffic genes) within candidate modules.
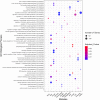
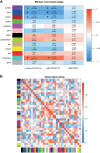
Results: Based on differential co-expression network analysis, connectivity patterns and network density, 72% (15 of 21) of modules identified in healthy samples were altered by SARS-CoV-2 infection. Therefore, SARS-CoV-2 caused systemic perturbations in host biological gene networks. In functional enrichment analysis, among 15 non-preserved modules and two significant highly-correlated modules (identified by MTRs), 9 modules were directly related to the host immune response and COVID-19 immunopathogenesis. Intriguingly, systemic investigation of SARS-CoV-2 infection identified signaling pathways and key genes/proteins associated with COVID-19's main hallmarks, e.g., cytokine storm, respiratory distress syndrome (ARDS), acute lung injury (ALI), lymphopenia, coagulation disorders, thrombosis, and pregnancy complications, as well as comorbidities associated with COVID-19, e.g., asthma, diabetic complications, cardiovascular diseases (CVDs), liver disorders and acute kidney injury (AKI). Topological analysis with betweenness centrality (BC) identified 290 hub-high traffic genes, central in both co-expression and PPI networks. We also identified several transcriptional regulatory factors, including NFKB1, HIF1A, AHR, and TP53, with important immunoregulatory roles in SARS-CoV-2 infection. Moreover, several hub-high traffic genes, including IL6, IL1B, IL10, TNF, SOCS1, SOCS3, ICAM1, PTEN, RHOA, GDI2, SUMO1, CASP1, IRAK3, HSPA5, ADRB2, PRF1, GZMB, OASL, CCL5, HSP90AA1, HSPD1, IFNG, MAPK1, RAB5A, and TNFRSF1A had the highest rates of information transfer in 9 candidate modules and central roles in COVID-19 immunopathogenesis.
Conclusion: This study provides comprehensive information on molecular mechanisms of SARS-CoV-2-host interactions and identifies several hub-high traffic genes as promising therapeutic targets for the COVID-19 pandemic.
Keywords: COVID-19 pandemic; WGCNA; hub-high traffic genes; immunopathogenesis; systems biology; systems immunology; therapeutic targets in infectious diseases.
Copyright © 2021 Hasankhani, Bahrami, Sheybani, Aria, Hemati, Fatehi, Ghaem Maghami Farahani, Javanmard, Rezaee, Kastelic and Barkema.
Conflict of interest statement
The authors declare that the research was conducted in the absence of any commercial or financial relationships that could be construed as a potential conflict of interest.
Figures


Similar articles
-
In-depth systems biological evaluation of bovine alveolar macrophages suggests novel insights into molecular mechanisms underlying Mycobacterium bovis infection.Front Microbiol. 2022 Nov 30;13:1041314. doi: 10.3389/fmicb.2022.1041314. eCollection 2022. Front Microbiol. 2022. PMID: 36532492 Free PMC article.
-
Integrated Network Analysis to Identify Key Modules and Potential Hub Genes Involved in Bovine Respiratory Disease: A Systems Biology Approach.Front Genet. 2021 Oct 18;12:753839. doi: 10.3389/fgene.2021.753839. eCollection 2021. Front Genet. 2021. PMID: 34733317 Free PMC article.
-
Hub genes identification and validation of ferroptosis in SARS-CoV-2 induced ARDS: perspective from transcriptome analysis.Front Immunol. 2024 Aug 7;15:1407924. doi: 10.3389/fimmu.2024.1407924. eCollection 2024. Front Immunol. 2024. PMID: 39170609 Free PMC article.
-
Molecular pathways involved in COVID-19 and potential pathway-based therapeutic targets.Biomed Pharmacother. 2022 Jan;145:112420. doi: 10.1016/j.biopha.2021.112420. Epub 2021 Nov 12. Biomed Pharmacother. 2022. PMID: 34801852 Free PMC article. Review.
-
Transcriptomics and RNA-Based Therapeutics as Potential Approaches to Manage SARS-CoV-2 Infection.Int J Mol Sci. 2022 Sep 21;23(19):11058. doi: 10.3390/ijms231911058. Int J Mol Sci. 2022. PMID: 36232363 Free PMC article. Review.
Cited by
-
Identification and evaluation of candidate COVID-19 critical genes and medicinal drugs related to plasma cells.BMC Infect Dis. 2024 Oct 3;24(1):1099. doi: 10.1186/s12879-024-10000-3. BMC Infect Dis. 2024. PMID: 39363208 Free PMC article.
-
Shared miRNA landscapes of COVID-19 and neurodegeneration confirm neuroinflammation as an important overlapping feature.Front Mol Neurosci. 2023 Mar 17;16:1123955. doi: 10.3389/fnmol.2023.1123955. eCollection 2023. Front Mol Neurosci. 2023. PMID: 37008787 Free PMC article.
-
Navigating the Gene Co-Expression Network and Drug Repurposing Opportunities for Brain Disorders Associated with Neurocognitive Impairment.Brain Sci. 2023 Nov 7;13(11):1564. doi: 10.3390/brainsci13111564. Brain Sci. 2023. PMID: 38002524 Free PMC article.
-
Gene network inference from single-cell omics data and domain knowledge for constructing COVID-19-specific ICAM1-associated pathways.Front Genet. 2023 Aug 31;14:1250545. doi: 10.3389/fgene.2023.1250545. eCollection 2023. Front Genet. 2023. PMID: 37719701 Free PMC article.
-
Application of Virtual Drug Study to New Drug Research and Development: Challenges and Opportunity.Clin Pharmacokinet. 2024 Sep;63(9):1239-1249. doi: 10.1007/s40262-024-01416-w. Epub 2024 Sep 3. Clin Pharmacokinet. 2024. PMID: 39225885 Review.
References
MeSH terms
Substances
LinkOut - more resources
Full Text Sources
Other Literature Sources
Medical
Research Materials
Miscellaneous

