

Comparisons of α2-Adrenergic Agents, Medetomidine and Xylazine, with Pentobarbital for Anesthesia: Important Pitfalls in Diabetic and Nondiabetic Rats
- PMID: 34964655
- PMCID: PMC8971989
- DOI: 10.1089/jop.2021.0084
Comparisons of α2-Adrenergic Agents, Medetomidine and Xylazine, with Pentobarbital for Anesthesia: Important Pitfalls in Diabetic and Nondiabetic Rats
Abstract
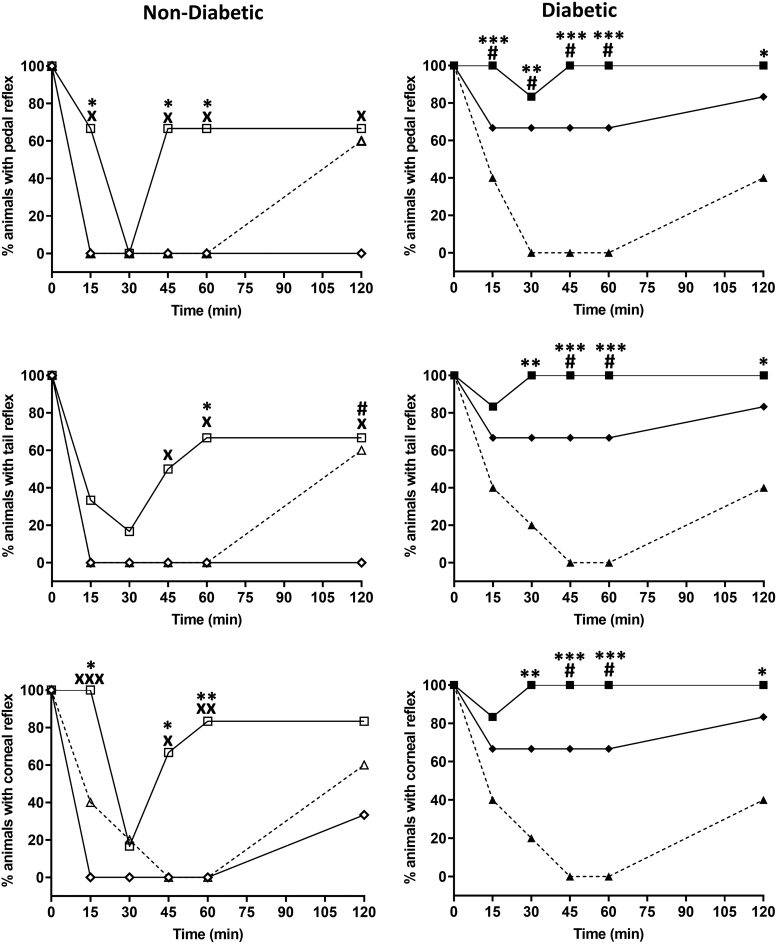
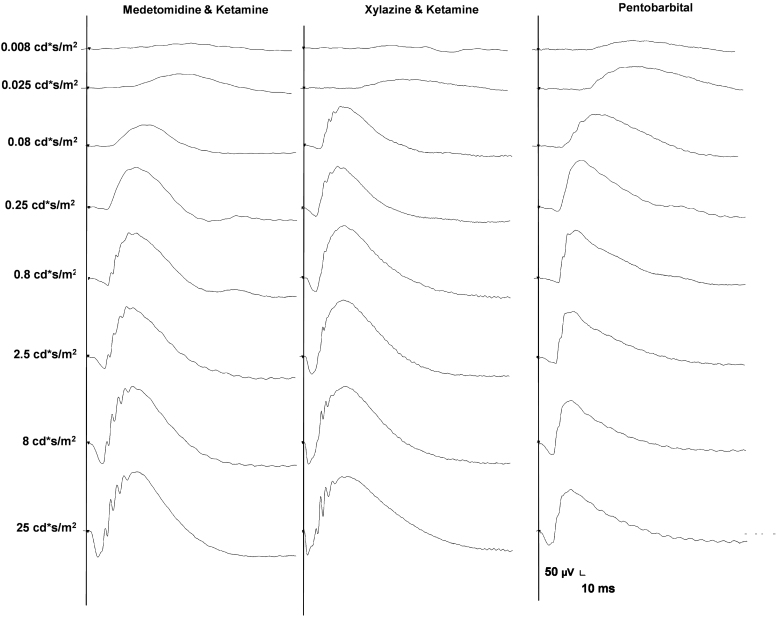
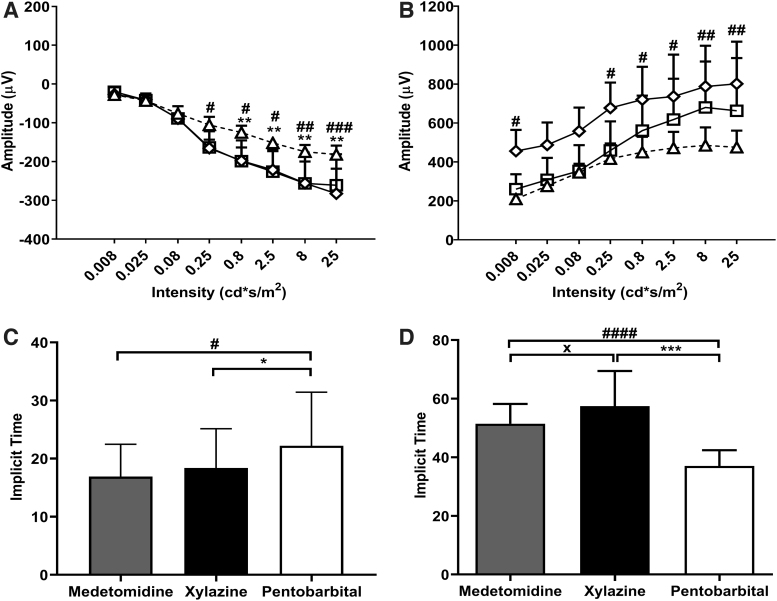
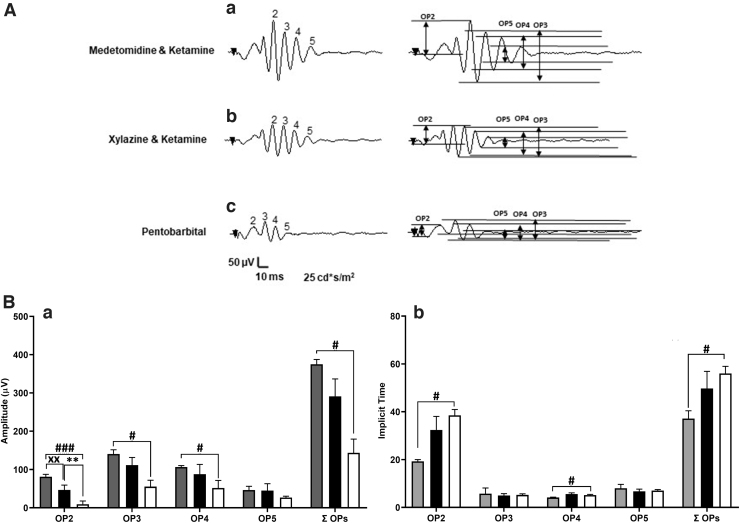
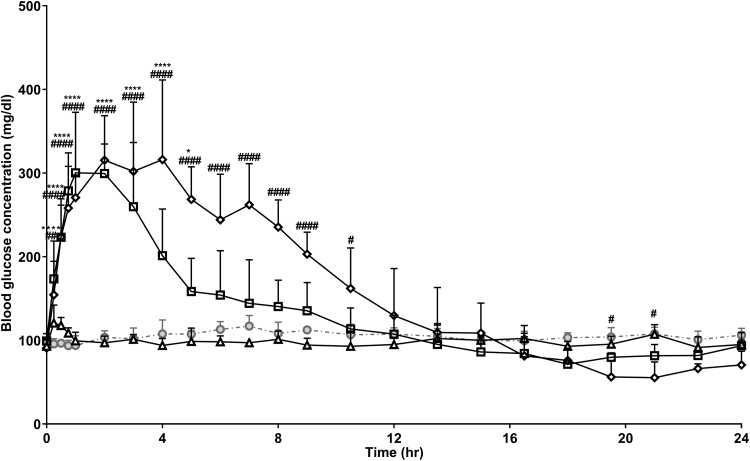
Purpose: Anesthesia is necessary to conduct rodent electroretinograms (ERGs). We evaluated utility of the α2-agonist medetomidine versus xylazine for ERG studies in nondiabetic and diabetic rats. Pentobarbital was included as a comparator. Methods: Male Sprague-Dawley rats, with and without streptozotocin (STZ)-induced diabetes, were anesthetized with medetomidine (1 mg/kg), xylazine (10 mg/kg) (both with ketamine 75 mg/kg), or pentobarbital (70 mg/kg). The depth of anesthesia was assessed, and if adequate, scotopic ERGs were recorded. Blood glucose was monitored. Results: In nondiabetic rats, all three agents induced satisfactory anesthesia, but with differing durations: medetomidine > pentobarbital > xylazine. ERG responses were similar under medetomidine and xylazine, but relatively reduced under pentobarbital. Both α2-agonists (but not pentobarbital) elicited marked hyperglycemia (peak values 316.1 ± 42.6 and 300.3 ± 29.5 mg/dL, respectively), persisting for 12 h. In diabetic rats, elevated blood glucose concentrations were not affected by any of the agents, but the depth of anesthesia under medetomidine and xylazine was inadequate for ERG recording. Conclusions: In nondiabetic rats, medetomidine and xylazine elicited comparable effects on ERGs that differ from pentobarbital, but both perturbed glucose metabolism, potentially confounding experimental outcomes. In STZ-diabetic rats, neither α2-agent provided adequate anesthesia, while pentobarbital did so. Problems with α2-anesthetic agents, including medetomidine, must be recognized to ensure meaningful interpretation of experimental results.
Keywords: anesthesia; diabetes; electroretinogram; hyperglycemia; medetomidine; α2 adrenoceptor.
Conflict of interest statement
No competing financial interests exist.
Figures
Similar articles
-
Comparison of the effects of xylazine bolus versus medetomidine constant rate infusion on the stress response, urine production, and anesthetic recovery characteristics in horses anesthetized with isoflurane.J Am Vet Med Assoc. 2012 Apr 15;240(8):998-1002. doi: 10.2460/javma.240.8.998. J Am Vet Med Assoc. 2012. PMID: 22471830 Clinical Trial.
-
Comparison of the effects of xylazine bolus versus medetomidine constant rate infusion on cardiopulmonary function and depth of anesthesia in horses anesthetized with isoflurane.J Am Vet Med Assoc. 2012 Apr 15;240(8):991-7. doi: 10.2460/javma.240.8.991. J Am Vet Med Assoc. 2012. PMID: 22471829 Clinical Trial.
-
Acute hyperglycemia induced by ketamine/xylazine anesthesia in rats: mechanisms and implications for preclinical models.Exp Biol Med (Maywood). 2005 Nov;230(10):777-84. doi: 10.1177/153537020523001012. Exp Biol Med (Maywood). 2005. PMID: 16246906
-
Effect of the α2 -receptor agonists medetomidine, detomidine, xylazine, and romifidine on the ketamine metabolism in equines assessed with enantioselective capillary electrophoresis.Electrophoresis. 2017 Aug;38(15):1895-1904. doi: 10.1002/elps.201700017. Epub 2017 Mar 20. Electrophoresis. 2017. PMID: 28251651
-
[Old and new alpha 2-adrenoceptor agonists. 1. Xylazine and medetomidine].Tierarztl Prax. 1992 Oct;20(5):447-58. Tierarztl Prax. 1992. PMID: 1359676 Review. German.
Cited by
-
Quantitative study of spatial and temporal variation in retinal capillary network perfusion in rat eye by in vivo confocal imaging.Sci Rep. 2023 Nov 2;13(1):18923. doi: 10.1038/s41598-023-44480-1. Sci Rep. 2023. PMID: 37919331 Free PMC article.
-
Effects of vatinoxan in rats sedated with a combination of medetomidine, midazolam and fentanyl.Acta Vet Scand. 2024 May 31;66(1):23. doi: 10.1186/s13028-024-00744-y. Acta Vet Scand. 2024. PMID: 38822394 Free PMC article.
-
The impact of stress and anesthesia on animal models of infectious disease.Front Vet Sci. 2023 Feb 2;10:1086003. doi: 10.3389/fvets.2023.1086003. eCollection 2023. Front Vet Sci. 2023. PMID: 36816193 Free PMC article. Review.
-
Determination of the Effects of Ankaferd Wound Dressing on the Wound Healing Process in Rats.Turk J Pharm Sci. 2024 May 14;21(2):95-103. doi: 10.4274/tjps.galenos.2023.03746. Turk J Pharm Sci. 2024. PMID: 38742756 Free PMC article.
-
Extensive topographic remapping and functional sharpening in the adult rat visual pathway upon first visual experience.PLoS Biol. 2023 Aug 17;21(8):e3002229. doi: 10.1371/journal.pbio.3002229. eCollection 2023 Aug. PLoS Biol. 2023. PMID: 37590177 Free PMC article.
References
-
- Perlman, I. The electroretinogram: ERG. In: Kolb, H., Fernandez, E., and Nelson, R., eds. Webvision: The Organization of the Retina and Visual System. Salt Lake City (UT): University of Utah Health Sciences Center; 1995. - PubMed
-
- Li, Q., Zemel, E., Miller, B., et al. . Early retinal damage in experimental diabetes: electroretinographical and morphological observations. Exp. Eye Res. 74:615–625, 2002. - PubMed
-
- Sergeys, J., Etienne, I., Van Hove, I., et al. . Longitudinal in vivo characterization of the streptozotocin-induced diabetic mouse model: focus on early inner retinal responses. Invest. Ophthalmol. Vis. Sci. 60:807–822, 2019. - PubMed
-
- Stokes, E.L., Flecknell, P.A., and Richardson, C.A.. Reported analgesic and anaesthetic administration to rodents undergoing experimental surgical procedures. Lab. Anim. 43:149–154, 2009. - PubMed
Publication types
MeSH terms
Substances
LinkOut - more resources
Full Text Sources
Medical
