. 2021 Dec 10;8(12):210.
doi: 10.3390/bioengineering8120210.

Tryptophan Production Maximization in a Fed-Batch Bioreactor with Modified E. coli Cells, by Optimizing Its Operating Policy Based on an Extended Structured Cell Kinetic Model

Affiliations

Tryptophan Production Maximization in a Fed-Batch Bioreactor with Modified E. coli Cells, by Optimizing Its Operating Policy Based on an Extended Structured Cell Kinetic Model

Gheorghe Maria et al. Bioengineering (Basel). .

Abstract

Hybrid kinetic models, linking structured cell metabolic processes to the dynamics of macroscopic variables of the bioreactor, are more and more used in engineering evaluations to derive more precise predictions of the process dynamics under variable operating conditions. Depending on the cell model complexity, such a math tool can be used to evaluate the metabolic fluxes in relation to the bioreactor operating conditions, thus suggesting ways to genetically modify the microorganism for certain purposes. Even if development of such an extended dynamic model requires more experimental and computational efforts, its use is advantageous. The approached probative example refers to a model simulating the dynamics of nanoscale variables from several pathways of the central carbon metabolism (CCM) of Escherichia coli cells, linked to the macroscopic state variables of a fed-batch bioreactor (FBR) used for the tryptophan (TRP) production. The used E. coli strain was modified to replace the PTS system for glucose (GLC) uptake with a more efficient one. The study presents multiple elements of novelty: (i) the experimentally validated modular model itself, and (ii) its efficiency in computationally deriving an optimal operation policy of the FBR.

Keywords: cell structured kinetic model; fed-batch bioreactor optimization; glycolysis; hybrid modular model; modified E. coli; tryptophan synthesis.


Conflict of interest statement

The authors declare that they have no known competing financial interests or personal relationships that could have appeared to influence the work reported in this paper. The authors confirm that his paper has no conflict of interest of any kind and of any nature. While the advice and the information in this work are believed to be true and accurate at the date of publication, the entire responsibility for the work content lies with the authors. The authors’ institutions have no responsibility for the content of this work.

Figures

Figure 3
Figure 3
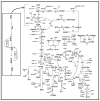
Simplified structured reaction pathway in E. coli for glycolysis (after Maria [48]), and for the TRP synthesis (the gray area) (after Maria et al. [35,37,48]). This reaction pathway was used by Maria et al. [34,37] to derive a TRP synthesis kinetic model. Connection of the TRP synthesis to glycolysis is realized through the PEP node [33,37]. The modular model structure also includes the synthesis of adenosine cometabolites ATP, ADP, and AMP, as part of the ATP recovery system (the pink rectangle in the figure). Notations: GLC(ex)= glucose in the cell environment. Species abbreviations are given in the abbreviations list. Species in parenthesis are not explicitly included in the glycolysis model. Italic letters denote the enzymes. Squares include notations of enzymatic reactions V1–V6 included in the glycolysis model (Table 2 and Table 3). Adapted from [48] with the courtesy of CABEQ Jl., and completed according to the Maria [35] kinetic model.
Figure 4
Figure 4
Model-based predictions of the tryptophan (Trp) concentration dynamics in the same FBR using the modified E. coli T5 strain, but operated in two alternatives: (i) (2, black) optimal operation derived in this paper (i.e., variable fed [GLC] and variable feed flow rate), or (ii) (1, blue) simulations [35] and the experimental data (●, blue) of Chen [74] for the nominal, nonoptimal operation of Table 1, with a constant fed [GLC] and a constant feed flow rate. (Left corner) A simplified scheme of the used FBR with suspended biomass (small points).
Figure 5
Figure 5
Model-based simulated trajectories (-) for the glycolytic key species (PYR, F6P, FDP, ATP, and PEP) in the modified E. coli T5 strain for the FBR operated in two alternatives: (i) (2, black) optimal operation derived in this paper (variable fed [GLC] and variable feed flow rate), and (ii) (1, blue) the experimental data (●, blue) of Chen [71] recorded under nominal, nonoptimal operation of Table 1, with a constant fed [GLC] and a constant feed flow rate. Species abbreviations are given in the abbreviations list.
Figure 6
Figure 6
Model-based simulated trajectories (-) for the key species involved in the TRP operon expression module (TRP, OR, mRNA, and E) in the modified E. coli T5 strain for the FBR operated in two alternatives: (i) (2, black) optimal operation derived in this paper (variable fed [GLC] and variable feed flow rate), and (ii) (1, blue) under nominal, nonoptimal operation of Table 1, with a constant fed [GLC] and a constant feed flow-rate. Species abbreviations are given in the abbreviations list.
Figure 7
Figure 7
Top curves. The time stepwise optimal feeding policy (2, black) of the GLC concentration in the bioreactor cglc,jfeed (j = 1, …, 5 time-arcs), derived in this paper (variable fed [GLC] and variable feed flow rate). Comparison is made with the experimental FBR (1, blue) operated under the nominal (nonoptimal) operating conditions of Table 1, with a constant feed flow rate, and with a constant GLC concentration in the feed. Both cases use the same modified E. coli T5 strain. (Bottom curves). Model-based simulated trajectories (—) of glucose (GLC) in the bioreactor bulk for the FBR operated in two alternatives: (i) (2, black) optimal operation derived in this paper (variable fed [GLC] and variable feed flow rate), and (ii) (1, blue) experimental data (●, blue) of Chen [71] derived under nominal, nonoptimal operation of Table 1, with a constant fed [GLC] and a constant feed flow rate.
Figure 8
Figure 8
(a). The time stepwise optimal policy of the feed flow-rate (FL), (j = 1, …, 5 time-arcs) in the bioreactor (—) for the FBR operated in two alternatives: (i) (2, black) optimal operation derived in this paper (variable fed [GLC] and variable feed flow rate), and (ii) (1, blue) trajectories under nominal, nonoptimal operation of (Table 1), with a constant fed [GLC] and a constant feed flow rate. Both cases use the same modified E. coli T5 strain. (b) The liquid volume (VL) dynamics in two alternatives: (i) using the optimal policy of the variable feed flow rate (FL) in the bioreactor (2, black) derived in this paper, or (ii) using (1, blue) the nonoptimally operated FBR under the nominal conditions of Table 1, with a constant fed [GLC] and a constant feed flow rate. (c). The model-based predictions of the biomass (X) concentration in the same FBR with using the modified E. coli T5 strain, but operated in two alternatives: (i) (2, black) optimal operation derived in this paper (i.e., variable fed [GLC] and variable feed flow rate), or (ii) (1, blue) simulations and the experimental data (•, blue) of Chen [71] under nominal, nonoptimal operation of Table 1, with a constant fed [GLC] and a constant feed flow rate.
Figure 1
Figure 1
Simplified representation of the CCM pathway in E. coli of Edwards and Palsson [51] (i.e., the wild cell, including the PTS-system). Fluxes characterizing the membrane transport [Metabolite(e) ↔ Metabolite(c)] and the exchange with environment are omitted from the plot (see [38] for details and explanations regarding the numbered reactions). Notations: [e] = environment; [c] = cytosol. Adapted from Maria et al. [38] with the courtesy of CABEQ Jl. The considered 72 metabolites, the stoichiometry of the 95 numbered reactions, and the net fluxes for specified conditions are given by Maria et al. [38]. The left rectangle indicates the chemical node inducing glycolytic oscillations [33,36]. Notations [+] and [−] denote the feedback positive and negative regulatory loops, respectively. GLC = “glucose”. See the abbreviation list for species names; V1–V6 = lumped reaction rates discussed in the Section 3.1.3.
Figure 2
Figure 2
Comparison between the reduced schemes for GLC import systems into the cell linked to the TRP synthesis. Adapted from [73,74] (see the acknowledgement). (A) The wild E. coli model of Chassagnole et al. [52] and Maria [48] uses the phosphoenolpyruvate/sugar phosphotransferase (PTS) system for the GLC uptake. (B) The modified E. coli T5 strain of Chen et al. [73] and Chen [74], studied in this paper, uses the more efficient GLC uptake system based on galactose permease/glucokinase (GalP/Glk). The numbers on arrows indicated the relative metabolic fluxes at QSS predicted by Chen [74,75]. The same authors predicted a maximum theoretical yield of 0.23 g Trp/g glucose for the wild E. coli strain and of 0.45 g Trp/g glucose for the modified T5 strain.

Similar articles

References

    1. Ghose T.K., Fiechter A., Blakebrough N. Advances in Biochemical Engineering. Volume 7–10 Springer; Berlin, Germany: 1977.
    1. Moser A. Bioprocess Technology—Kinetics and Reactors. Springer; Berlin, Germany: 1988.
    1. Maria G. Model-based optimization of a fed-batch bioreactor for mAb production using a hybridoma cell culture. Molecules. 2020;25:5648. doi: 10.3390/molecules25235648. - DOI - PMC - PubMed
    1. Maria G., Peptănaru I.M. Model-based optimization of mannitol production by using a sequence of batch reactors for a coupled bi-enzymatic process—A dynamic approach. Dynamics. 2021;1:8. doi: 10.3390/dynamics1010008. - DOI
    1. Liese A., Seelbach K., Wandrey C. Industrial Biotransformations. Wiley-VCH; Weinheim, Germany: 2006.

LinkOut - more resources