

Sandbur Drought Tolerance Reflects Phenotypic Plasticity Based on the Accumulation of Sugars, Lipids, and Flavonoid Intermediates and the Scavenging of Reactive Oxygen Species in the Root
- PMID: 34884421
- PMCID: PMC8657935
- DOI: 10.3390/ijms222312615
Sandbur Drought Tolerance Reflects Phenotypic Plasticity Based on the Accumulation of Sugars, Lipids, and Flavonoid Intermediates and the Scavenging of Reactive Oxygen Species in the Root
Abstract
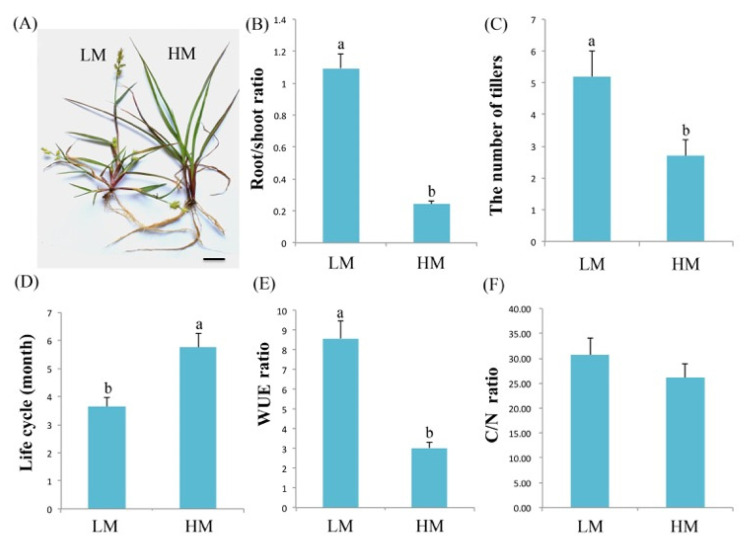
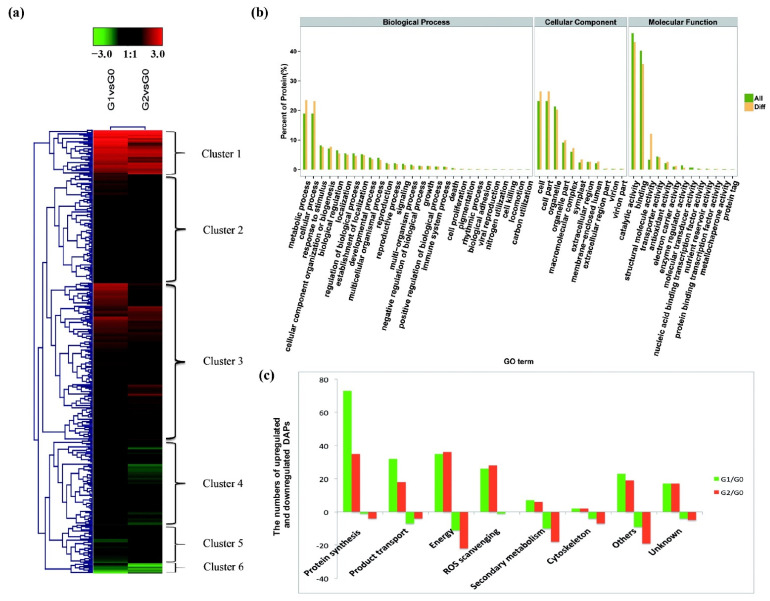
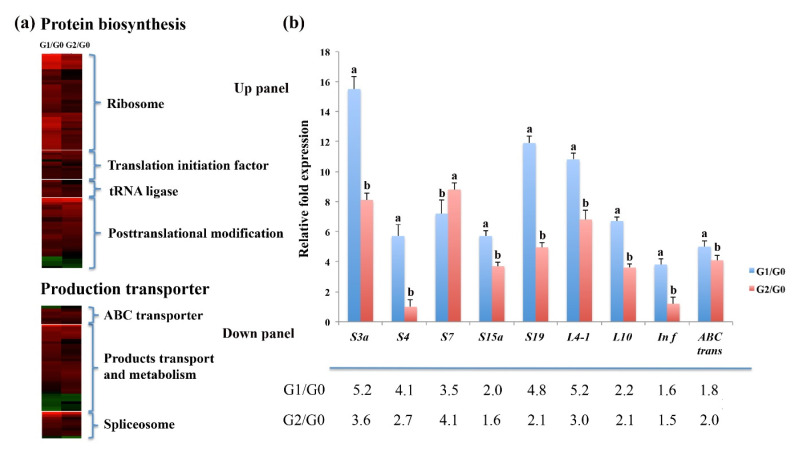
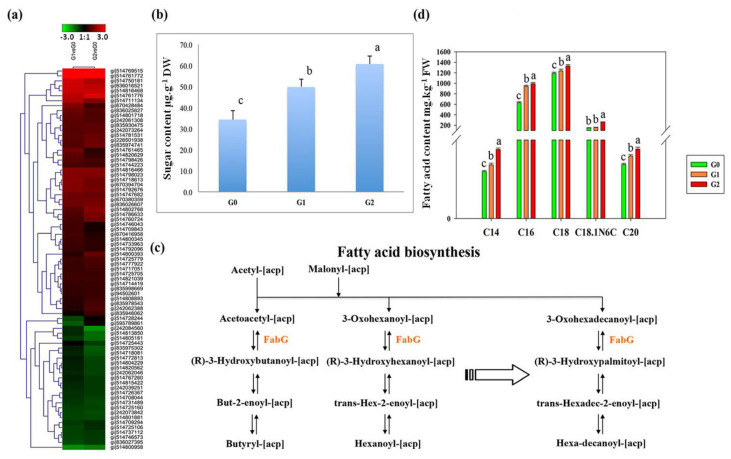
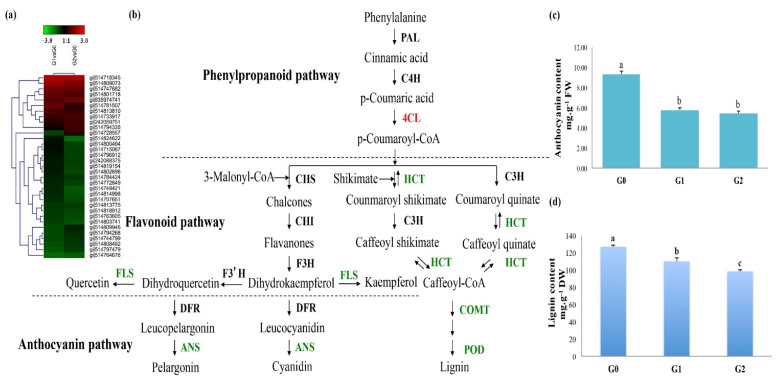
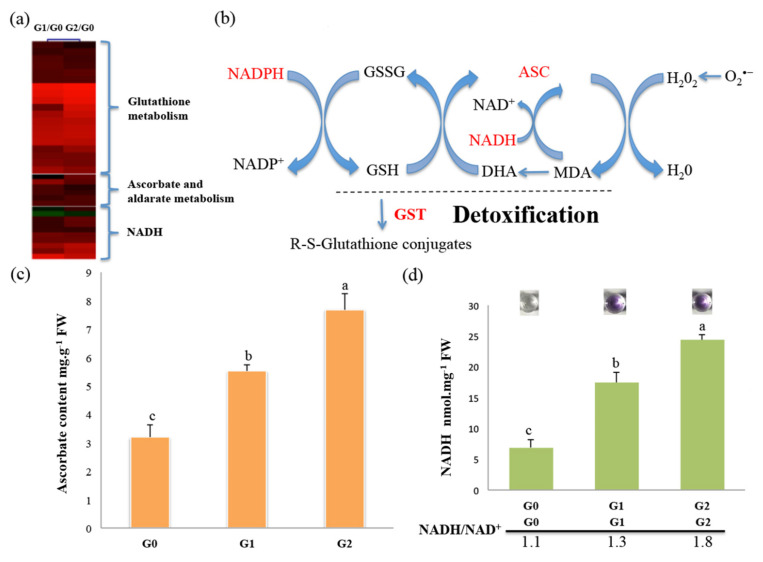
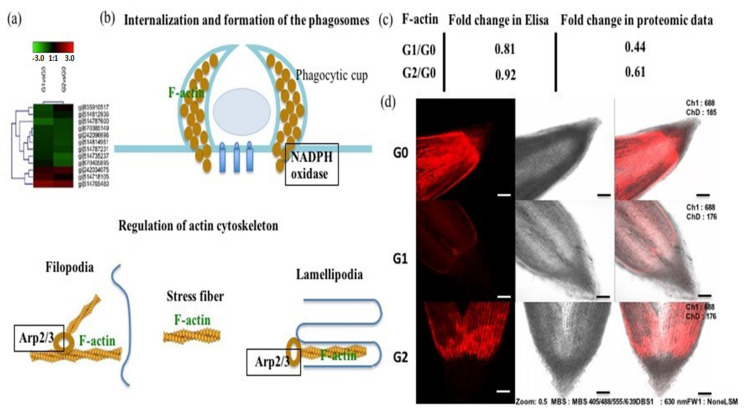
The perennial grass Cenchrus spinifex (common sandbur) is an invasive species that grows in arid and semi-arid regions due to its remarkable phenotypic plasticity, which confers the ability to withstand drought and other forms of abiotic stress. Exploring the molecular mechanisms of drought tolerance in common sandbur could lead to the development of new strategies for the protection of natural and agricultural environments from this weed. To determine the molecular basis of drought tolerance in C. spinifex, we used isobaric tags for relative and absolute quantitation (iTRAQ) to identify proteins differing in abundance between roots growing in normal soil and roots subjected to moderate or severe drought stress. The analysis of these proteins revealed that drought tolerance in C. spinifex primarily reflects the modulation of core physiological activities such as protein synthesis, transport and energy utilization as well as the accumulation of flavonoid intermediates and the scavenging of reactive oxygen species. Accordingly, plants subjected to drought stress accumulated sucrose, fatty acids, and ascorbate, shifted their redox potential (as determined by the NADH/NAD ratio), accumulated flavonoid intermediates at the expense of anthocyanins and lignin, and produced less actin, indicating fundamental reorganization of the cytoskeleton. Our results show that C. spinifex responds to drought stress by coordinating multiple metabolic pathways along with other adaptations. It is likely that the underlying metabolic plasticity of this species plays a key role in its invasive success, particularly in semi-arid and arid environments.
Keywords: Cenchrus spinifex Cav.; antioxidant; drought; flavonoids; phenotypic plasticity; reactive oxygen species.
Conflict of interest statement
The authors declare no conflict of interest.
Figures

Similar articles
-
Physiological and Differential Proteomic Analyses of Imitation Drought Stress Response in Sorghum bicolor Root at the Seedling Stage.Int J Mol Sci. 2020 Dec 1;21(23):9174. doi: 10.3390/ijms21239174. Int J Mol Sci. 2020. PMID: 33271965 Free PMC article.
-
Quantitative Phosphoproteomic Analysis Provides Insight into the Response to Short-Term Drought Stress in Ammopiptanthus mongolicus Roots.Int J Mol Sci. 2017 Oct 17;18(10):2158. doi: 10.3390/ijms18102158. Int J Mol Sci. 2017. PMID: 29039783 Free PMC article.
-
Enhancement of oxidative and drought tolerance in Arabidopsis by overaccumulation of antioxidant flavonoids.Plant J. 2014 Feb;77(3):367-79. doi: 10.1111/tpj.12388. Epub 2013 Dec 17. Plant J. 2014. PMID: 24274116 Free PMC article.
-
Molecular understandings on 'the never thirsty' and apomictic Cenchrus grass.Biotechnol Lett. 2016 Mar;38(3):369-76. doi: 10.1007/s10529-015-2004-0. Epub 2015 Nov 24. Biotechnol Lett. 2016. PMID: 26601981 Review.
-
Association between Reactive Oxygen Species, Transcription Factors, and Candidate Genes in Drought-Resistant Sorghum.Int J Mol Sci. 2024 Jun 12;25(12):6464. doi: 10.3390/ijms25126464. Int J Mol Sci. 2024. PMID: 38928168 Free PMC article. Review.
Cited by
-
A 13-LOX participates in the biosynthesis of JAs and is related to the accumulation of baicalein and wogonin in Scutellaria baicalensis.Front Plant Sci. 2023 Jul 13;14:1204616. doi: 10.3389/fpls.2023.1204616. eCollection 2023. Front Plant Sci. 2023. PMID: 37521913 Free PMC article.
-
Physiological, biochemical, and transcriptomic alterations in Castor (Ricinus communis L.) under polyethylene glycol-induced oxidative stress.BMC Plant Biol. 2024 Oct 17;24(1):973. doi: 10.1186/s12870-024-05691-4. BMC Plant Biol. 2024. PMID: 39415088 Free PMC article.
-
Symbiotic Modulation as a Driver of Niche Expansion of Coastal Plants in the San Juan Archipelago of Washington State.Front Microbiol. 2022 Jun 23;13:868081. doi: 10.3389/fmicb.2022.868081. eCollection 2022. Front Microbiol. 2022. PMID: 35814642 Free PMC article.
References
-
- Zhang G.L., Zhu Y., Fu W.D., Wang P., Zhang R.H., Zhang Y.L., Song Z., Xia G.-X., Wu J.H. iTRAQ Protein Profile Differential Analysis of Dormant and Germinated Grassbur Twin Seeds Reveals that Ribosomal Synthesis and Carbohydrate Metabolism Promote Germination Possibly Through the PI3K Pathway. Plant Cell Physiol. 2016;57:1244–1256. doi: 10.1093/pcp/pcw074. - DOI - PubMed
-
- Gao L., Geng Y., Li B., Chen J., Yang J. Genome-wide DNA methylation alterations of Alternanthera philoxeroides in natural and manipulated habitats: Implications for epigenetic regulation of rapid responses to environmental fluctuation and phenotypic variation. Plant Cell Environ. 2010;33:1820–1827. doi: 10.1111/j.1365-3040.2010.02186.x. - DOI - PubMed
MeSH terms
Substances
Grants and funding
LinkOut - more resources
Full Text Sources
Medical
