. 2021 Dec 8;12(1):7130.
doi: 10.1038/s41467-021-27460-9.

Free fatty-acid transport via CD36 drives β-oxidation-mediated hematopoietic stem cell response to infection

Affiliations

Free fatty-acid transport via CD36 drives β-oxidation-mediated hematopoietic stem cell response to infection

Jayna J Mistry et al. Nat Commun. .

Abstract

Acute infection is known to induce rapid expansion of hematopoietic stem cells (HSCs), but the mechanisms supporting this expansion remain incomplete. Using mouse models, we show that inducible CD36 is required for free fatty acid uptake by HSCs during acute infection, allowing the metabolic transition from glycolysis towards β-oxidation. Mechanistically, high CD36 levels promote FFA uptake, which enables CPT1A to transport fatty acyl chains from the cytosol into the mitochondria. Without CD36-mediated FFA uptake, the HSCs are unable to enter the cell cycle, subsequently enhancing mortality in response to bacterial infection. These findings enhance our understanding of HSC metabolism in the bone marrow microenvironment, which supports the expansion of HSCs during pathogenic challenge.


Conflict of interest statement

The authors declare no competing interests.

Figures
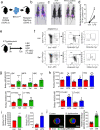
Fig. 1
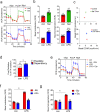
Fig. 1. Infection with S. typhimurium drives long-chain fatty-acid uptake in HSC.
a Schematic diagram of experimental design. WT CD45.2 lineage negative, CD117-positive (LK) cells were isolated and transduced with firefly luciferase (LK+FF) and transplanted into WT CD45.1 animals. b Mice were imaged using bioluminescence imaging to confirm engraftment. c Mice were injected with control PBS for 16 hours then treated with FFA-SS-luc and imaged using bioluminescence (FFA-luciferin). One-week later mice were injected LPS for 16 hours then treated with FFA-SS-luc and imaged using bioluminescence Representative images of control and LPS-treated mice. d Densitometry of the bioluminescent images in (c) to determine fluorescence intensity in the vehicle and LPS-treated animals. n = 4. e Schematic diagram of experiment in which C57BL/6 J mice were infected with S. typhimurium (Sal) for 72 hours and analyzed for LSK, MPP, HSC, ST-HSC, and LT-HSC populations by flow cytometry. f The gating strategy used to identify the LSK, MPP, HSC ST-HSC, LT-HSC populations are shown. g Lipid content (Bodipy 493/503 mean fluorescence intensity (MFI)) was assessed by flow cytometry from control and S. typhimurium (Sal) (72 hours) treated mice. n = 7 in each group. h C57BL/6 J mice were treated with 1 mg/kg LPS for 16 hours, the bone marrow was extracted, and the cells were analyzed by flow cytometry for lipid content (Bodipy 493/503 MFI) n = 6 in each group. i C57BL/6 J mice were infected with S. typhimurium (Sal) for 72 hours or LPS for 16 hours. Long-chain fatty-acid (LCFA) uptake was measured using the QBT assay. n = 5 in each group (j) C57BL/6 J mice were infected with S. typhimurium (Sal) for 72 hours. Representative live-cell fluorescent microscopy images of LSK cells isolated from the mice, Sca1 membrane stain (red), Bodipy 493/503 (green), and Hoechst 33342 (blue). Quantification of Bodipy 493/503 fluorescence in LSK cells from images shown, 20 LSK cells from five mice in each condition. Data shown are means ± SD. The Mann–Whitney U test (two-tailed) was used to compare between treatment groups *p < 0.05 **p < 0.01 ***p < 0.001. Source data are provided as a Source Data file.
Fig. 2
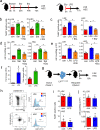
Fig. 2. Infection increases OXPHOS and dependency on β-oxidation in HSPC.
a C57BL/6 J mice were infected with S. typhimurium (Sal) for 72 hours or treated with 1 mg/kg LPS for 16 hours, the animals were killed and the LSK population was isolated by FACS. oxygen consumption rate (OCR) was measured by the extracellular flux assay. Representative seahorse trace from mice, n = 3 in each group. b Basal (normalized to rotenone) and maximal mitochondrial respiration in LSK cells from control, LPS 16 hours, and S. typhimurium (72 hours) treated mice. n = 6 in each group. c Basal extracellular acidification rate (ECAR) compared with basal OCR levels provides a snapshot of the bioenergetic profile of LSK before and after treatment with LPS (16 hours) or S. typhimurium (72 hours). Basal OCR normalized to rotenone. n = 5 in each group. d C57BL/6 J mice were treated with 1 mg/kg LPS for 16 hours, the LSK population was isolated by FACS. The LSK population was analyzed by seahorse mitochondrial fuel flex kit for the reliance on long-chain fatty acids to maintain baseline respiration. n = 5 in each group. e C57BL/6 J mice were treated with 1 mg/kg LPS for 16 hours, the animals were killed and the LSK population was isolated by FACS. LSKs were treated with 4 µM of the β-oxidation inhibitor, etomoxir (Eto) for 1 hour, and OCR levels were measured by the extracellular flux assay. n = 5 mice in each group. f Basal mitochondrial respiration (normalized to rotenone) of LSK cells from control and LPS-treated animals with and without eto. n = 3 mice in each group. g Maximal mitochondrial respiration LSK cells from control and LPS-treated animals with and without eto. n = 3 mice in each group. Data shown are means ± SD. The Mann–Whitney U test (two-tailed) was used to compare between two treatment groups. *p < 0.05 **p < 0. 01 ***p < 0.001. Source data are provided as a Source Data file.
Fig. 3
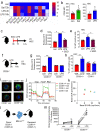
Fig. 3. Infection increases dependency on β-oxidation.
a Schematic diagram of experimental design in which C57BL/6 J mice were infected with S. typhimurium (Sal) for 72 hours and 10 mg/kg/day Etomoxir (Eto) or 1 mg/kg LPS for 16 hours and 10 mg/kg Eto. The bone marrow was extracted, and the cells were analyzed by flow cytometry for LSK and HSC. b Percentage of cycling HSC and LSK as measured by Ki67-positive cells after 72 hours of S. typhimurium and 10 mg/kg/day Eto treatment. n > 5 mice in each group. c Percentage of cycling HSC and LSK as measured by Ki67-positive cells after 16 hours of 1 mg/kg LPS and 10 mg/kg Eto treatment. n > 4 mice in each group. d Number of LSKs and HSCs leg after 72 hours S. typhimurium and Eto treatment. n > 5 in each group. e Number of LSKs and HSCs per leg after 16 hours of LPS and Eto treatment. n = 5 mice in each group. f C57BL/6 J mice were treated with 1 mg/kg LPS for 16 hours or S. typhimurium for 72 h, HSC were FACS-sorted from control and LPS-treated animals. RNA was analyzed for CPT1A gene expression by qPCR. n = 4 in each group. g Schematic diagram of experimental design. WT CD45.1 lineage negative, CD117-positive (LK) cells were transduced with a CPT1A knockdown lentivirus (LKCPT1A KD) were transplanted into WT CD45.2 animals. Post engraftment mice were treated with 1 mg/kg LPS for 16 hours. h The bone marrow was extracted, and analyzed by flow cytometry for the LSK and HSC population. i Percentage of cycling HSC and LSK as measured by Ki67-positive cells after 16 hours of 1 mg/kg LPS treatment. n = 5 mice in each group. j Number of LSKs and HSCs per leg after 16 hours of LPS treatment. n = 5 mice in each group. Data shown are means ± SD. The Mann–Whitney U test (two-tailed) was used to compare between two treatment groups and the Kruskal–Wallis test was followed by Dunn’s multiple comparison post hoc test to compare between three treatment groups. *P < 0.05 **p < 0. 01. Source data are provided as a Source Data file.
Fig. 4
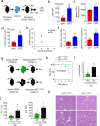
Fig. 4. CD36 regulates long-chain free fatty-acid uptake in HSC in response to infection.
a Heat map of fatty-acid transporter genes differentially expressed by HSCs from control, S. typhimurium (Sal), and LPS-treated animals. b Flow cytometry analysis of CD36 expression in the HSC of S. typhimurium and LPS-treated animals. n = 5 in each group. c C57BL/6 J mice were pre-treated with SSO for one hour before treatment with LPS for 16 hours. n = 5 in each group. d The cells from control, LPS, or LPS and SSO-treated animals were isolated and long-chain fatty-acid (LCFA) uptake was measured using the QBT assay. n = 5 in each group. e Percentage of cycling HSCs as measured by Ki67-positive cells after pre-treatment followed by LPS treatment. n = 5. f Schematic diagram of the experiment. g The LK cells from LPS-treated CD36−/− or WT (CD36+/+) mice were isolated and long-chain fatty-acid (LCFA) uptake was measured using the QBT assay. n = 5. h Percentage of cycling HSCs from LPS-treated CD36−/− or WT (CD36+/+) mice as measured by Ki67-positive. n = 5 mice in each group. i CD36−/− or WT (CD36+/+) were infected with S. typhimurium (Sal). Representative live-cell fluorescent microscopy images of LSK cells isolated from the mice, Sca1 membrane stain (red), Bodipy 493/503 (green) and Hoechst 33342 (blue), 20 LSK cells from five mice in each condition. j CD36+/+ and CD36−/− mice were treated with S. typhimurium the animals were killed and the LSK population was isolated by FACS, OCR was measured. n = 5. k Basal ECAR compared to basal OCR levels before and after treatment with LPS or S. typhimurium. Basal OCR normalized to rotenone. n = 5. l Schematic diagram of experimental design. m Mice were injected LPS for 16 hours then treated with FFA-SS-luc and imaged using bioluminescence (FFA-luciferin+LPS). Densitometry of the bioluminescent images to determine fluorescence intensity. n = 4 for each group. The Mann–Whitney U test (two-tailed) was used and the Kruskal–Wallis test followed by Dunn’s multiple comparison post hoc test was used *P < 0.05 **p < 0. 01. Source data are provided as a Source Data file.
Fig. 5
Fig. 5. FFA uptake through CD36 is an essential component of HSC expansion in response to infection.
a Schematic diagram of experimental design. CD36+/+ CD45.1 lineage negative, CD117-positive cells were isolated and transplanted into CD36−/− CD45.2 animals. Post engraftment mice were treated with 1 mg/kg LPS for 16 hours and the bone marrow cells were analyzed by flow cytometry. b Flow cytometry analysis of CD36 expression (CD36 mean fluorescence intensity (MFI)) in the HSC from the transplant mice following 1 mg/kg LPS (16 hours) treatment. n = 5 mice in each group. c The LK cells were isolated and long-chain fatty-acid (LCFA) uptake was measured using the QBT assay. n = 5 in each group. d Percentage of cycling HSCs as measured by Ki67-positive cells from transplant mice after 16 hours of 1 mg/kg LPS treatment. n = 5 mice in each group. e The LSK population was isolated by FACS, oxygen consumption rate (OCR) was measured by the extracellular flux assay. Basal extracellular acidification rate (ECAR) compared with basal OCR levels provides a snapshot of the bioenergetic profile of LSK before and after treatment with LPS (16 hours). Basal OCR normalized to rotenone. n = 5 mice in each group. f Basal (normalized to rotenone) and maximal mitochondrial respiration in LSK cells from control vs. LPS 16 hours treated transplanted mice. n = 5 mice in each group. g CD36+/+ CD45.2 or CD36−/− CD45.2 lineage negative, CD117-positive cells were isolated and transplanted into WT CD45.1 mice these were termed WT(+/+CD36) or WT(−/−CD36). Post engraftment mice were treated with S. typhimurium for 96 hours. h Kaplan–Meier survival curve n > 5 mice in each group. i Weight loss was analyzed. n = 5 in each group. j Levels of circulating alanine aminotransferase (ALT) and aspartate aminotransferase (AST) in the serum following 96 hours of S. typhimurium treatment. n > 5 in each group. k Livers were isolated and sectioned and stained with hematoxylin and eosin. (Magnification: H, ×63). n = 5 mice in each group. Data shown are means ± SD. The Mann–Whitney U test (two-tailed) was used to compare between treatment groups *p < 0.05 **p < 0.01. Source data are provided as a Source Data file.

Similar articles

Cited by

References

    1. Orkin SH, Zon LI. Hematopoiesis: an evolving paradigm for stem cell biology. Cell. 2008;132:631–644. - PMC - PubMed
    1. McCracken MN, et al. Normal and neoplastic stem cells. Cold Spring Harb. Symp. Quant. Biol. 2016;81:1–9. - PMC - PubMed
    1. Anthony BA, Link DC. Regulation of hematopoietic stem cells by bone marrow stromal cells. Trends Immunol. 2014;35:32–37. - PMC - PubMed
    1. Mendelson A, Frenette PS. Hematopoietic stem cell niche maintenance during homeostasis and regeneration. Nat. Med. 2014;20:833–846. - PMC - PubMed
    1. Simsek T, et al. The distinct metabolic profile of hematopoietic stem cells reflects their location in a hypoxic niche. Cell Stem Cell. 2010;7:380–90.. - PMC - PubMed

Publication types