. 2021 Dec;600(7889):547-552.
doi: 10.1038/s41586-021-04184-w. Epub 2021 Dec 1.

De novo protein design by deep network hallucination

Affiliations

De novo protein design by deep network hallucination

Ivan Anishchenko et al. Nature. 2021 Dec.

Abstract

There has been considerable recent progress in protein structure prediction using deep neural networks to predict inter-residue distances from amino acid sequences1-3. Here we investigate whether the information captured by such networks is sufficiently rich to generate new folded proteins with sequences unrelated to those of the naturally occurring proteins used in training the models. We generate random amino acid sequences, and input them into the trRosetta structure prediction network to predict starting residue-residue distance maps, which, as expected, are quite featureless. We then carry out Monte Carlo sampling in amino acid sequence space, optimizing the contrast (Kullback-Leibler divergence) between the inter-residue distance distributions predicted by the network and background distributions averaged over all proteins. Optimization from different random starting points resulted in novel proteins spanning a wide range of sequences and predicted structures. We obtained synthetic genes encoding 129 of the network-'hallucinated' sequences, and expressed and purified the proteins in Escherichia coli; 27 of the proteins yielded monodisperse species with circular dichroism spectra consistent with the hallucinated structures. We determined the three-dimensional structures of three of the hallucinated proteins, two by X-ray crystallography and one by NMR, and these closely matched the hallucinated models. Thus, deep networks trained to predict native protein structures from their sequences can be inverted to design new proteins, and such networks and methods should contribute alongside traditional physics-based models to the de novo design of proteins with new functions.


Conflict of interest statement

Competing interests

G.T.M is a co-founder of Nexomics Biosciences, Inc.

Figures

Extended Data Figure 1.
Comparison of the hallucinated designs to proteins with known structure and of similar length (100 ± 10 aa) from the trRosetta training set. a,b) Multidimensional scaling plots of the sequence (a) and structure (b) spaces covered by the 2,000 hallucinated proteins (blue dots) along with 1,110 proteins of similar length from the trRosetta training set (red dots). These scatter plots show that subspaces spanning by hallucinated proteins and natural proteins of similar size (100 ± 10 aa) are quite distinct; the network is not simply recapitulating native proteins of the same length. Soluble and structurally characterized hallucinations are marked by black and magenta dots respectively. c,d) Distributions of pairwise structure (c) and sequence (d) similarities for hallucinated and natural proteins. The hallucinated proteins are more similar to each other (blue lines) than they are to natural proteins (grey lines). e) Sequence comparisons (gappless threading) of fragments of various size (15,20,…,60 aa) from the hallucinated designs (blue) and natural 100 (±10) aa-long proteins (red) to other proteins from the trRosetta training set. There is no apparent tendency for the trRosetta-based design procedure to “copy over” sequence fragments from the proteins in the training set into the hallucinated designs. f,g) Secondary structure content of the hallucinated designs and natural 100 aa-long proteins from the training set. Hallucinations are more ideal than natural proteins in having less loops but longer secondary structure elements.
Extended Data Figure 2.
Structure similarity dendrograms (a,e), 3D structure models (b,f), predicted distance maps (c,g), and temperature dependence of circular dichroism signal at 220 nm in the 25–95 °C temperature range (d,h) for all-alpha and mixed alpha and beta hallucinations respectively.
Extended Data Figure 3.
Additional examples of thermostable hallucinations with CD spectra consistent with the target structure. a) 3D structure models of the hallucinated designs. b) Predicted distance maps at the end of the hallucination trajectory. c) ab initio folding funnels from Rosetta. d) Size-exclusion chromatography traces. e) Circular dichroism spectra at 25 °C (blue) and 95 °C (red). f) Temperature dependence of circular dichroism signal at 220 nm in the 25 to 95 °C temperature range.
Extended Data Figure 4.
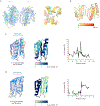
a) Superposition of hallucinated model (blue) and NMR medoid structure (gray) of 0515 reveal 1.85 Å backbone RMSD over 100 residues b) Hallucinated model of 0515 colored by distance between Cɑ-Cɑ pairs between model and NMR medoid structure after structural superposition and c) corresponding plot of per-residue Cɑ-Cɑ distance difference between model and NMR medoid structure.
Extended Data Figure 5.
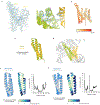
a) Representative electron density (2Fo-Fc, 1σ) over entire asymmetric unit (left) and core packing regions (right) of hallucination 0217. b) Both chains of the crystal structure colored by B-factor. c) Structural superposition of chains observed in the asymmetric unit reveal a 2.8 Å backbone RMSD over 91 residues. d) Crystal lattice contacts for chain A (green) and chain B (yellow) may explain structural differences observed between chains. Circled regions highlight where chain A is an ordered helix-loop-helix and chain B is disordered. e) Hallucinated model of 0217 colored by distance between Cɑ-Cɑ pairs between model and crystal structure after structural superposition and corresponding plot of per-residue Cɑ-Cɑ distance difference between model and crystal structure. f) Structural superposition of the hallucinated model and chain B of the 0217 crystal structure (left), 0217 model colored by Cɑ-Cɑ distance between hallucination and crystal structure (middle), and per residue Cɑ-Cɑ distance between hallucination and crystal structure per residue (right).
Extended Data Figure 6.
a) Hallucinated model with surface hydrophobics shown as sticks and b) [1H-15N]-SOFAST-HMQC spectra of hallucinated sequence 0417 before (red) and after (blue) buffer optimization. Spectrum before optimization (red) was obtained using a protein concentration of ~0.3 mM at 298K in 20 mM Tris-HCl, pH 7.2, 100 mM NaCl and spectrum acquired after optimization (blue) was obtained using a protein concentration of ~0.3 mM, at temperature of 323 K in a buffer of 20 mM sodium phosphate at pH 6.5, 50 mM NaCl, and 20% glycerol. The NMR data are consistent with a folded structure containing a mix of alpha and beta secondary structure. Even under optimized conditions, there is still evidence of exchange broadening (e.g. Trp side chain NεHs are weak), resonances that appear only at high temperature and high glycerol concentrations, and some resonances that are doubled; all indications of transient self-association. c) Size-exclusion chromatography trace of 0417 displays a small additional peak corresponding to a larger oligomeric species which corroborates the NMR analysis.
Extended Data Figure 7.
a) Representative electron density (2Fo-Fc, 1σ) over entire asymmetric unit (left) and core packing regions (right) of hallucination 0738_mod. b) Both chains of the crystal structure colored by B-factor. c) Structural superposition of the hallucinated model and chain A of the 0738_mod crystal structure (left), 0738_mod model colored by Cɑ-Cɑ distance between hallucination and crystal structure (middle), and per residue Cɑ-Cɑ distance between hallucination and crystal structure per residue (right). d) Hallucinated model of 0738_mod colored by distance between Cɑ-Cɑ pairs between model and crystal structure after structural superposition and corresponding plot of per-residue Cɑ-Cɑ distance difference between model and crystal structure.
Extended Data Figure 8.
a) 1H-15N heteronuclear NOE (hetNOE) histograms for 0515 (82 non-overlapped peaks), 0738_mod (144 peaks), and 0217 (47 peaks), together with their average values. 1H-15N steady state heteronuclear NOEs were obtained from the ratio of cross peak intensities (Isaturated/Iequilibrium) with (Isaturated) and without (Iequilibrium) 3 sec of proton saturation during the presat delay and recorded in an interleaved manner, split in TopSpin, processed identically using NMRPipe, and peak picked in SPARKY to obtain peak intensities. b) 1H-15N HSQC spectra of corresponding proteins collected at 800 MHz at 298 K in 25 mM HEPES, pH 7.4, 50 mM NaCl buffer and prepared in a 5-mm Shigemi NMR tubes for data collection with addition of 5% D2O (v/v). These 15N-enriched protein samples were prepared at concentrations of 0.4 mM, 0.15 mM, and 0.2 mM, respectively. c) SEC data demonstrating monodispersity of these proteins in solution, with predominantly monomer for 0515 and 0738_mod and predominantly dimer for 0217. SDS-PAGE data (not shown) show that each is >95% homogeneous, which together with MALDI-TOF mass spectrometry indicate that the spectral heterogeneity observed is not due to chemical heterogeneity. d) Ribbon diagrams of the corresponding monomeric or dimeric protein structures. These results show that the three designs have characteristic dynamics in solution. The average hetNOE for the homodimer 0217 is lower than for 0515 and 0738_mod, and it has fewer peaks than expected due to exchange broadening. Although 0738_mod has a similar hetNOE distribution as monomeric 0515, it has more than double the expected number of peaks, indicating at least two folded conformations (for all or parts of the protein) in solution that are in slow conformational exchange on the NMR time-scale. This was further validated by the appearance of new peaks in spectra at lower temperature (288K), and different peaks at higher temperatures (308 and 318K), and confirmed by detection of 15N ZZ-exchange cross peaks at 318K with 600 and 750 ms mixing times (Bruker pulse sequence hsqcetexf3gp, data not shown).
Figure 1:
Figure 1:
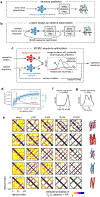
Overview of protein hallucination approach. a) In structure prediction using trRosetta and other recent methods, a deep neural network is used to predict inter-residue geometries (reliable predictions have sharp 2D distance and orientation maps) from a single sequence or a multiple sequence alignment, and then the 3D structure is reconstructed by constrained minimization. b) Network predictions for a random sequence are not confident (blurry 2D maps); to transform a random sequence into one encoding a new folded protein, we introduce multiple single amino acid substitutions into the sequence using Markov chain Monte Carlo algorithm, optimizing the sharpness of the 2D maps. c) Schematic of the MCMC procedure. d) Annealing trajectories averaged over 2,000 runs show a monotonic increase in the KL-divergence (contrast of the distance maps) with increasing Monte Carlo optimization. The mean and 0.01,0.99 quantiles are shown in blue; temperature profile is shown in grey. e) Distance maps become progressively sharper along the Monte Carlo trajectories as exemplified by five hallucinated sequences with different protein structure topologies. f) Hallucinated sequences are unrelated to the naturally occurring protein sequences in the UniRef90 database: median BLAST E-value of the closest hit is 0.17. g) Hallucinated structures range in similarity to the protein structures in the PDB with average TM-scores to the closest match of 0.78.
Figure 2:
Figure 2:
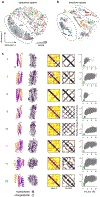
Overview of computational results. a) Multidimensional scaling plot of the sequence space covered by the 2,000 hallucinated proteins; BLAST bit-score was used to measure the distance between proteins. Each grey dot represents one design color-coded by the score from the network (darker grey color corresponds to higher score). 129 experimentally tested designs belong to 27 structural clusters shown by colored numbers. b) Multidimensional scaling plot of the structural space covered by the 2,000 hallucinated proteins; (1 - TM-score) was used to measure the distance between proteins. Each grey dot represents one design; the gray-scale indicates the score from the network (darker grey corresponds to higher score, Eq. 8). The 129 experimentally tested designs fall into 27 structural clusters shown by colored numbers. c) Examples of hallucinated designs of various topologies. First column, ribbon depiction of protein backbone colored from blue (N-terminus) to red (C-terminus); second column, hydrophobic core; third column, distance maps at the beginning and end of hallucination trajectory, and fourth column, folding energy landscapes from large scale Rosetta ab initio structure prediction calculations; points represent lowest-energy structures sampled starting from an extended chain (grey points) and starting from the hallucinated design model (green points). The energy landscapes funnel into the energy minimum corresponding to the designed structure, providing independent, albeit in silico, evidence that the hallucinated sequences encode the hallucinated structures.
Figure 3.
Figure 3.
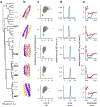
Experimental characterization of alpha-helical hallucinations. a) Dendrogram showing 42 all-alpha designs clustered by structural similarity (TM-score); thermostable designs with CD spectra consistent with the target structure are labeled by their IDs. b) 3D structure models of the hallucinated designs. c) ab initio folding funnels from Rosetta. d) SEC-MALS traces of purified protein. e) Circular dichroism spectra at 25 (blue) and 95 (red) °C. Contact maps and full temperature melts are in Extended Data Fig. 2, and additional examples of stable alpha-helical designs marked in grey in panel a are shown in Extended Data Fig. 3, Size-exclusion and CD plots are representative plots of duplicate experiments.
Figure 4.
Figure 4.
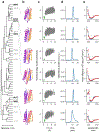
Experimental characterization of mixed alpha and beta hallucinations. Columns are as in Fig. 3. Additional examples are shown in Extended Data Fig. 3.
Figure 5.
Figure 5.
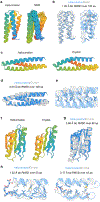
Structural analysis of network hallucinated proteins. a) Hallucination model (left) and NMR ensemble structure of 0515 (right). b) Superposition of NMR ensemble (gray, transparent) and hallucinated model (blue, outlined) of 0515 and overlay of medoid NMR structure and model with side chains shown. c) Structures of the 0217 hallucination model (left) and crystal structure (right). d) Superposition of 0217 hallucination model (blue) and crystal structure (gray). e) Zoomed in overlay of 0217 crystal structure (gray) and hallucination model (blue) with side chains shown as sticks. f) Structures of 0738 model (left) and 0738_mod crystal structure (right). g) Superposition of 0738 hallucination model and 0738_mod crystal structure. h) Superposition of only the N-terminal section (left) and only the C-terminal section (right) of the 0738 hallucination model (blue) and 0738_mod crystal structure (gray). Standalone structures are colored from N-terminus (blue) to C-terminus (red).

Comment in

Similar articles

Cited by

References

    1. Xu J Distance-based protein folding powered by deep learning. Proc. Natl. Acad. Sci. U. S. A 116, 16856–16865 (2019). - PMC - PubMed
    1. Senior AW et al. Improved protein structure prediction using potentials from deep learning. Nature 577, 706–710 (2020). - PubMed
    1. Yang J et al. Improved protein structure prediction using predicted interresidue orientations. Proc. Natl. Acad. Sci. U. S. A 117, 1496–1503 (2020). - PMC - PubMed
    1. Biswas S, Khimulya G, Alley EC, Esvelt KM & Church GM Low-N protein engineering with data-efficient deep learning. Nat. Methods 18, 389–396 (2021). - PubMed
    1. Madani A et al. ProGen: Language Modeling for Protein Generation. bioRxiv (2020) doi:10.1101/2020.03.07.982272. - DOI

Publication types