

Characterization of RNA Sensing Pathways in Hepatoma Cell Lines and Primary Human Hepatocytes
- PMID: 34831243
- PMCID: PMC8616302
- DOI: 10.3390/cells10113019
Characterization of RNA Sensing Pathways in Hepatoma Cell Lines and Primary Human Hepatocytes
Abstract
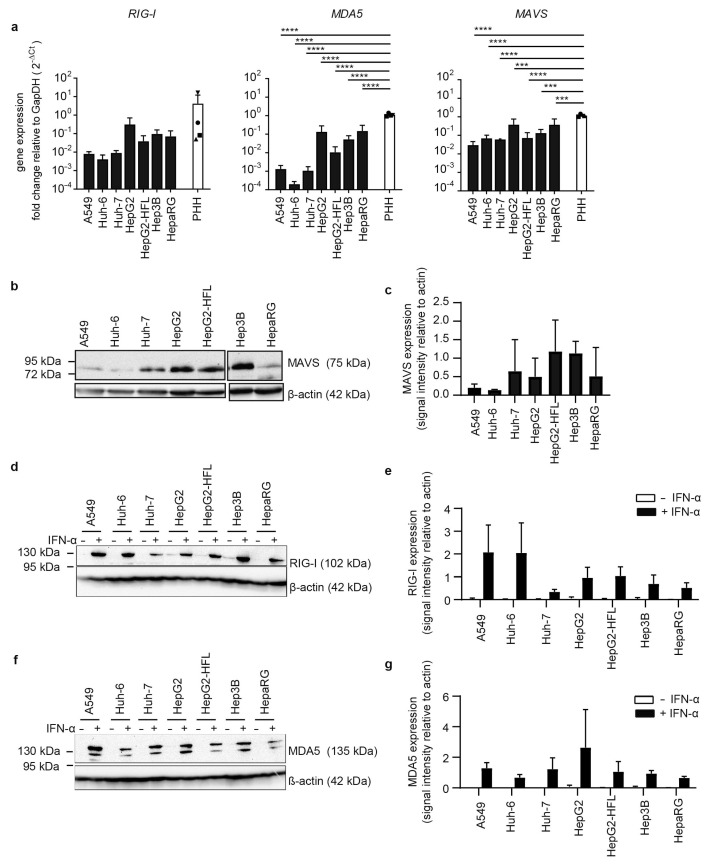
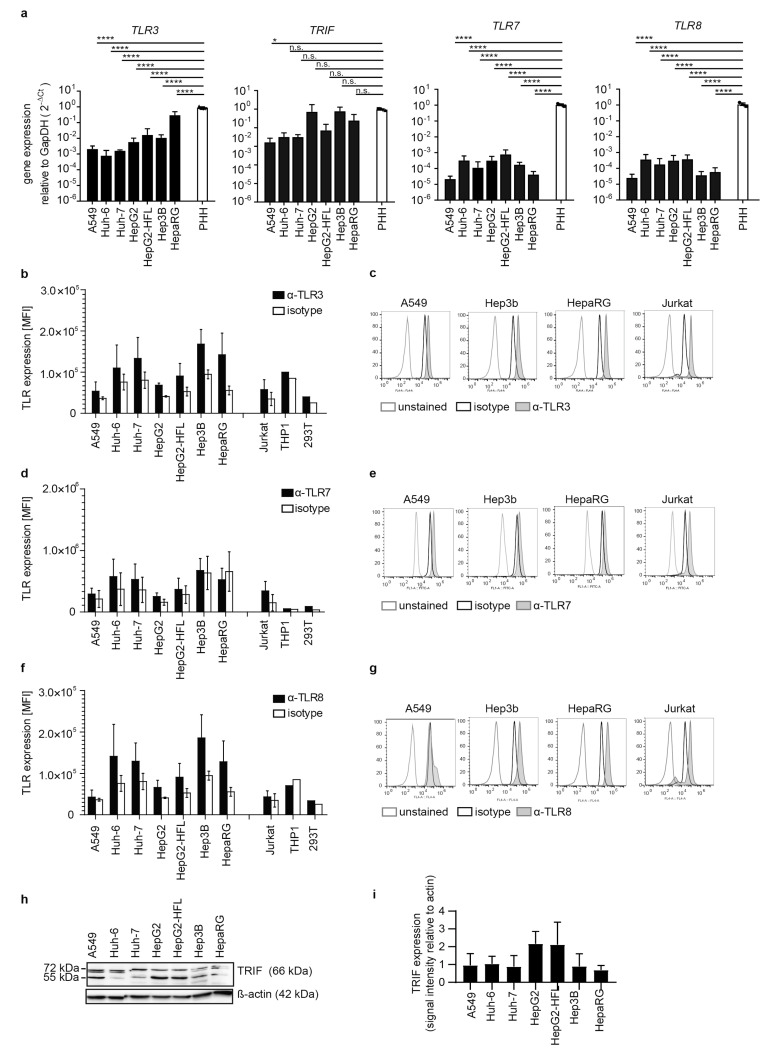
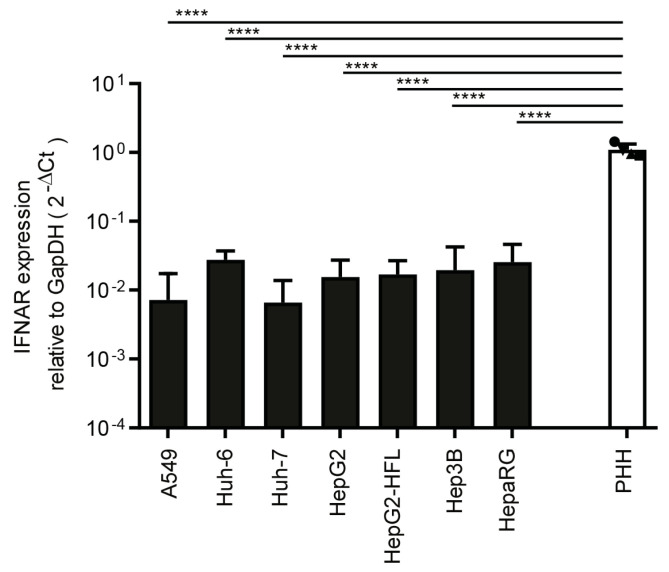
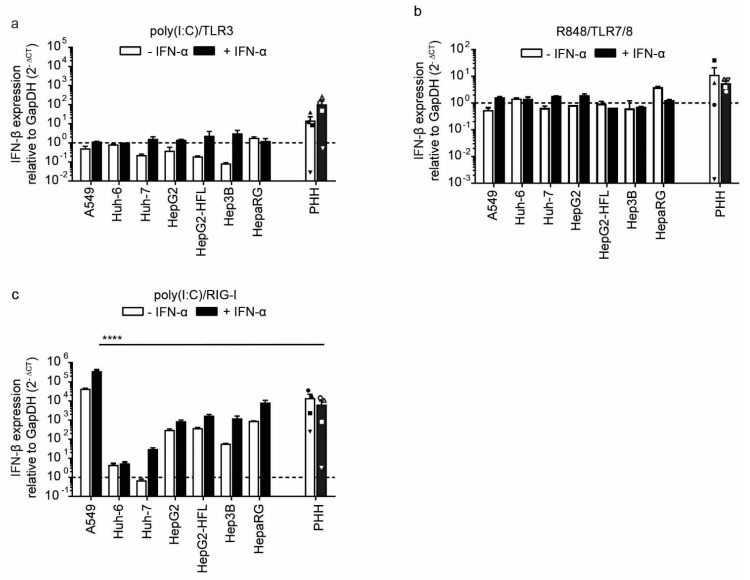
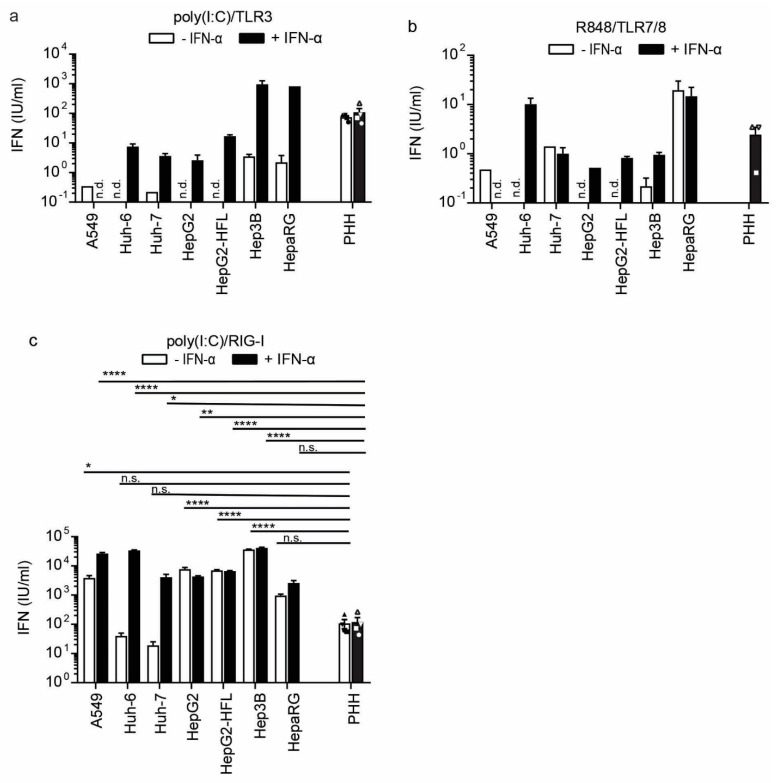
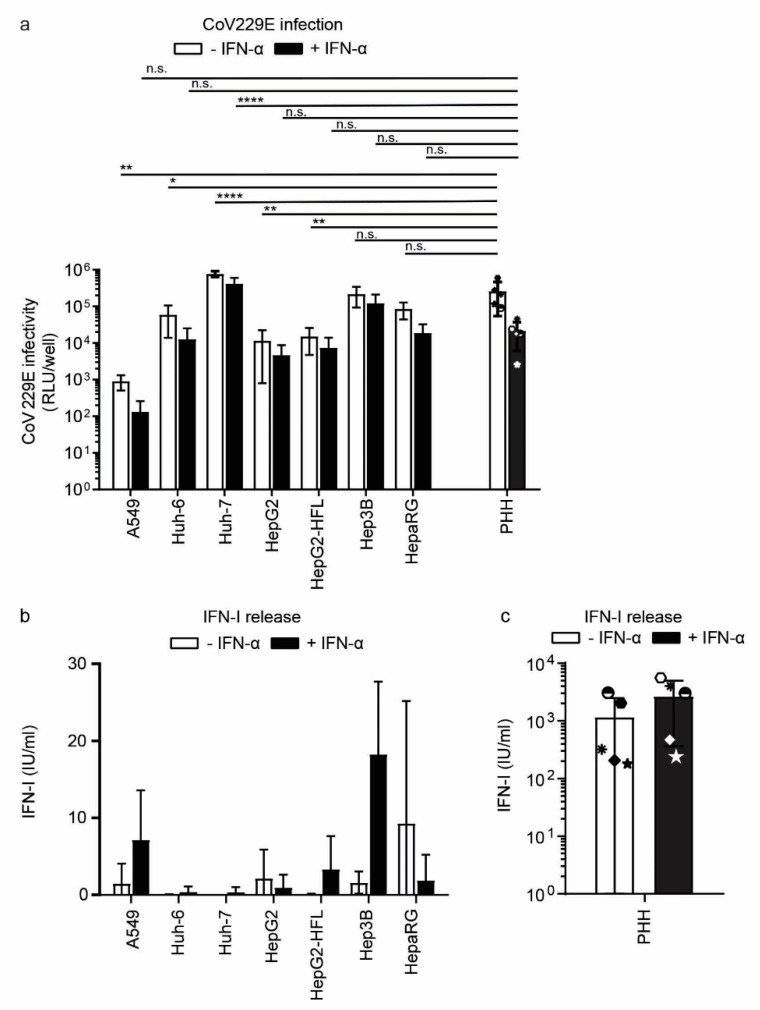
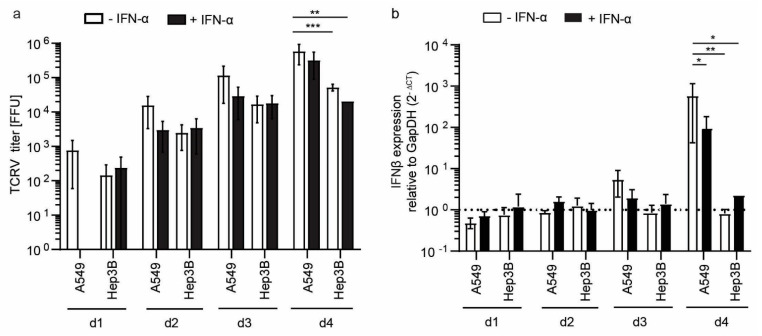
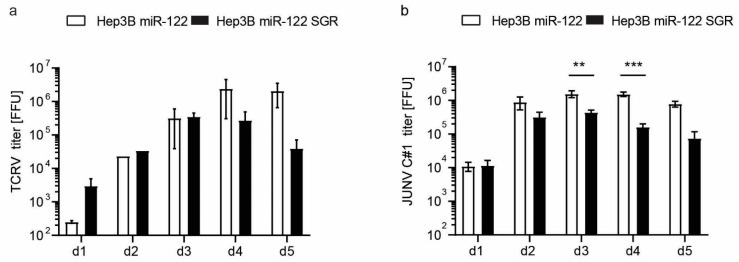
The liver is targeted by several human pathogenic RNA viruses for viral replication and dissemination; despite this, the extent of innate immune sensing of RNA viruses by human hepatocytes is insufficiently understood to date. In particular, for highly human tropic viruses such as hepatitis C virus, cell culture models are needed to study immune sensing. However, several human hepatoma cell lines have impaired RNA sensing pathways and fail to mimic innate immune responses in the human liver. Here we compare the RNA sensing properties of six human hepatoma cell lines, namely Huh-6, Huh-7, HepG2, HepG2-HFL, Hep3B, and HepaRG, with primary human hepatocytes. We show that primary liver cells sense RNA through retinoic acid-inducible gene I (RIG-I) like receptor (RLR) and Toll-like receptor 3 (TLR3) pathways. Of the tested cell lines, Hep3B cells most closely mimicked the RLR and TLR3 mediated sensing in primary hepatocytes. This was shown by the expression of RLRs and TLR3 as well as the expression and release of bioactive interferon in primary hepatocytes and Hep3B cells. Our work shows that Hep3B cells partially mimic RNA sensing in primary hepatocytes and thus can serve as in vitro model to study innate immunity to RNA viruses in hepatocytes.
Keywords: RIG-I; RNA virus; TLR3; arenavirus; coronavirus; hepatoma cells; innate immunity; interferon; liver; primary hepatocytes.
Conflict of interest statement
The authors declare no conflict of interest.
Figures
Similar articles
-
Distinct poly(I-C) and virus-activated signaling pathways leading to interferon-beta production in hepatocytes.J Biol Chem. 2005 Apr 29;280(17):16739-47. doi: 10.1074/jbc.M414139200. Epub 2005 Feb 28. J Biol Chem. 2005. PMID: 15737993
-
HepG2 cells mount an effective antiviral interferon-lambda based innate immune response to hepatitis C virus infection.Hepatology. 2014 Oct;60(4):1170-9. doi: 10.1002/hep.27227. Epub 2014 Aug 21. Hepatology. 2014. PMID: 24833036 Free PMC article.
-
Innate immune responses in human hepatocyte-derived cell lines alter genotype 1 hepatitis E virus replication efficiencies.Sci Rep. 2016 May 27;6:26827. doi: 10.1038/srep26827. Sci Rep. 2016. PMID: 27230536 Free PMC article.
-
Regulation of RIG-I-like receptor-mediated signaling: interaction between host and viral factors.Cell Mol Immunol. 2021 Mar;18(3):539-555. doi: 10.1038/s41423-020-00602-7. Epub 2021 Jan 18. Cell Mol Immunol. 2021. PMID: 33462384 Free PMC article. Review.
-
Hepatitis A and hepatitis C viruses: divergent infection outcomes marked by similarities in induction and evasion of interferon responses.Semin Liver Dis. 2010 Nov;30(4):319-32. doi: 10.1055/s-0030-1267534. Epub 2010 Oct 19. Semin Liver Dis. 2010. PMID: 20960373 Review.
Cited by
-
Pharmacological modulators of epithelial immunity uncovered by synthetic genetic tracing of SARS-CoV-2 infection responses.Sci Adv. 2023 Jun 23;9(25):eadf4975. doi: 10.1126/sciadv.adf4975. Epub 2023 Jun 21. Sci Adv. 2023. PMID: 37343108 Free PMC article.
-
What role for cellular metabolism in the control of hepatitis viruses?Front Immunol. 2022 Nov 17;13:1033314. doi: 10.3389/fimmu.2022.1033314. eCollection 2022. Front Immunol. 2022. PMID: 36466918 Free PMC article. Review.
-
Antibacterial and Antivirulence Activities of Acetate, Zinc Oxide Nanoparticles, and Vitamin C Against E. coli O157:H7 and P. aeruginosa.Curr Microbiol. 2023 Jan 2;80(2):57. doi: 10.1007/s00284-022-03151-6. Curr Microbiol. 2023. PMID: 36588146 Free PMC article.
-
Poly(I:C) Induces Distinct Liver Cell Type-Specific Responses in Hepatitis B Virus-Transgenic Mice In Vitro, but Fails to Induce These Signals In Vivo.Viruses. 2023 May 19;15(5):1203. doi: 10.3390/v15051203. Viruses. 2023. PMID: 37243287 Free PMC article.
References
-
- Gray K.K., Worthy M.N., Juelich T.L., Agar S.L., Poussard A., Ragland D., Freiberg A.N., Holbrook M.R. Chemotactic and inflammatory responses in the liver and brain are associated with pathogenesis of Rift Valley fever virus infection in the mouse. PLoS Negl. Trop. Dis. 2012;6:e1529. doi: 10.1371/journal.pntd.0001529. - DOI - PMC - PubMed
-
- Lukashevich I.S., Tikhonov I., Rodas J.D., Zapata J.C., Yang Y., Djavani M., Salvato M.S. Arenavirus-mediated liver pathology: Acute lymphocytic choriomeningitis virus infection of rhesus macaques is characterized by high-level interleukin-6 expression and hepatocyte proliferation. J. Virol. 2003;77:1727–1737. doi: 10.1128/JVI.77.3.1727-1737.2003. - DOI - PMC - PubMed
Publication types
MeSH terms
Substances
Grants and funding
- S163/10135/2017/German Liver Foundation
- SFB900-C7, Projektnummer 158989968/Deutsche Forschungsgemeinschaft
- Professorinnen Programm III/Federal Ministry of Education and Research together with the Ministry of Science and Culture of Lower Saxony
- SO-024/Helmholtz Association
- CRSII3_160780/1./Swiss National Fonds grant SINERGIA
LinkOut - more resources
Full Text Sources
